| Param | Original file | Final file |
|---|---|---|
| Filename | modeM0/AS1T05_239T01_9000006444_50634cztM0_level2.fits | modeM0/AS1T05_239T01_9000006444_50634cztM0_level2_quad_clean.evt |
| Size (bytes) | 608,474,880 | 84,867,840 |
| Size | 580.3 MB | 80.9 MB |
| Events in quadrant A | 3,688,495 | 592,057 |
| Events in quadrant B | 9,723,085 | 443,692 |
| Events in quadrant C | 4,688,620 | 550,977 |
| Events in quadrant D | 3,927,232 | 536,370 |
| Mode M0 | |||
|---|---|---|---|
| Quadrant | BADHDUFLAG | Total packets | Discarded packets |
| A | 0 | 15237 | 1 |
| B | 0 | 33362 | 1 |
| C | 0 | 18316 | 1 |
| D | 0 | 16245 | 1 |
| Mode M9 | |||
|---|---|---|---|
| Quadrant | BADHDUFLAG | Total packets | Discarded packets |
| A | 0 | 9 | 0 |
| B | 0 | 9 | 0 |
| C | 0 | 9 | 0 |
| D | 0 | 9 | 0 |
| Mode SS | |||
|---|---|---|---|
| Quadrant | BADHDUFLAG | Total packets | Discarded packets |
| A | 0 | 130 | 0 |
| B | 0 | 130 | 0 |
| C | 0 | 130 | 0 |
| D | 0 | 130 | 0 |
| Quadrant | Total seconds | Saturated seconds | Saturation percentage |
|---|---|---|---|
| A | 6399 | 209 | 3.266135% |
| B | 6399 | 2235 | 34.927332% |
| C | 6399 | 459 | 7.172996% |
| D | 6400 | 173 | 2.703125% |
Noise dominated data is calculated using 1-second bins in cleaned event files. If a bin has >2000 counts, and if more than 50% of those come from <1% of pixels, then it is considered to be noise-dominated and hence unusable.
| Quadrant | # 1 sec bins | Bins with >0 counts | Bins with >2000 counts | High rate bins dominated by noise | Noise dominated (total time) | Noise dominated (detector-on time) | Marked lightcurve |
|---|---|---|---|---|---|---|---|
| A | 7324 | 6400 | 134 | 134 | 1.83% | 2.09% | 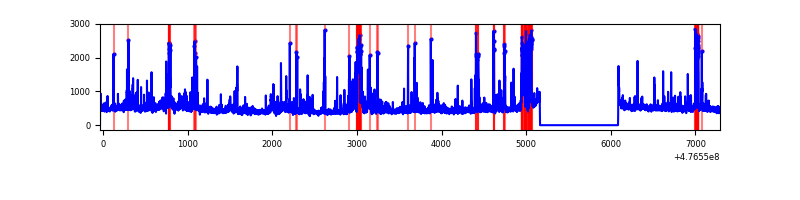 |
| B | 7324 | 6400 | 1775 | 1775 | 24.24% | 27.73% | 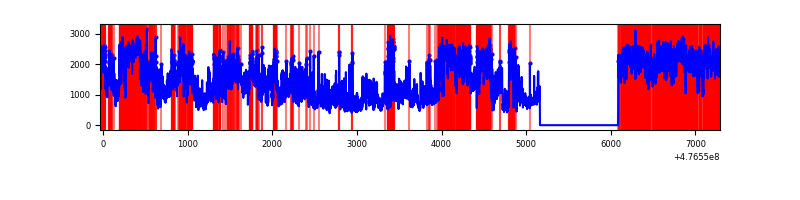 |
| C | 7324 | 6400 | 380 | 380 | 5.19% | 5.94% | 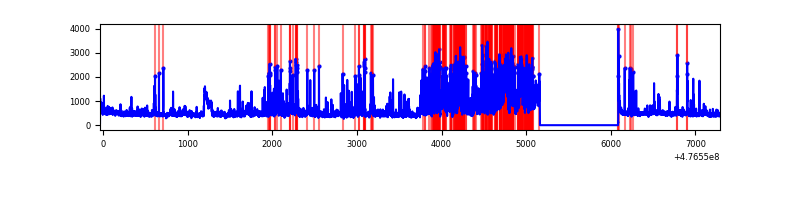 |
| D | 7325 | 6401 | 132 | 132 | 1.80% | 2.06% | 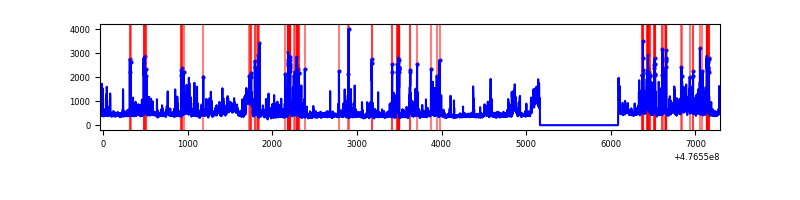 |
Top three noisy pixels from each quadrant. If the there are fewer than three noisy pixels in the level2.evt file, extra rows are filled as -1
| Pixel properties | Quadrant properties | ||||||
|---|---|---|---|---|---|---|---|
| Quadrant | DetID | PixID | Counts | Sigma | Mean | Median | Sigma |
| A | 12 | 250 | 399900 | 2428.69 | 669 | 652 | 164.4 |
| A | 4 | 3 | 151527 | 917.8 | 669 | 652 | 164.4 |
| A | 8 | 38 | 78903 | 476.01 | 669 | 652 | 164.4 |
| B | 4 | 170 | 6001184 | 47384.5 | 594 | 574 | 126.6 |
| B | 5 | 172 | 673223 | 5311.65 | 594 | 574 | 126.6 |
| B | 5 | 185 | 274018 | 2159.28 | 594 | 574 | 126.6 |
| C | 15 | 174 | 1303507 | 7309.21 | 645 | 639 | 178.3 |
| C | 0 | 176 | 160305 | 895.74 | 645 | 639 | 178.3 |
| C | 13 | 3 | 113661 | 634.06 | 645 | 639 | 178.3 |
| D | 7 | 96 | 229149 | 1262.44 | 651 | 628 | 181.0 |
| D | 2 | 249 | 191483 | 1054.35 | 651 | 628 | 181.0 |
| D | 8 | 246 | 147714 | 812.56 | 651 | 628 | 181.0 |
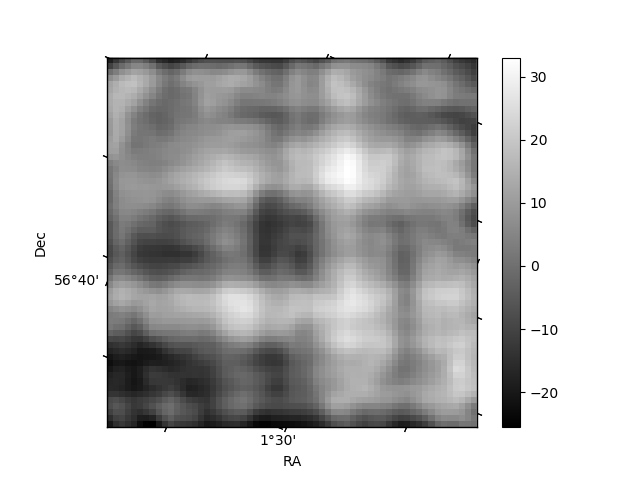
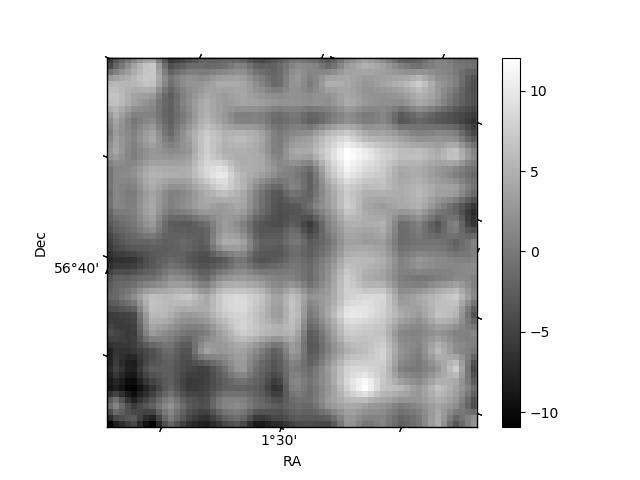
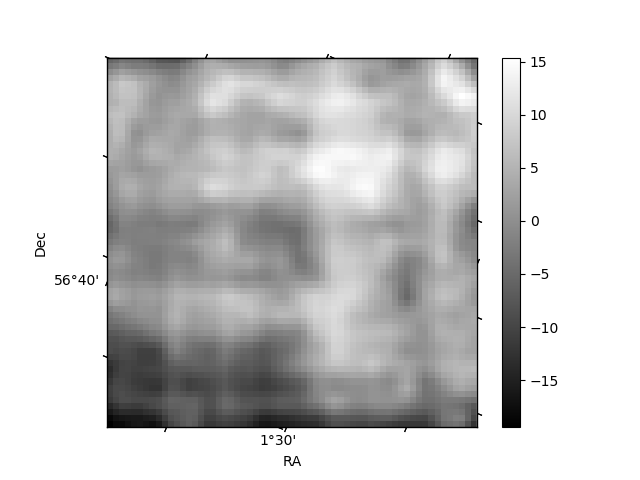
Histogram calculated using DETX and DETY for each event in the final _common_clean file
| Quadrant A | 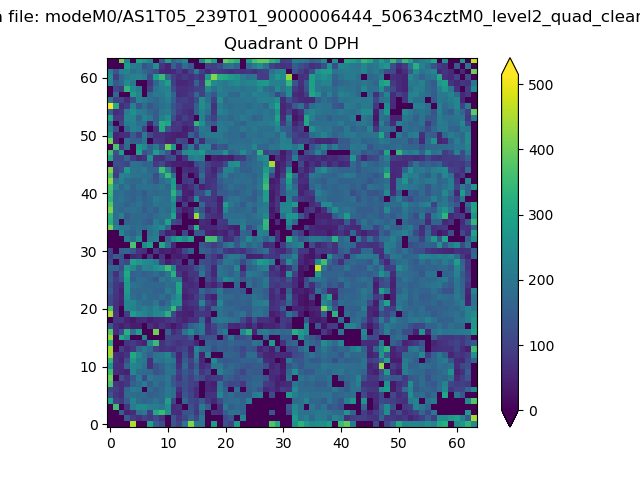 |
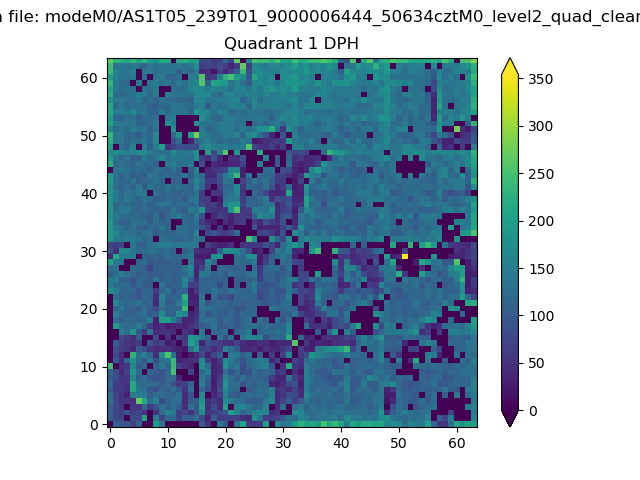 |
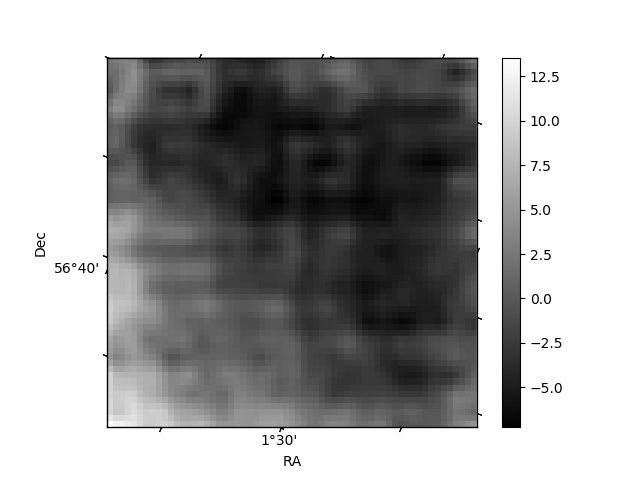
Quadrant B |
|---|---|---|---|
| Quadrant D | 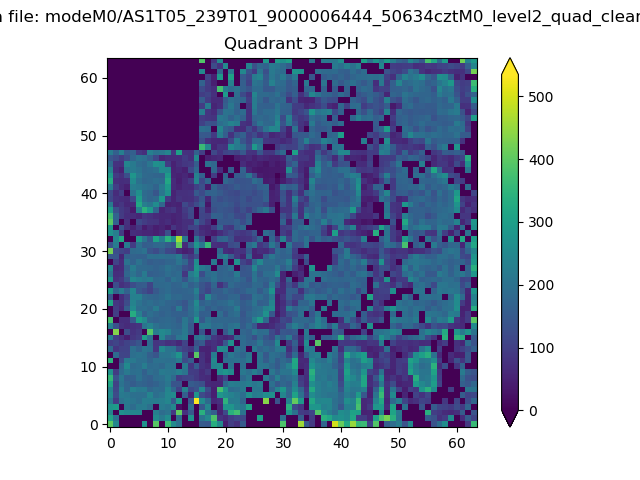 |
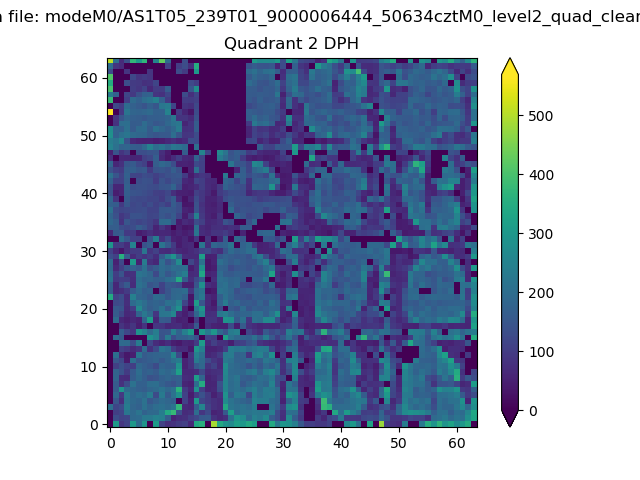 |
Quadrant C |
| Plot type | Count rate plots | Images |
|---|---|---|
| Comparison with Poisson distribution Blue bars denote a histogram of data divided into 1 sec bins. Red curve is a Poisson curve with rate = median count rate of data. |
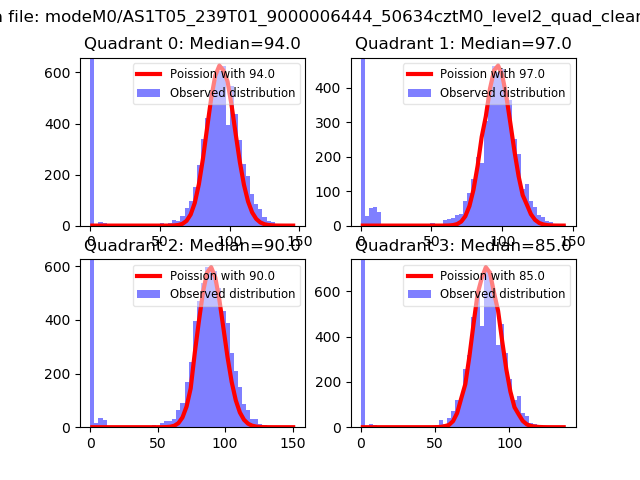 |
 |
| Quadrant-wise count rates Data is divided into 100 sec bins |
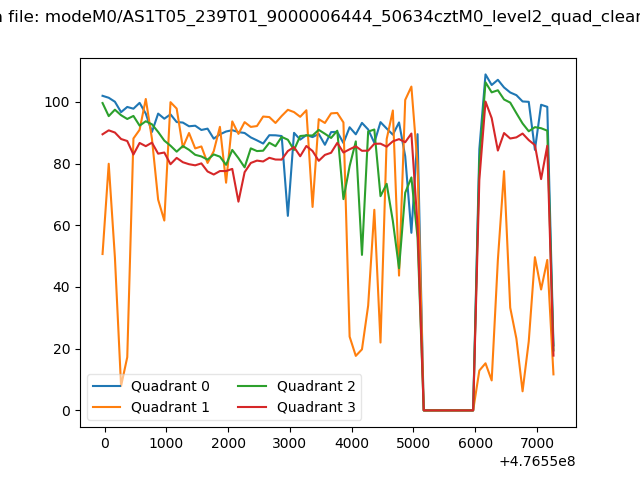 |
|
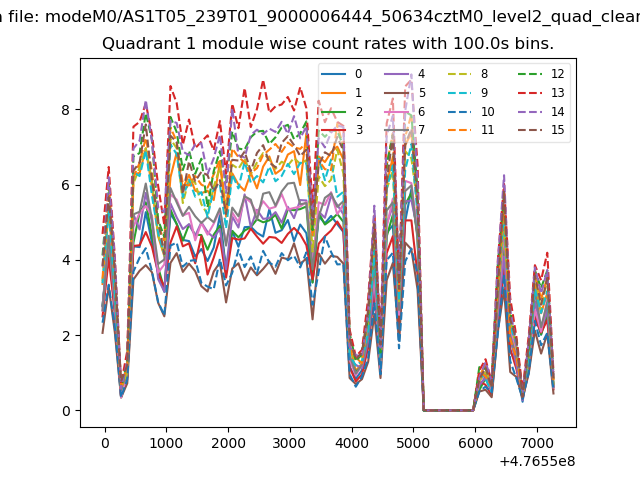
| Module-wise count rates for Quadrant A Data is divided into 100 sec bins |
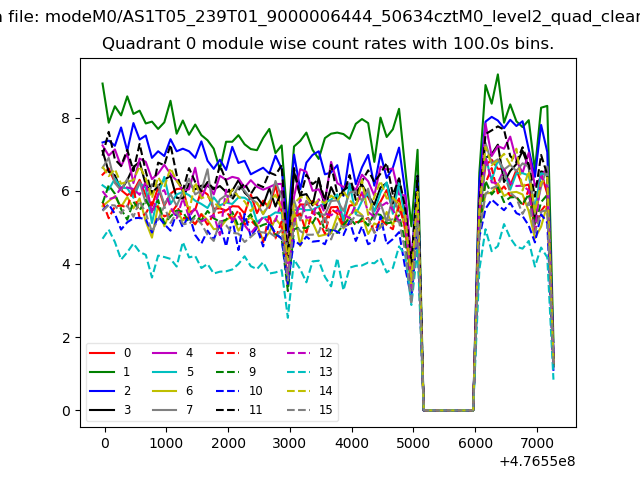 |
 |
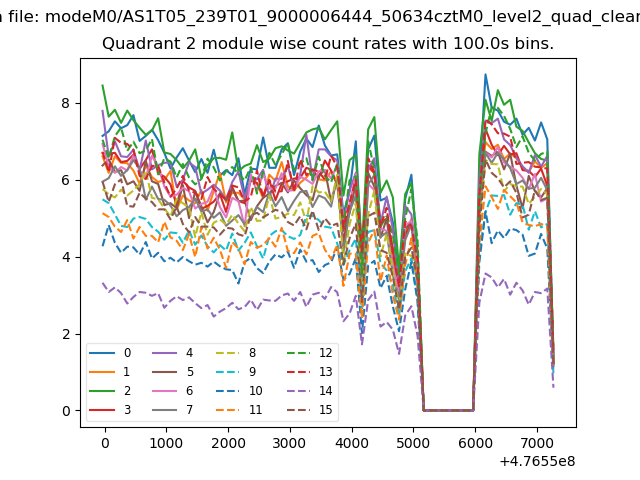
| Module-wise count rates for Quadrant B Data is divided into 100 sec bins |
 |
 |
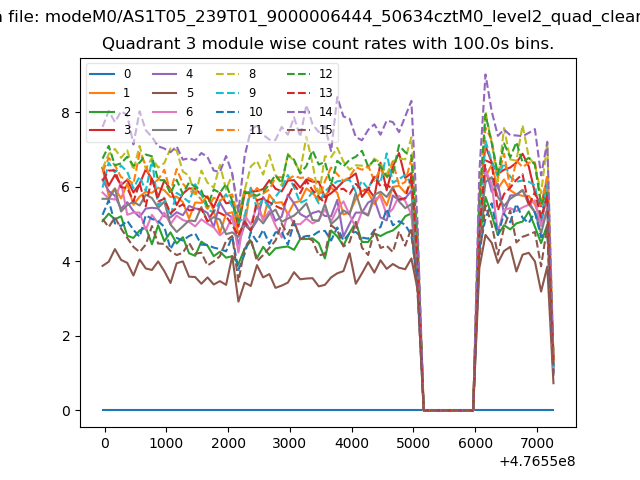
| Module-wise count rates for Quadrant C Data is divided into 100 sec bins |
 |
 |
| Module-wise count rates for Quadrant D Data is divided into 100 sec bins |
 |
 |
| Parameter | Plot |
|---|---|
| CZT HV Monitor | 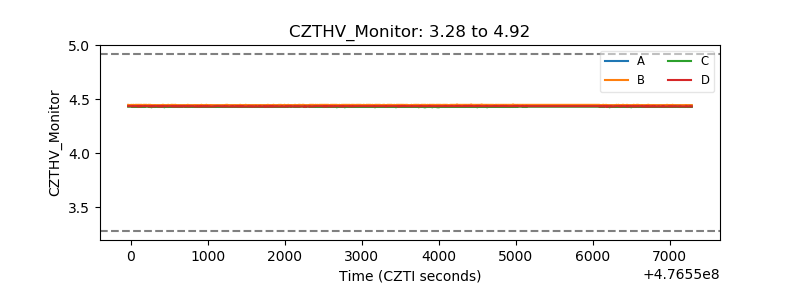 |
| D_VDD | 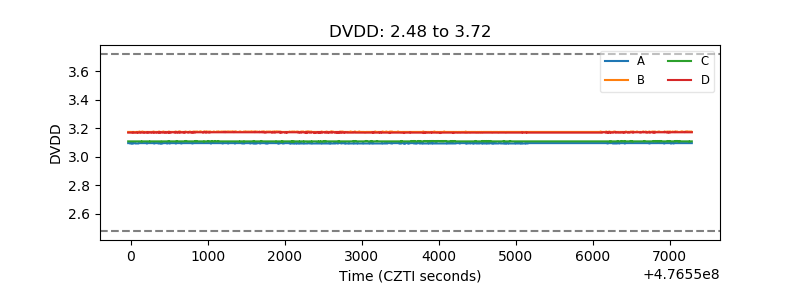 |
| Temperature 1 | 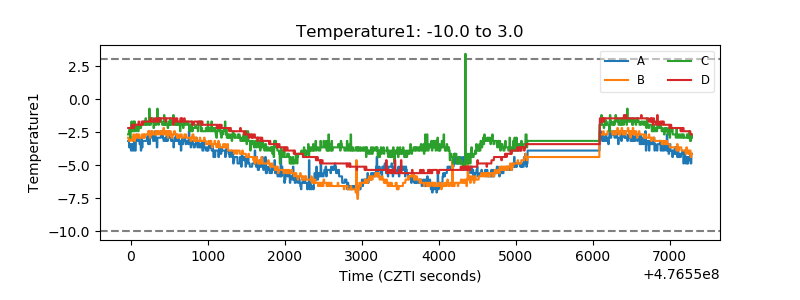 |
| Veto HV Monitor | 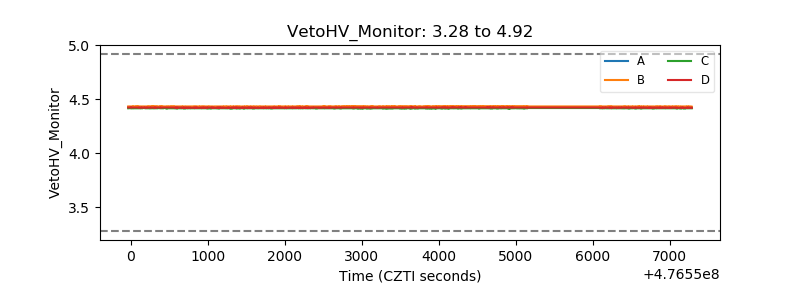 |
| Veto LLD | 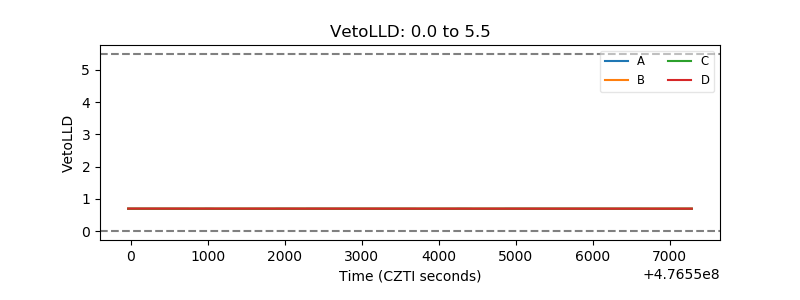 |
| Alpha Counter | 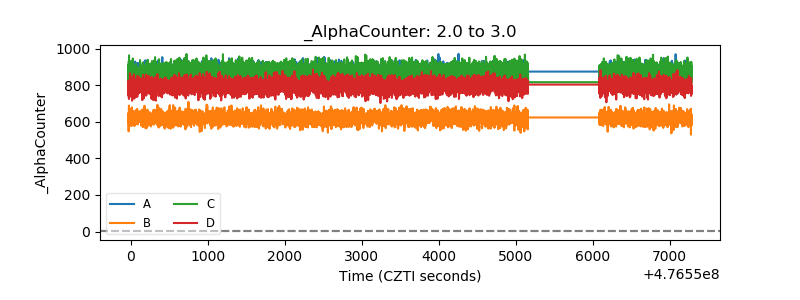 |
| _CPM_Rate | 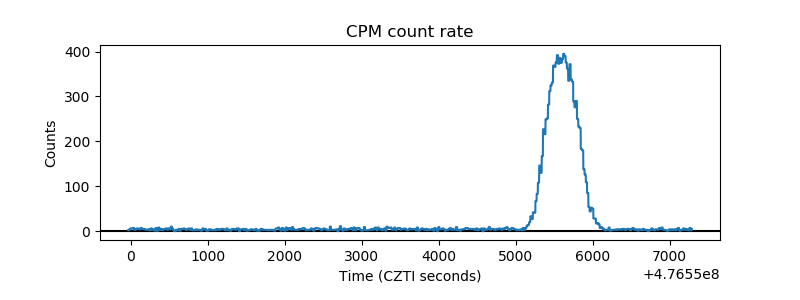 |
| CZT Counter | 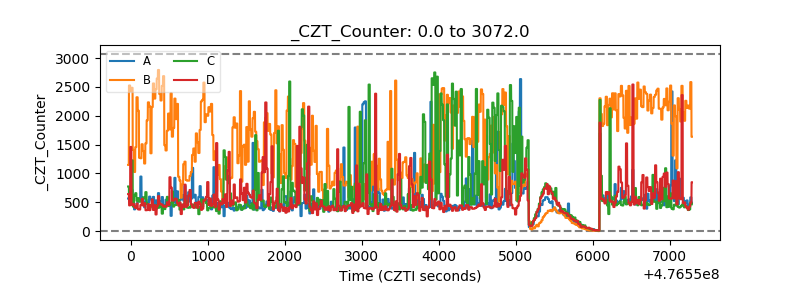 |
| +2.5 Volts monitor | 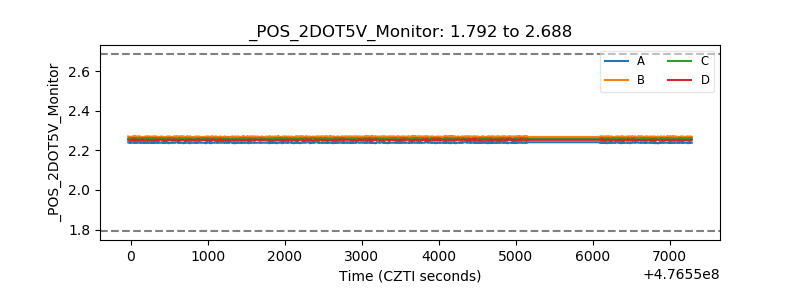 |
| +5 Volts monitor |  |
| _ROLL_ROT | 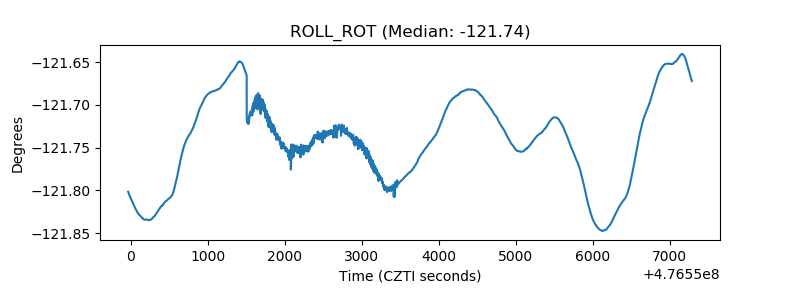 |
| _Roll_DEC | 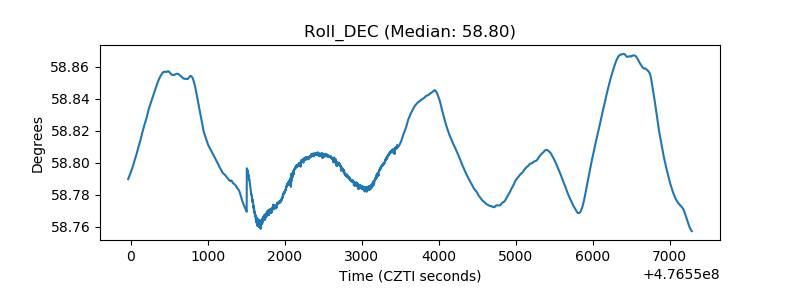 |
| _Roll_RA | 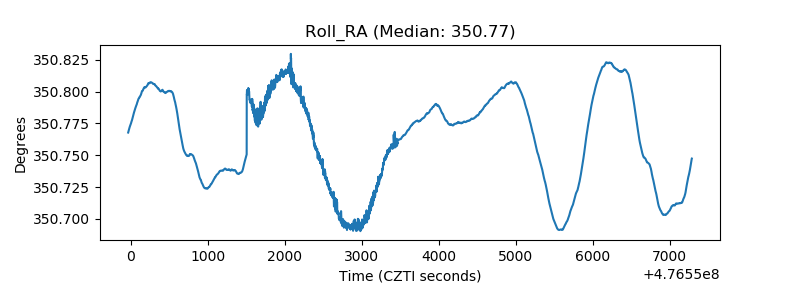 |
| Veto Counter | 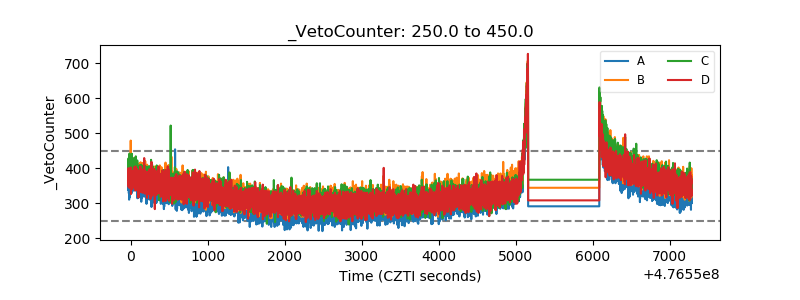 |