| Param | Original file | Final file |
|---|---|---|
| Filename | modeM0/AS1T05_241T01_9000006446cztM0_level2.fits | modeM0/AS1T05_241T01_9000006446cztM0_level2_quad_clean.evt |
| Size (bytes) | 2,711,520,000 | 3,879,486,720 |
| Size | 2.5 GB | 3.6 GB |
| Events in quadrant A | 15,861,514 | 24,833,410 |
| Events in quadrant B | 15,290,002 | 26,431,237 |
| Events in quadrant C | 14,193,924 | 20,921,747 |
| Events in quadrant D | 13,452,952 | 22,061,609 |
| Mode M9 | |||
|---|---|---|---|
| Quadrant | BADHDUFLAG | Total packets | Discarded packets |
| A | 0 | 371 | 0 |
| B | 0 | 372 | 0 |
| C | 0 | 372 | 0 |
| D | 0 | 372 | 0 |
| Mode M0 | |||
|---|---|---|---|
| Quadrant | BADHDUFLAG | Total packets | Discarded packets |
| A | 0 | 1049641 | 0 |
| B | 0 | 1062147 | 0 |
| C | 0 | 1330943 | 0 |
| D | 0 | 1063093 | 0 |
| Mode SS | |||
|---|---|---|---|
| Quadrant | BADHDUFLAG | Total packets | Discarded packets |
| A | 0 | 6878 | 0 |
| B | 0 | 6878 | 0 |
| C | 0 | 6878 | 0 |
| D | 0 | 6878 | 0 |
| Quadrant | Total seconds | Saturated seconds | Saturation percentage |
|---|---|---|---|
| A | 339445 | 25415 | 7.487222% |
| B | 339434 | 33281 | 9.804852% |
| C | 339434 | 67931 | 20.013022% |
| D | 339446 | 28922 | 8.520354% |
Noise dominated data is calculated using 1-second bins in cleaned event files. If a bin has >2000 counts, and if more than 50% of those come from <1% of pixels, then it is considered to be noise-dominated and hence unusable.
| Quadrant | # 1 sec bins | Bins with >0 counts | Bins with >2000 counts | High rate bins dominated by noise | Noise dominated (total time) | Noise dominated (detector-on time) | Marked lightcurve |
|---|---|---|---|---|---|---|---|
| A | 388081 | 339299 | 0 | 0 | 0.00% | 0.00% | 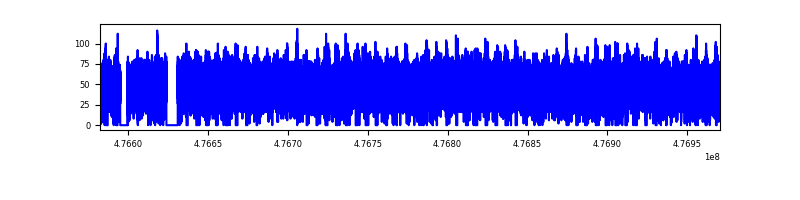 |
| B | 388081 | 339233 | 0 | 0 | 0.00% | 0.00% | 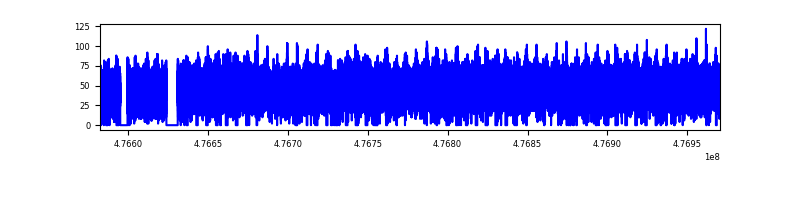 |
| C | 388081 | 335701 | 0 | 0 | 0.00% | 0.00% | 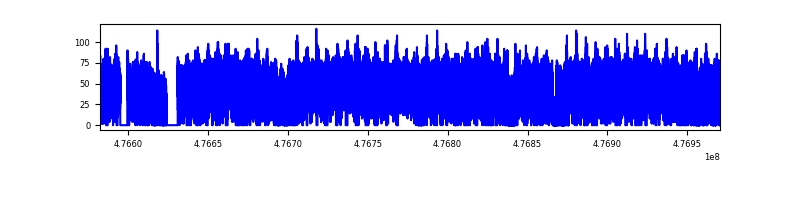 |
| D | 388081 | 338966 | 0 | 0 | 0.00% | 0.00% | 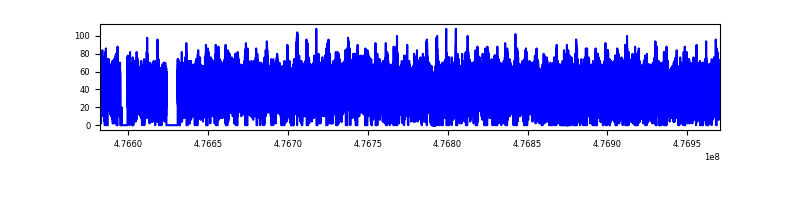 |
Top three noisy pixels from each quadrant. If the there are fewer than three noisy pixels in the level2.evt file, extra rows are filled as -1
| Pixel properties | Quadrant properties | ||||||
|---|---|---|---|---|---|---|---|
| Quadrant | DetID | PixID | Counts | Sigma | Mean | Median | Sigma |
| A | 14 | 188 | 17000 | 9.72 | 4212 | 3905 | 1347.5 |
| A | 9 | 255 | 16313 | 9.21 | 4212 | 3905 | 1347.5 |
| A | 14 | 204 | 13807 | 7.35 | 4212 | 3905 | 1347.5 |
| B | 2 | 9 | 17090 | 14.12 | 4060 | 3855 | 937.2 |
| B | 2 | 8 | 15791 | 12.74 | 4060 | 3855 | 937.2 |
| B | 2 | 245 | 12131 | 8.83 | 4060 | 3855 | 937.2 |
| C | 7 | 221 | 12183 | 6.74 | 3844 | 3504 | 1288.6 |
| C | 2 | 31 | 11350 | 6.09 | 3844 | 3504 | 1288.6 |
| C | 6 | 64 | 11087 | 5.88 | 3844 | 3504 | 1288.6 |
| D | 6 | 218 | 17312 | 10.78 | 3883 | 3460 | 1284.9 |
| D | 3 | 30 | 13349 | 7.7 | 3883 | 3460 | 1284.9 |
| D | 14 | 31 | 11869 | 6.54 | 3883 | 3460 | 1284.9 |
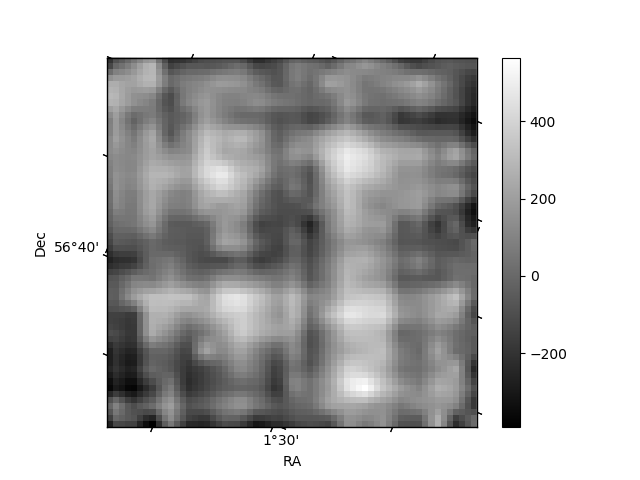
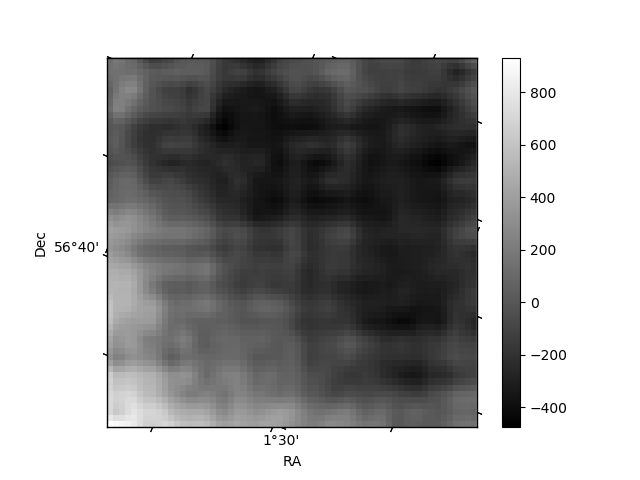
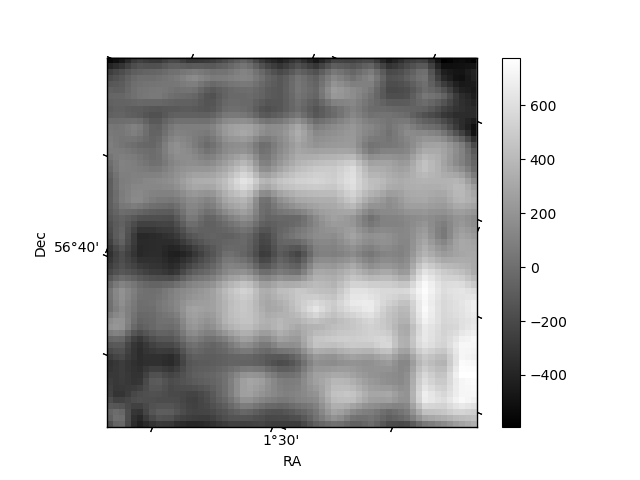
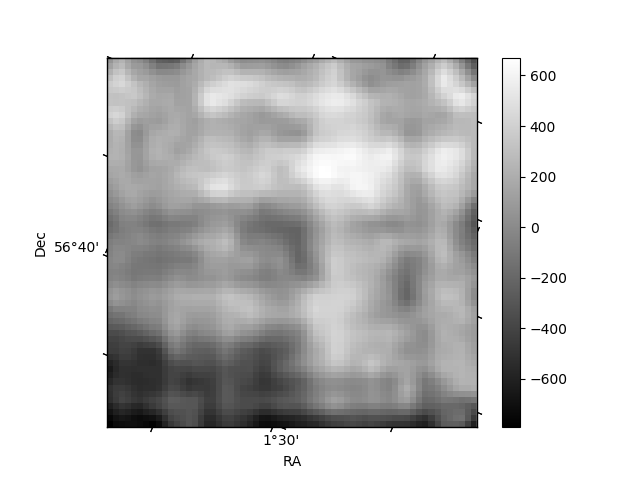
Histogram calculated using DETX and DETY for each event in the final _common_clean file
| Quadrant A | 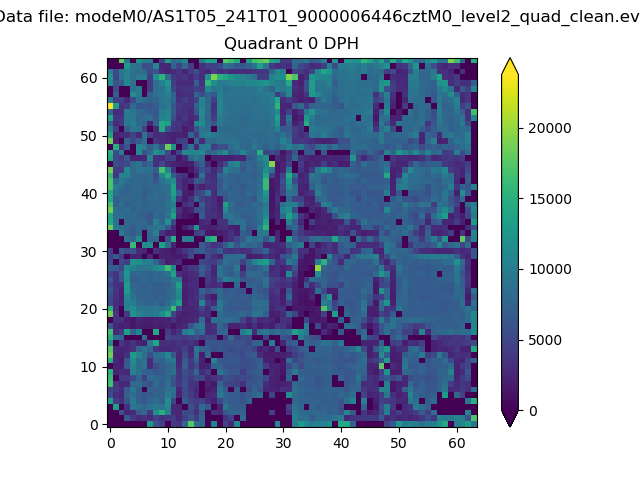 |
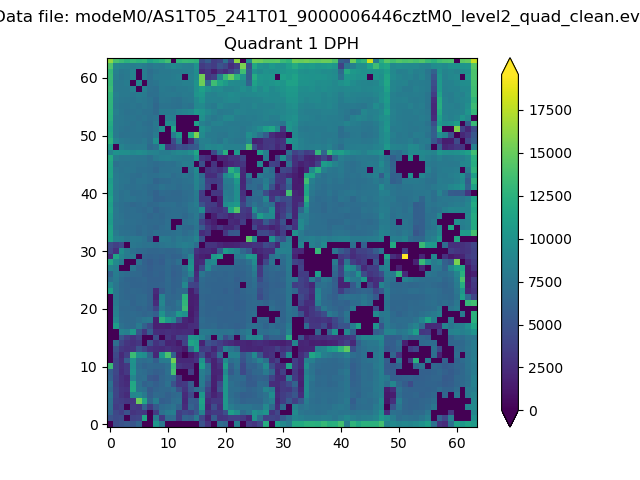 |
Quadrant B |
|---|---|---|---|
| Quadrant D | 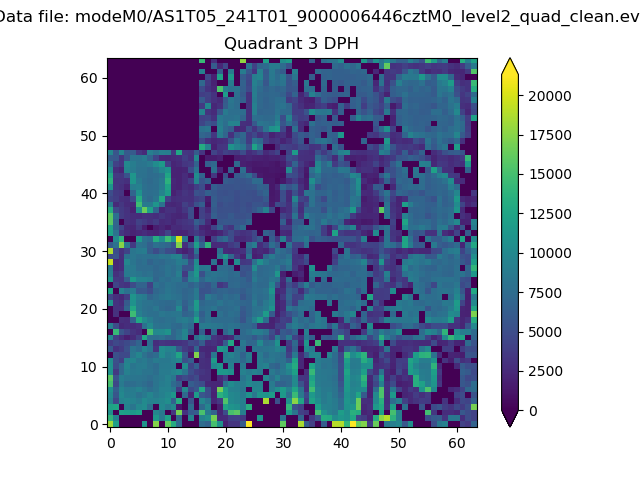 |
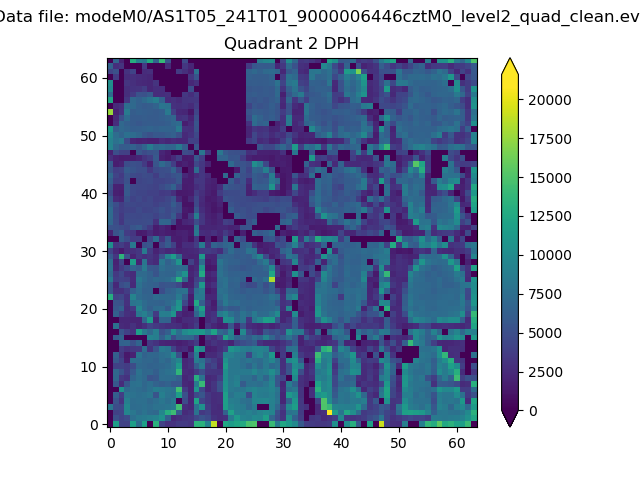 |
Quadrant C |
| Plot type | Count rate plots | Images |
|---|---|---|
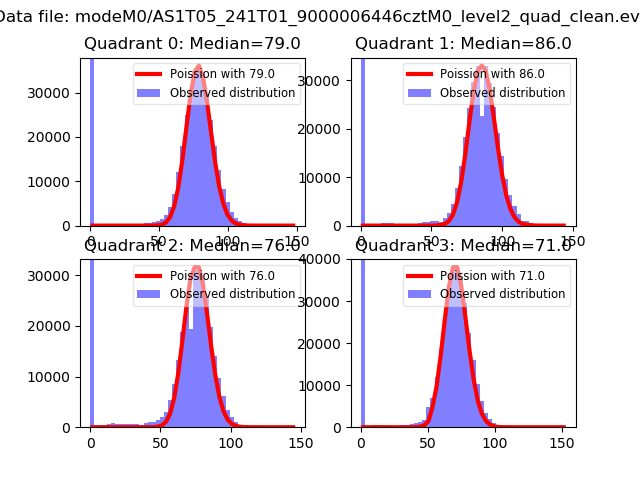
| Comparison with Poisson distribution Blue bars denote a histogram of data divided into 1 sec bins. Red curve is a Poisson curve with rate = median count rate of data. |
 |
 |
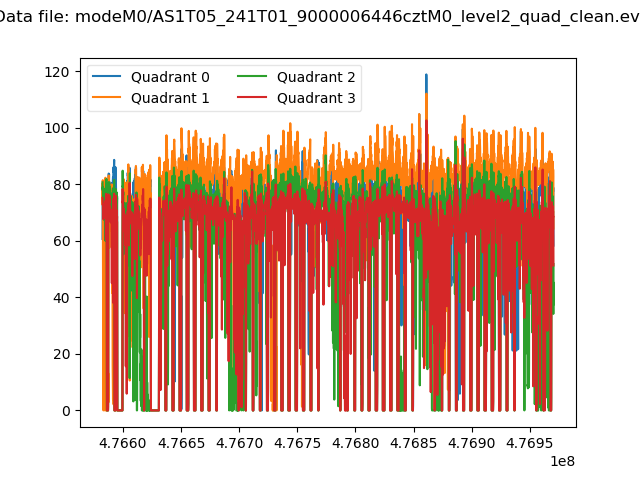
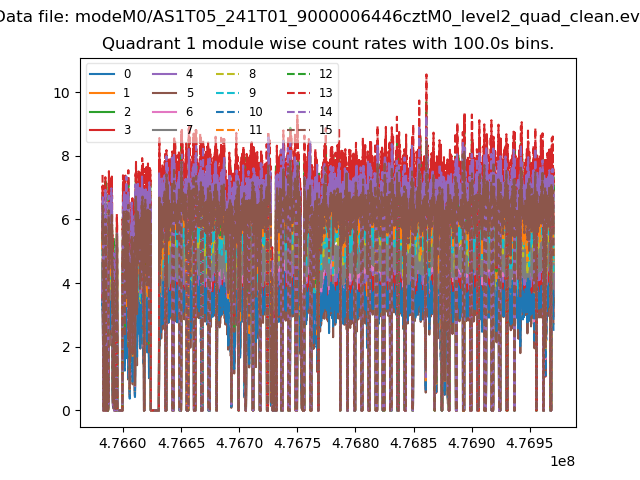
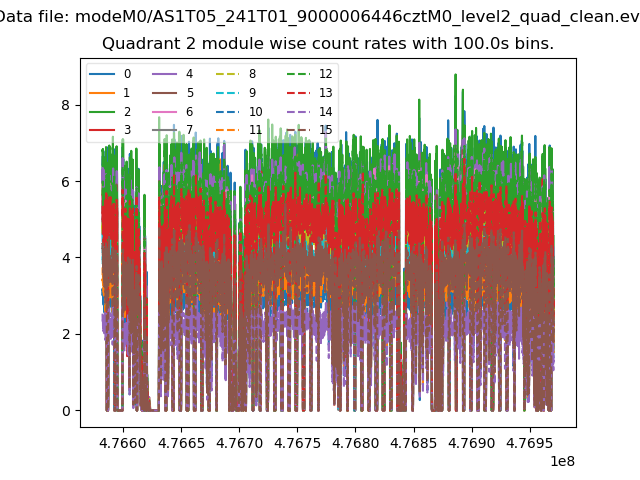
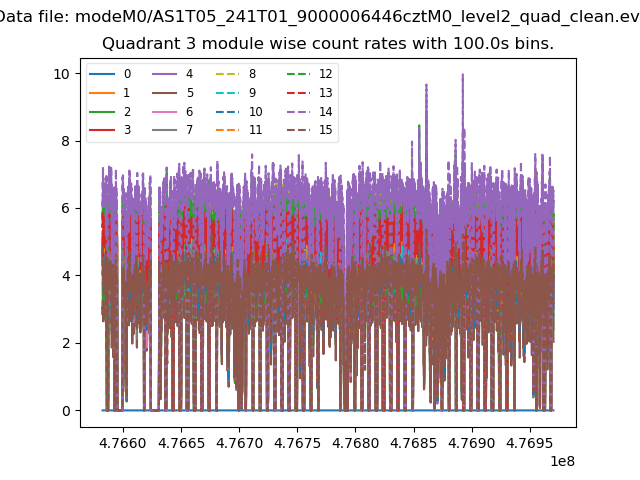
| Quadrant-wise count rates Data is divided into 100 sec bins |
 |
|
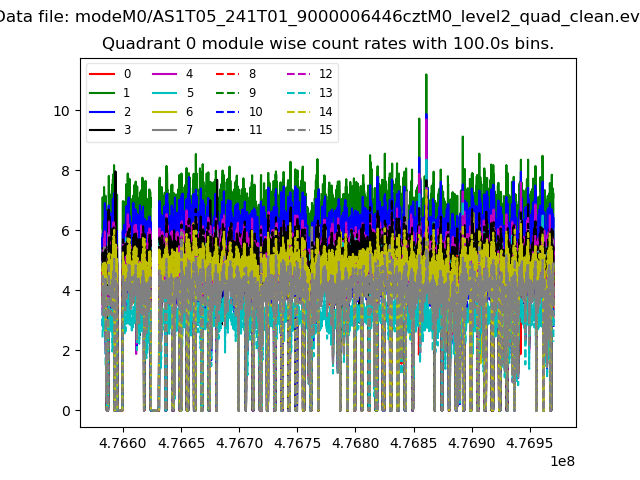
| Module-wise count rates for Quadrant A Data is divided into 100 sec bins |
 |
 |
| Module-wise count rates for Quadrant B Data is divided into 100 sec bins |
 |
 |
| Module-wise count rates for Quadrant C Data is divided into 100 sec bins |
 |
 |
| Module-wise count rates for Quadrant D Data is divided into 100 sec bins |
 |
 |
| Parameter | Plot |
|---|---|
| CZT HV Monitor | 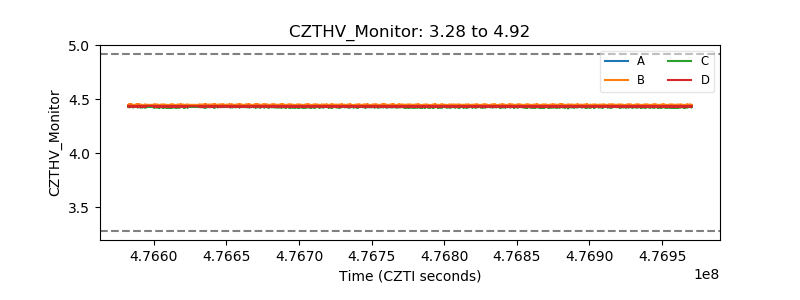 |
| D_VDD | 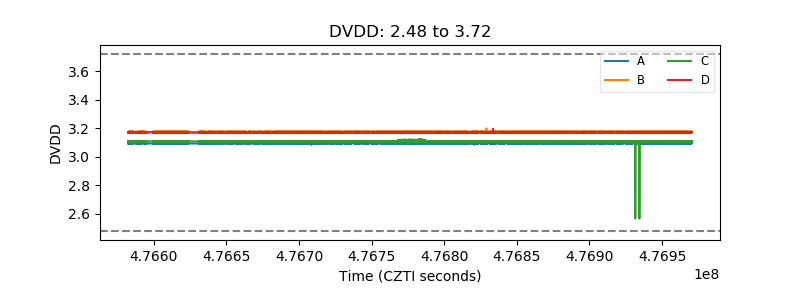 |
| Temperature 1 | 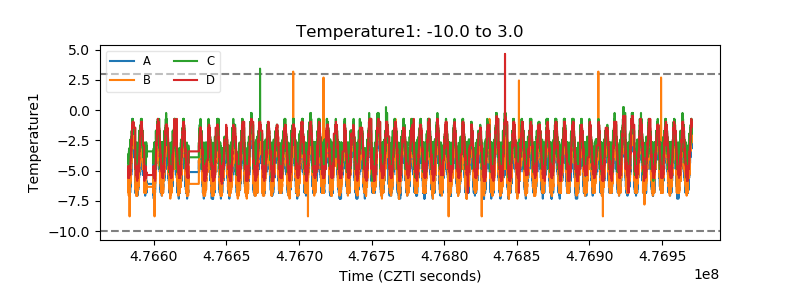 |
| Veto HV Monitor | 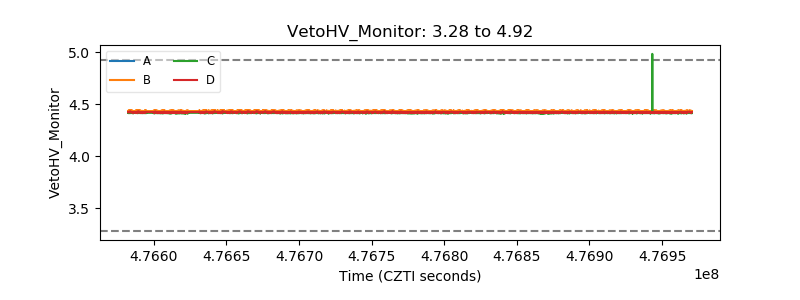 |
| Veto LLD | 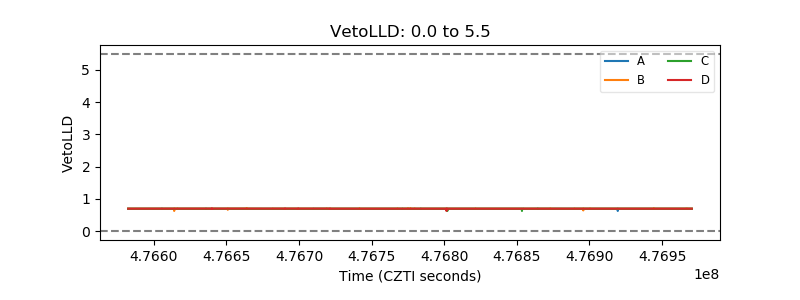 |
| Alpha Counter | 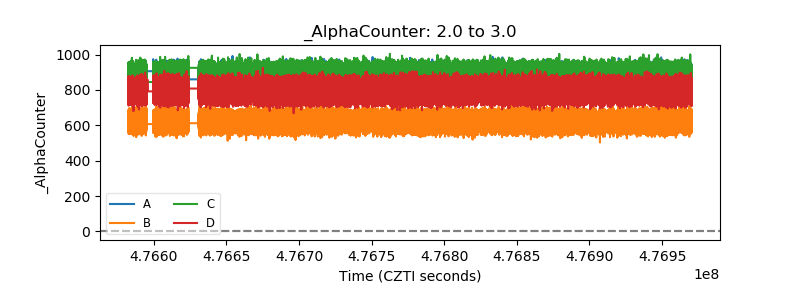 |
| _CPM_Rate | 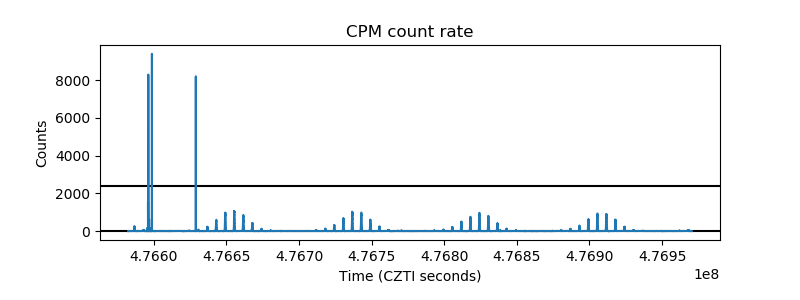 |
| CZT Counter | 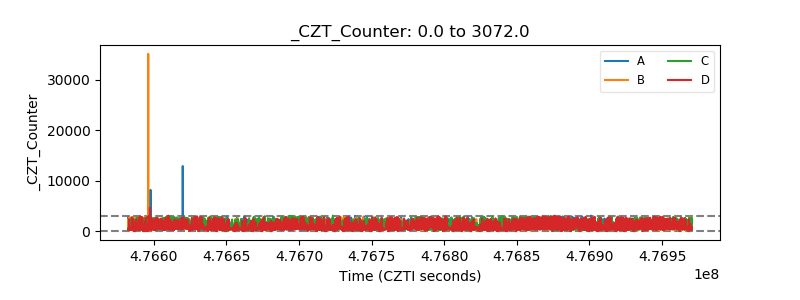 |
| +2.5 Volts monitor | 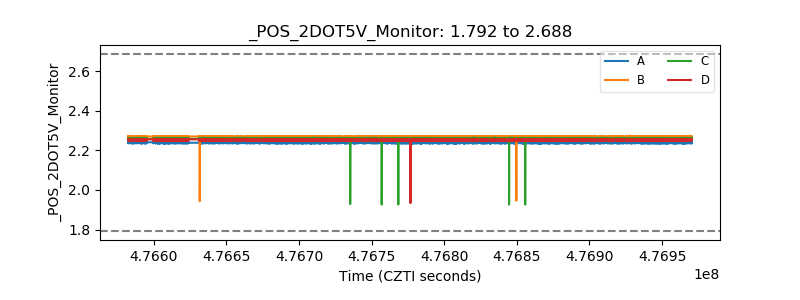 |
| +5 Volts monitor | 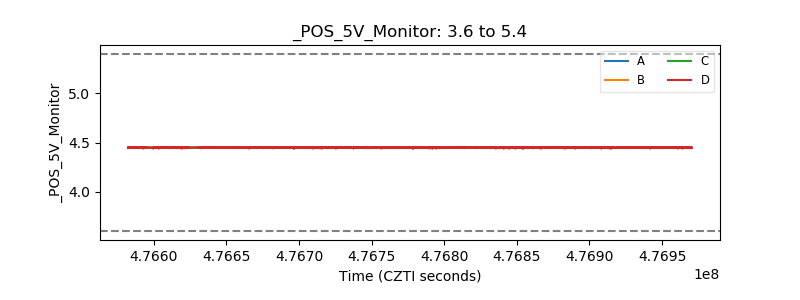 |
| _ROLL_ROT | 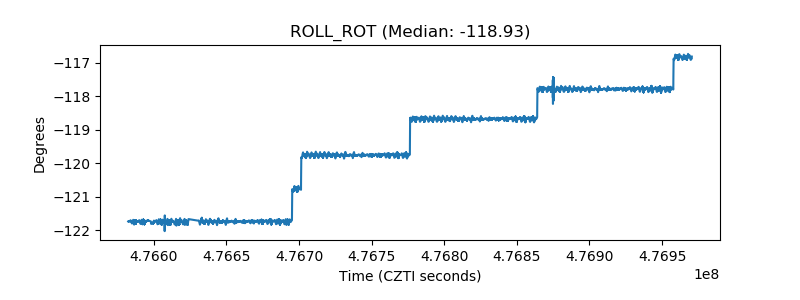 |
| _Roll_DEC | 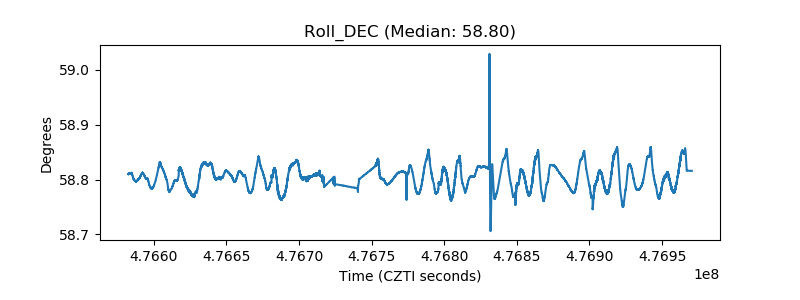 |
| _Roll_RA | 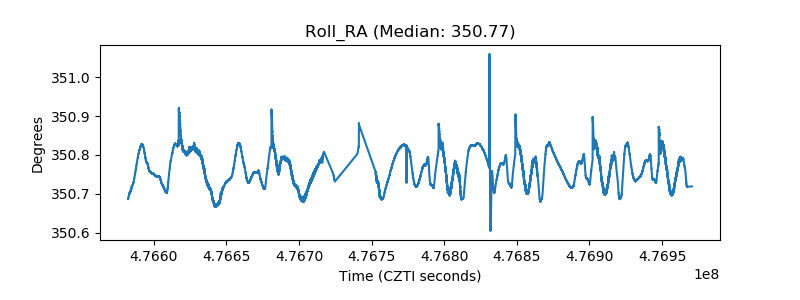 |
| Veto Counter | 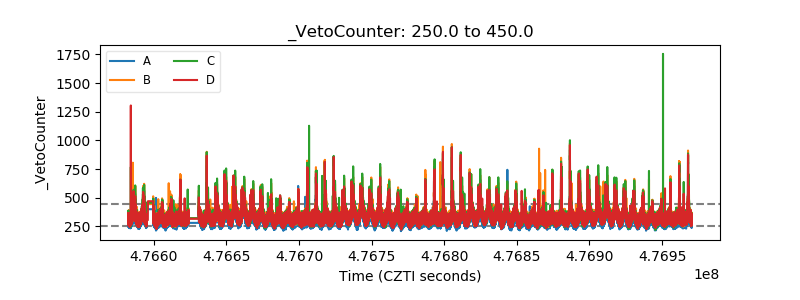 |