| Param | Original file | Final file |
|---|---|---|
| Filename | modeM0/AS1T05_241T01_9000006446_50639cztM0_level2.fits | modeM0/AS1T05_241T01_9000006446_50639cztM0_level2_quad_clean.evt |
| Size (bytes) | 25,585,920 | 4,340,160 |
| Size | 24.4 MB | 4.1 MB |
| Events in quadrant A | 282,704 | 23,745 |
| Events in quadrant B | 375,127 | 27,050 |
| Events in quadrant C | 140,932 | 26,446 |
| Events in quadrant D | 120,522 | 24,534 |
| Mode M0 | |||
|---|---|---|---|
| Quadrant | BADHDUFLAG | Total packets | Discarded packets |
| A | 0 | 1065 | 0 |
| B | 0 | 1334 | 0 |
| C | 0 | 659 | 0 |
| D | 0 | 627 | 0 |
| Mode SS | |||
|---|---|---|---|
| Quadrant | BADHDUFLAG | Total packets | Discarded packets |
| A | 0 | 6 | 0 |
| B | 0 | 6 | 0 |
| C | 0 | 6 | 0 |
| D | 0 | 6 | 0 |
| Quadrant | Total seconds | Saturated seconds | Saturation percentage |
|---|---|---|---|
| A | 311 | 28 | 9.003215% |
| B | 311 | 44 | 14.147910% |
| C | 311 | 2 | 0.643087% |
| D | 311 | 0 | 0.000000% |
Noise dominated data is calculated using 1-second bins in cleaned event files. If a bin has >2000 counts, and if more than 50% of those come from <1% of pixels, then it is considered to be noise-dominated and hence unusable.
| Quadrant | # 1 sec bins | Bins with >0 counts | Bins with >2000 counts | High rate bins dominated by noise | Noise dominated (total time) | Noise dominated (detector-on time) | Marked lightcurve |
|---|---|---|---|---|---|---|---|
| A | 311 | 311 | 32 | 32 | 10.29% | 10.29% | 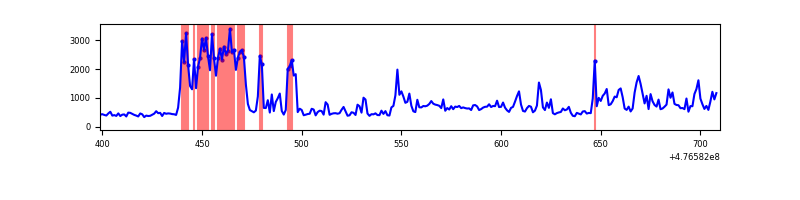 |
| B | 311 | 311 | 33 | 33 | 10.61% | 10.61% | 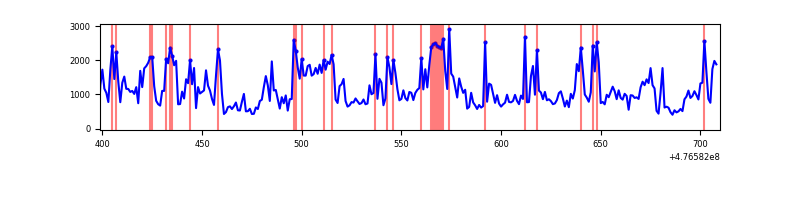 |
| C | 311 | 311 | 1 | 1 | 0.32% | 0.32% | 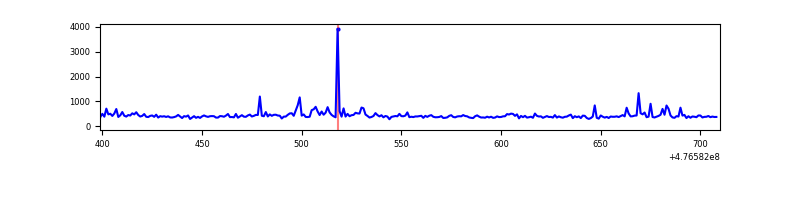 |
| D | 311 | 311 | 0 | 0 | 0.00% | 0.00% |  |
Top three noisy pixels from each quadrant. If the there are fewer than three noisy pixels in the level2.evt file, extra rows are filled as -1
| Pixel properties | Quadrant properties | ||||||
|---|---|---|---|---|---|---|---|
| Quadrant | DetID | PixID | Counts | Sigma | Mean | Median | Sigma |
| A | 8 | 38 | 127622 | 14492.71 | 28 | 27 | 8.8 |
| A | 4 | 4 | 26674 | 3026.66 | 28 | 27 | 8.8 |
| A | 4 | 3 | 8109 | 917.98 | 28 | 27 | 8.8 |
| B | 4 | 170 | 220226 | 26510.04 | 29 | 29 | 8.3 |
| B | 5 | 185 | 13602 | 1634.09 | 29 | 29 | 8.3 |
| B | 0 | 171 | 6947 | 832.87 | 29 | 29 | 8.3 |
| C | 13 | 3 | 16381 | 1635.71 | 30 | 29 | 10.0 |
| C | 12 | 252 | 2643 | 261.48 | 30 | 29 | 10.0 |
| C | 0 | 176 | 2149 | 212.07 | 30 | 29 | 10.0 |
| D | 1 | 47 | 2129 | 219.64 | 29 | 27 | 9.6 |
| D | 5 | 173 | 1571 | 161.34 | 29 | 27 | 9.6 |
| D | 2 | 234 | 1531 | 157.16 | 29 | 27 | 9.6 |
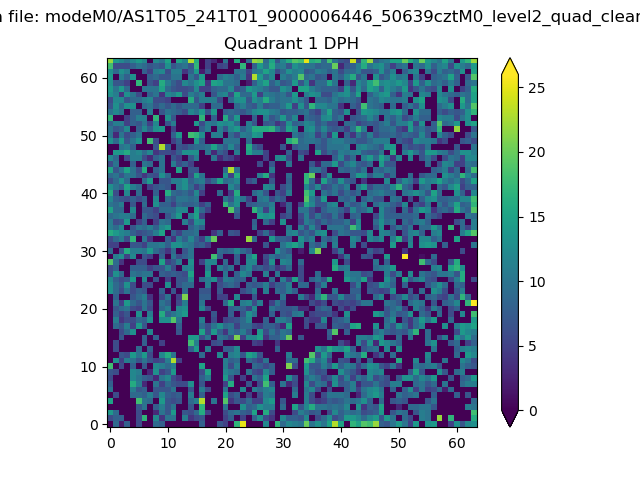
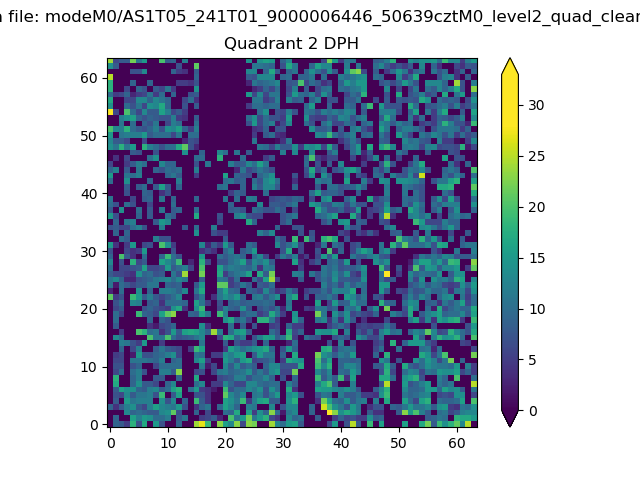
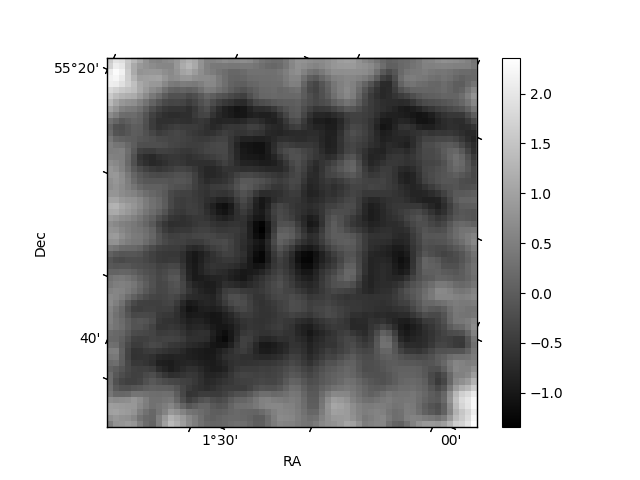
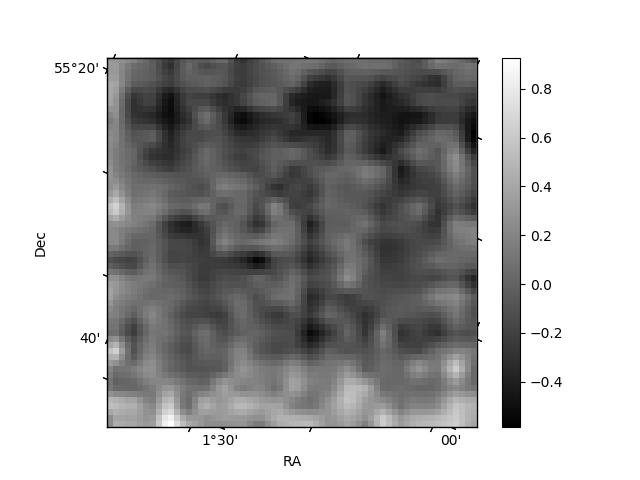
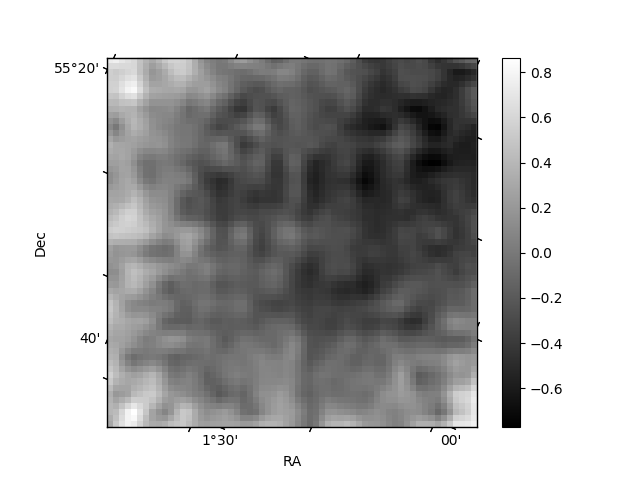
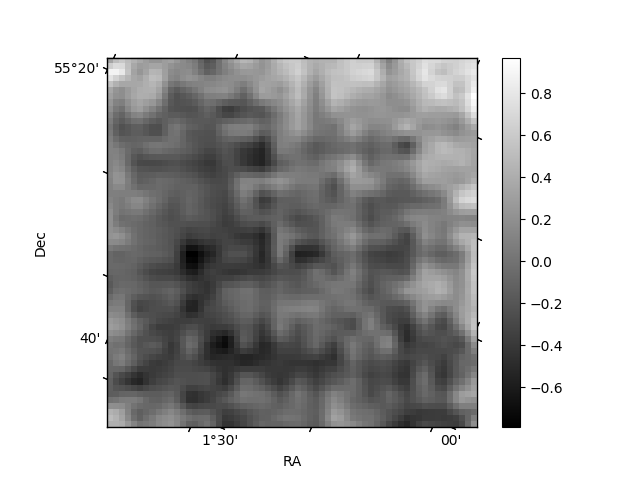
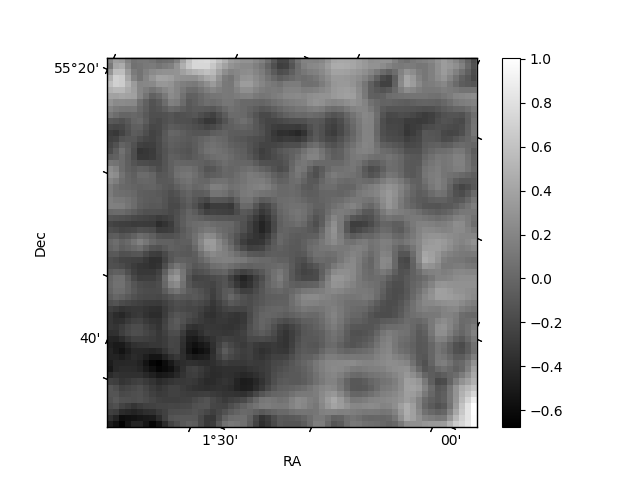
Histogram calculated using DETX and DETY for each event in the final _common_clean file
| Quadrant A | 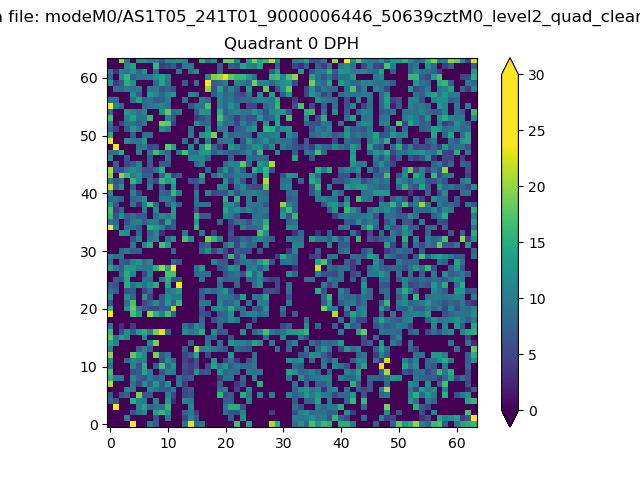 |
 |
Quadrant B |
|---|---|---|---|
| Quadrant D | 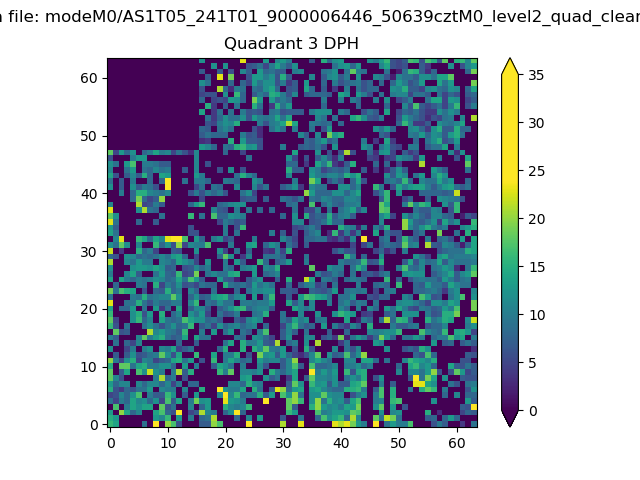 |
 |
Quadrant C |
| Plot type | Count rate plots | Images |
|---|---|---|
| Comparison with Poisson distribution Blue bars denote a histogram of data divided into 1 sec bins. Red curve is a Poisson curve with rate = median count rate of data. |
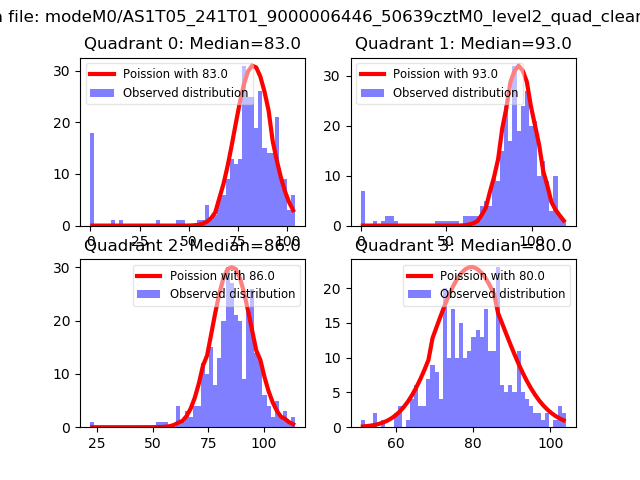 |
 |
| Quadrant-wise count rates Data is divided into 100 sec bins |
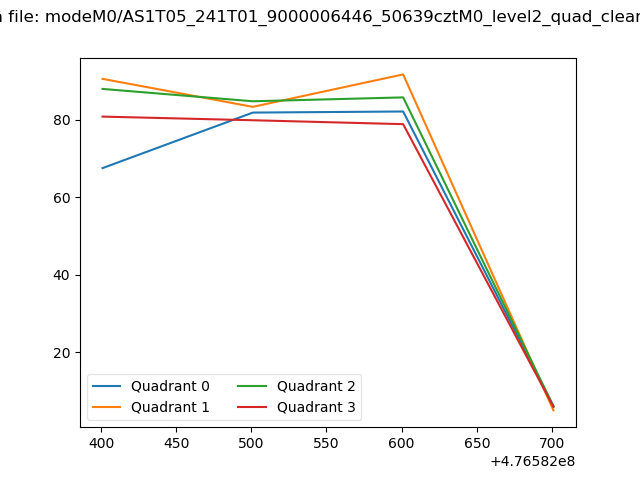 |
|
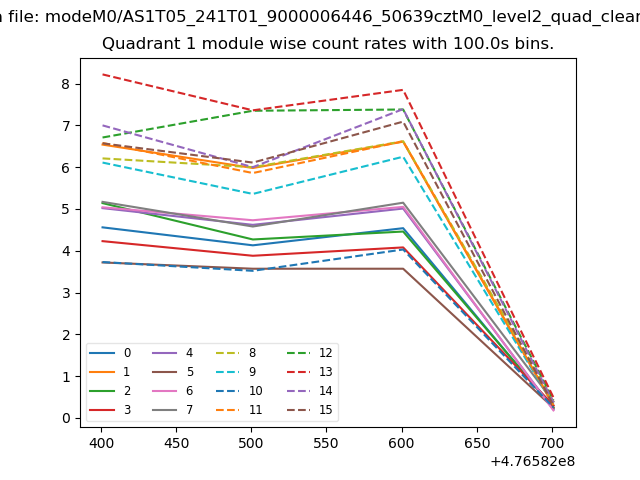
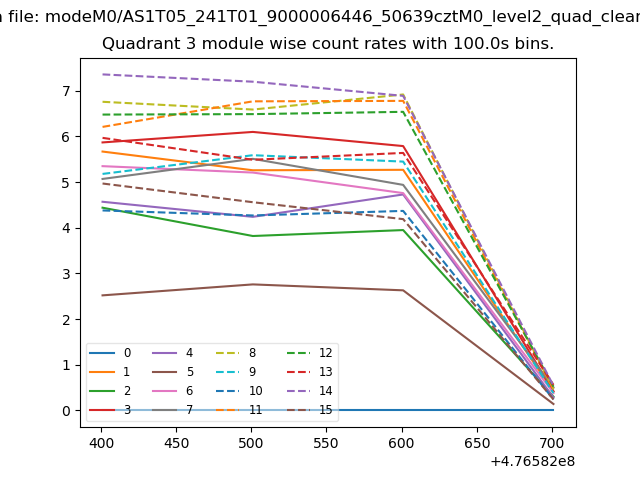
| Module-wise count rates for Quadrant A Data is divided into 100 sec bins |
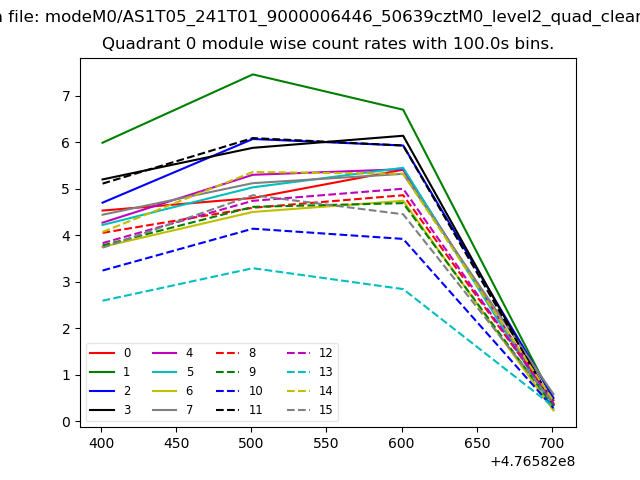 |
 |
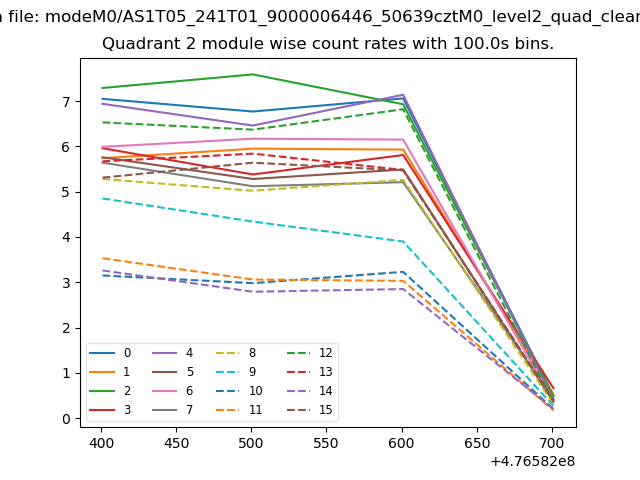
| Module-wise count rates for Quadrant B Data is divided into 100 sec bins |
 |
 |
| Module-wise count rates for Quadrant C Data is divided into 100 sec bins |
 |
 |
| Module-wise count rates for Quadrant D Data is divided into 100 sec bins |
 |
 |
| Parameter | Plot |
|---|---|
| CZT HV Monitor | 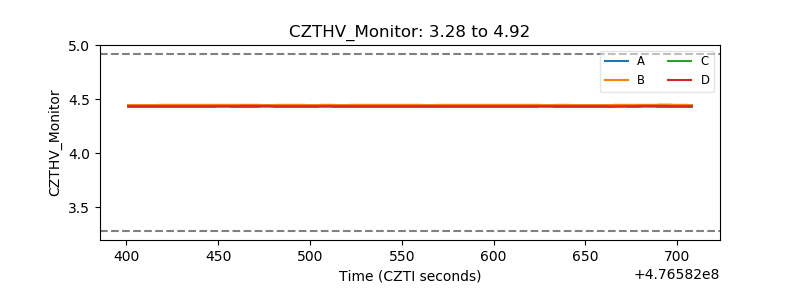 |
| D_VDD | 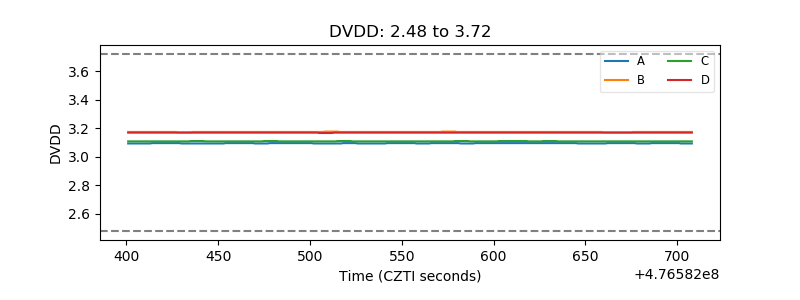 |
| Temperature 1 | 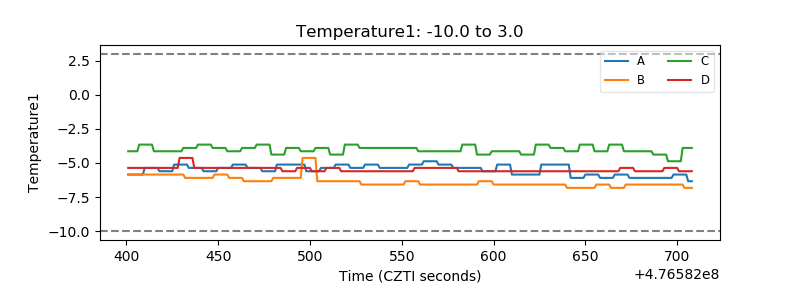 |
| Veto HV Monitor | 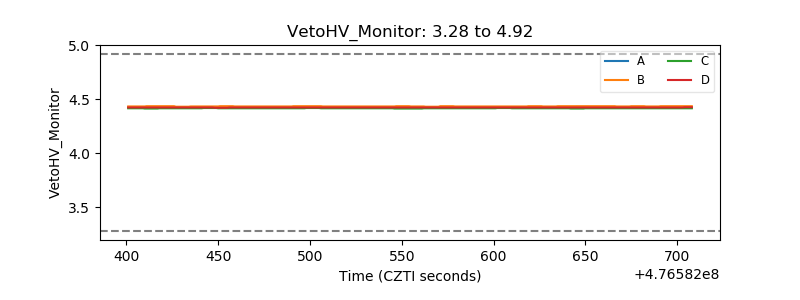 |
| Veto LLD | 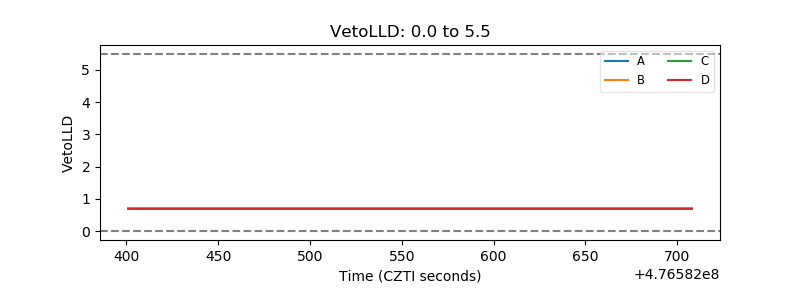 |
| Alpha Counter | 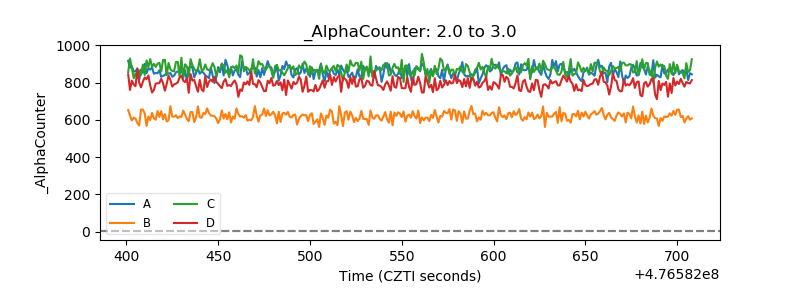 |
| _CPM_Rate | 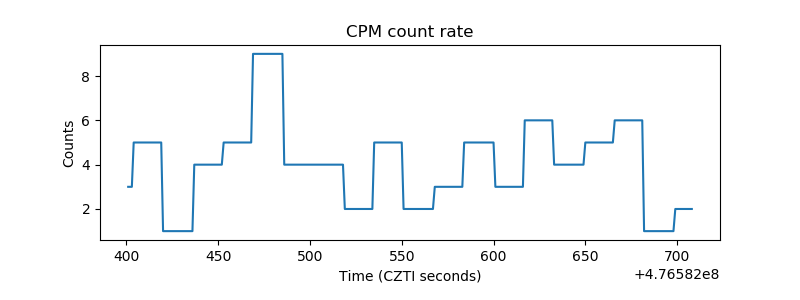 |
| CZT Counter | 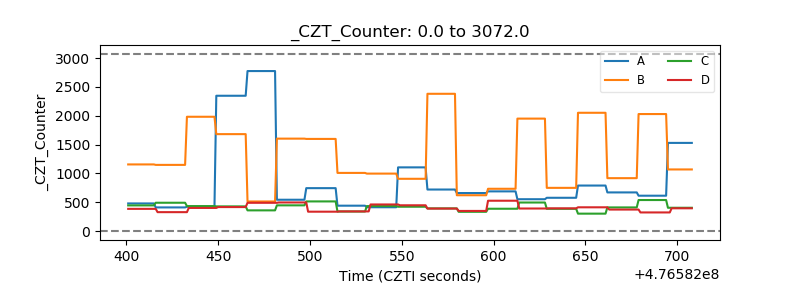 |
| +2.5 Volts monitor | 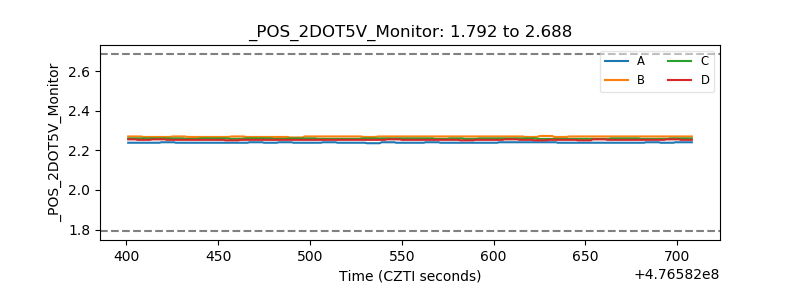 |
| +5 Volts monitor | 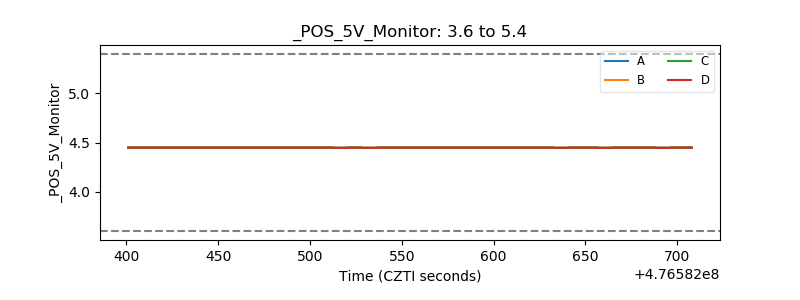 |
| _ROLL_ROT | 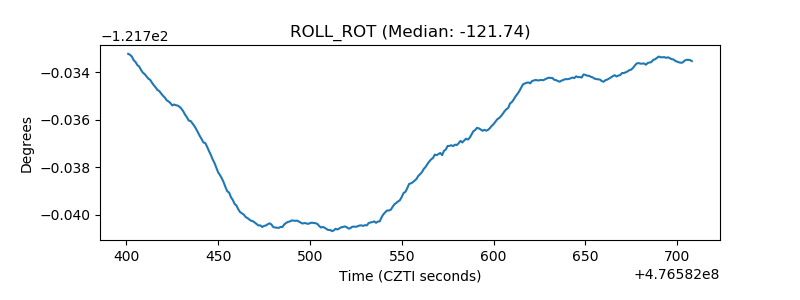 |
| _Roll_DEC | 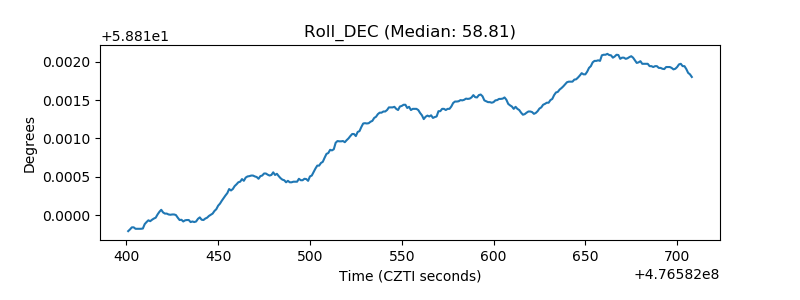 |
| _Roll_RA | 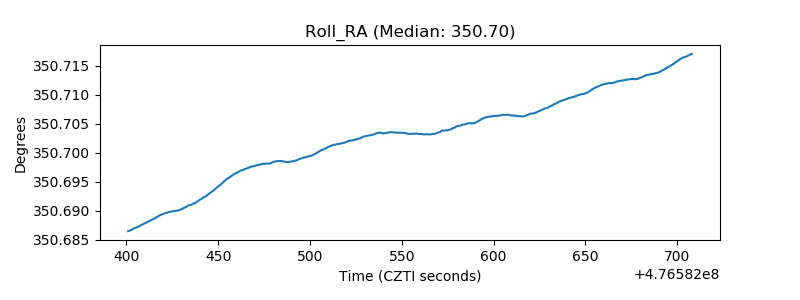 |
| Veto Counter | 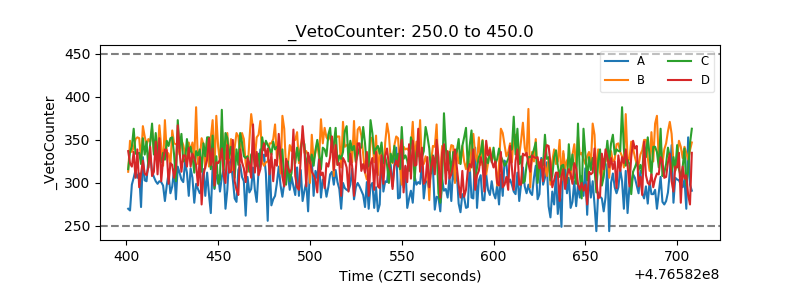 |