| Param | Original file | Final file |
|---|---|---|
| Filename | modeM0/AS1T05_241T01_9000006446_50640cztM0_level2.fits | modeM0/AS1T05_241T01_9000006446_50640cztM0_level2_quad_clean.evt |
| Size (bytes) | 617,483,520 | 65,940,480 |
| Size | 588.9 MB | 62.9 MB |
| Events in quadrant A | 5,843,746 | 421,471 |
| Events in quadrant B | 10,059,264 | 268,053 |
| Events in quadrant C | 3,653,691 | 479,060 |
| Events in quadrant D | 2,886,547 | 454,326 |
| Mode M9 | |||
|---|---|---|---|
| Quadrant | BADHDUFLAG | Total packets | Discarded packets |
| A | 0 | 11 | 0 |
| B | 0 | 11 | 0 |
| C | 0 | 11 | 0 |
| D | 0 | 11 | 0 |
| Mode M0 | |||
|---|---|---|---|
| Quadrant | BADHDUFLAG | Total packets | Discarded packets |
| A | 0 | 20993 | 1 |
| B | 0 | 33556 | 1 |
| C | 0 | 14773 | 1 |
| D | 0 | 12883 | 1 |
| Mode SS | |||
|---|---|---|---|
| Quadrant | BADHDUFLAG | Total packets | Discarded packets |
| A | 0 | 108 | 0 |
| B | 0 | 108 | 0 |
| C | 0 | 108 | 0 |
| D | 0 | 108 | 0 |
| Quadrant | Total seconds | Saturated seconds | Saturation percentage |
|---|---|---|---|
| A | 5335 | 1018 | 19.081537% |
| B | 5335 | 3039 | 56.963449% |
| C | 5335 | 298 | 5.585754% |
| D | 5335 | 159 | 2.980319% |
Noise dominated data is calculated using 1-second bins in cleaned event files. If a bin has >2000 counts, and if more than 50% of those come from <1% of pixels, then it is considered to be noise-dominated and hence unusable.
| Quadrant | # 1 sec bins | Bins with >0 counts | Bins with >2000 counts | High rate bins dominated by noise | Noise dominated (total time) | Noise dominated (detector-on time) | Marked lightcurve |
|---|---|---|---|---|---|---|---|
| A | 6430 | 5336 | 886 | 886 | 13.78% | 16.60% | 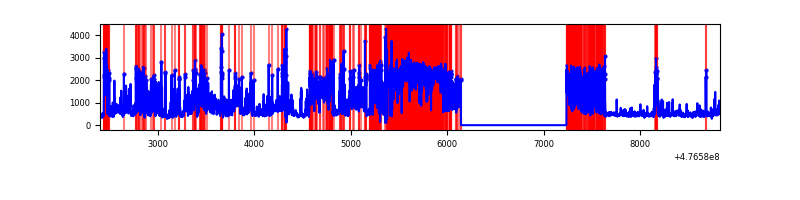 |
| B | 6430 | 5336 | 2548 | 2548 | 39.63% | 47.75% | 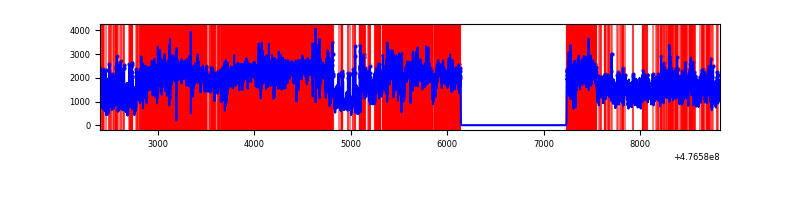 |
| C | 6430 | 5336 | 220 | 220 | 3.42% | 4.12% | 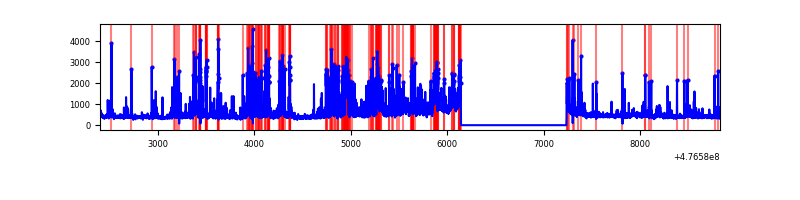 |
| D | 6430 | 5336 | 98 | 98 | 1.52% | 1.84% | 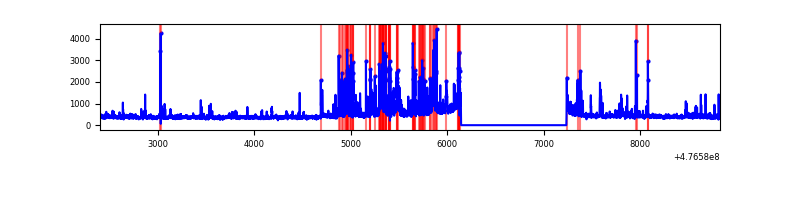 |
Top three noisy pixels from each quadrant. If the there are fewer than three noisy pixels in the level2.evt file, extra rows are filled as -1
| Pixel properties | Quadrant properties | ||||||
|---|---|---|---|---|---|---|---|
| Quadrant | DetID | PixID | Counts | Sigma | Mean | Median | Sigma |
| A | 4 | 4 | 2230153 | 16660.47 | 526 | 511 | 133.8 |
| A | 4 | 249 | 738231 | 5512.44 | 526 | 511 | 133.8 |
| A | 8 | 38 | 194956 | 1452.94 | 526 | 511 | 133.8 |
| B | 4 | 170 | 7570425 | 79424.19 | 443 | 428 | 95.3 |
| B | 5 | 185 | 320203 | 3355.07 | 443 | 428 | 95.3 |
| B | 4 | 206 | 121608 | 1271.42 | 443 | 428 | 95.3 |
| C | 15 | 174 | 709193 | 4844.42 | 533 | 528 | 146.3 |
| C | 13 | 3 | 341482 | 2330.75 | 533 | 528 | 146.3 |
| C | 0 | 176 | 203716 | 1388.99 | 533 | 528 | 146.3 |
| D | 2 | 249 | 169650 | 1128.84 | 534 | 515 | 149.8 |
| D | 7 | 110 | 124135 | 825.07 | 534 | 515 | 149.8 |
| D | 15 | 185 | 101975 | 677.17 | 534 | 515 | 149.8 |
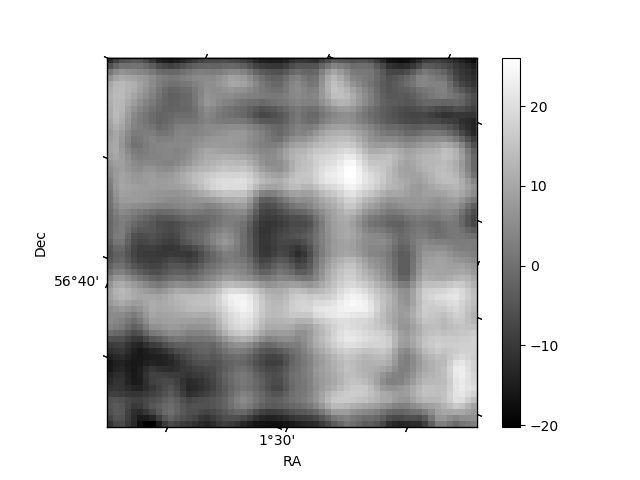
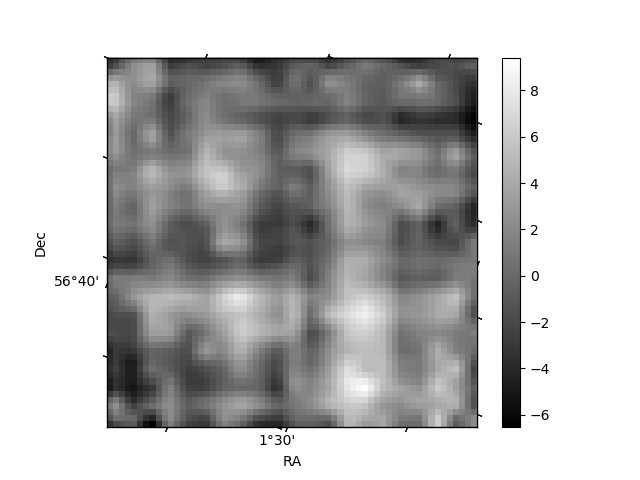
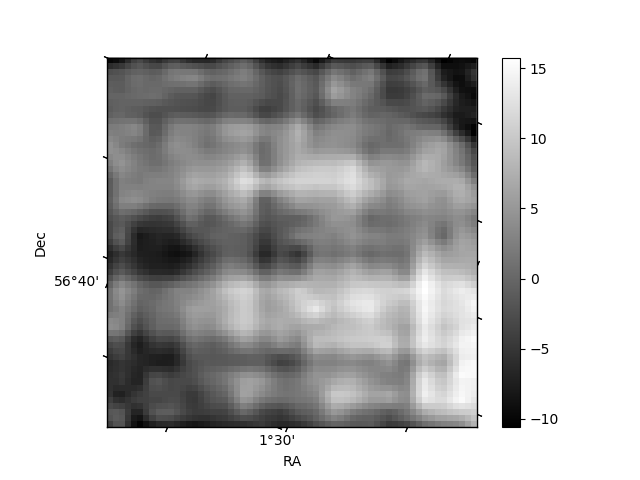
Histogram calculated using DETX and DETY for each event in the final _common_clean file
| Quadrant A | 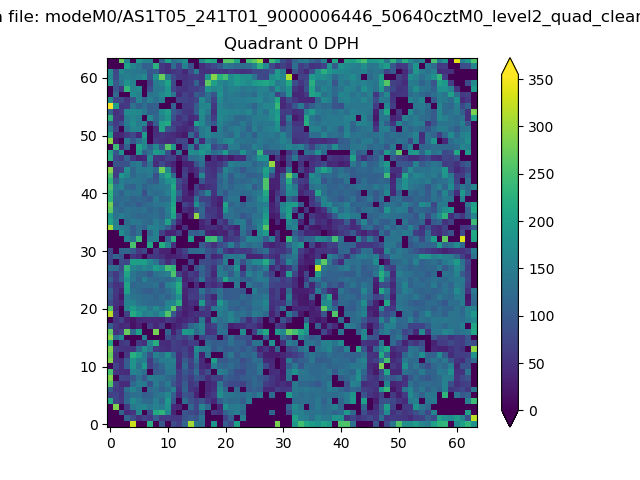 |
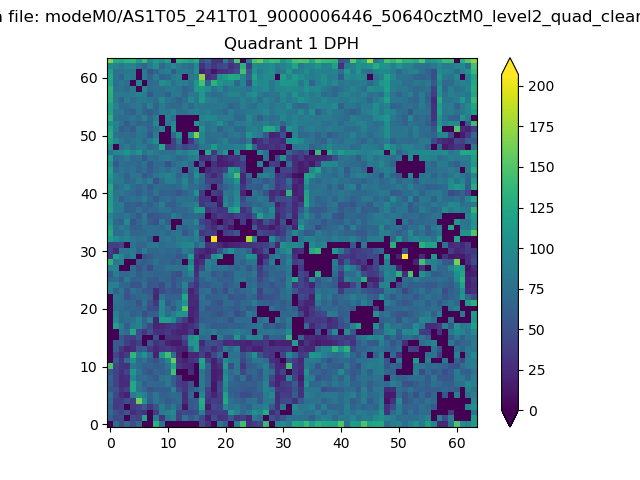 |
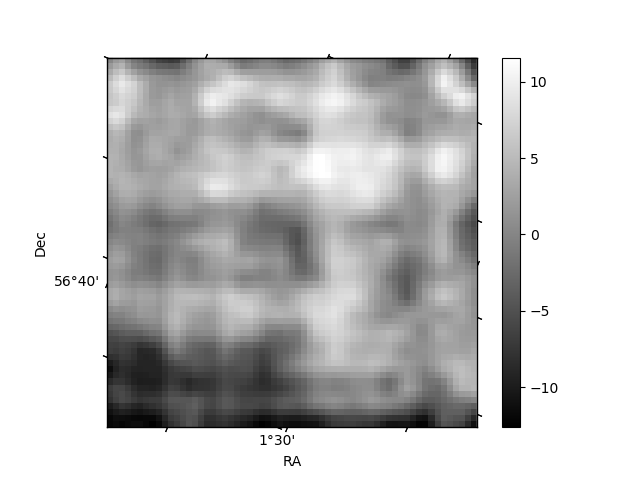
Quadrant B |
|---|---|---|---|
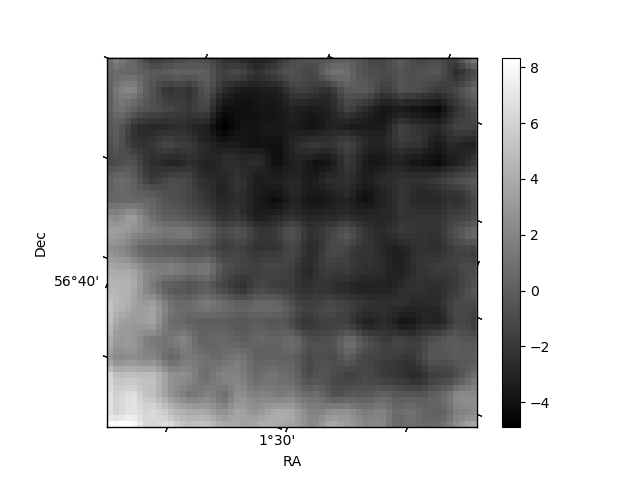
| Quadrant D | 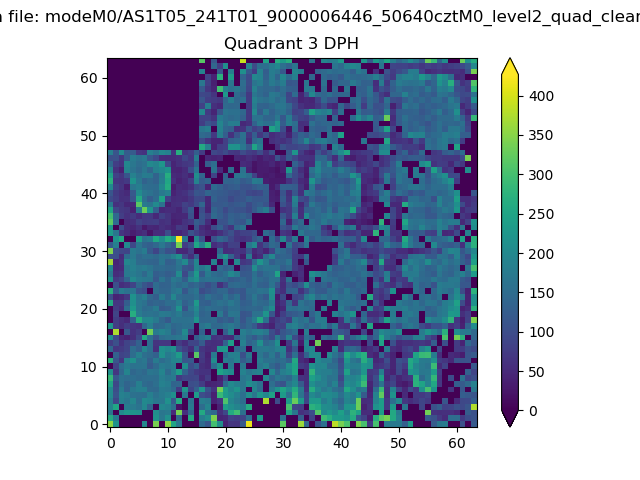 |
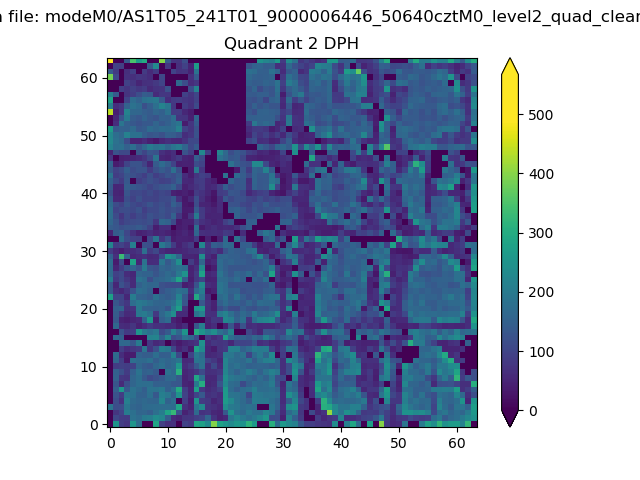 |
Quadrant C |
| Plot type | Count rate plots | Images |
|---|---|---|
| Comparison with Poisson distribution Blue bars denote a histogram of data divided into 1 sec bins. Red curve is a Poisson curve with rate = median count rate of data. |
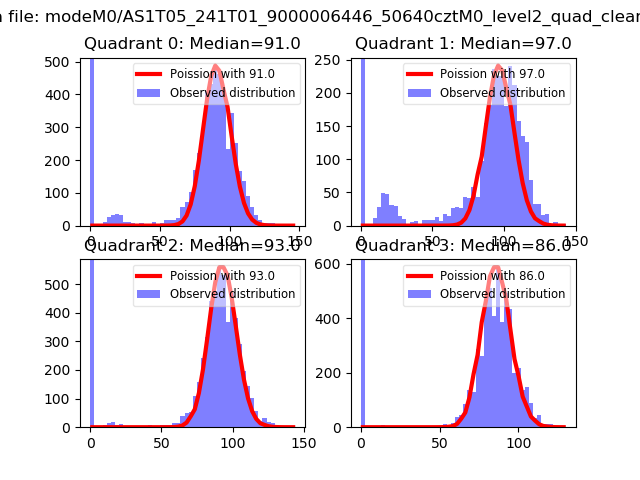 |
 |
| Quadrant-wise count rates Data is divided into 100 sec bins |
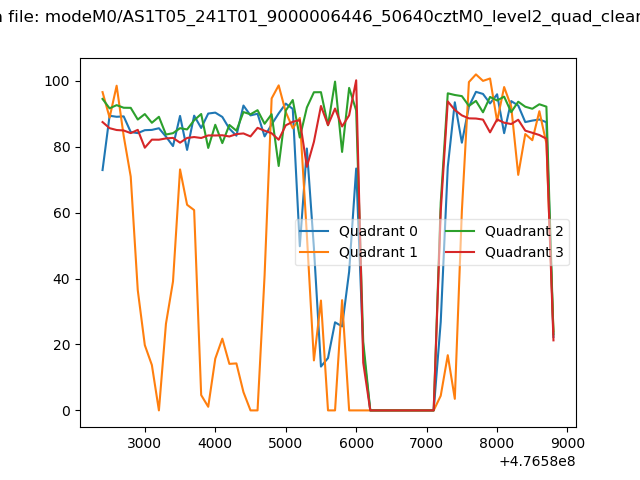 |
|
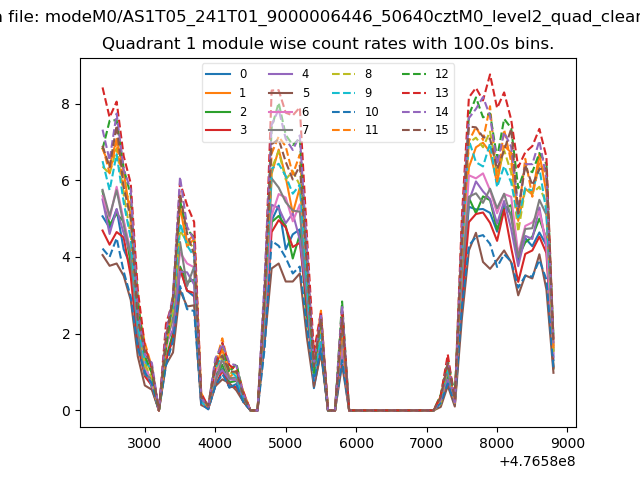
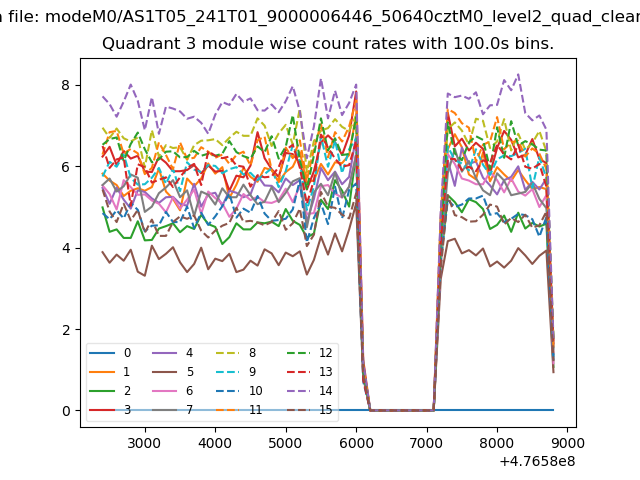
| Module-wise count rates for Quadrant A Data is divided into 100 sec bins |
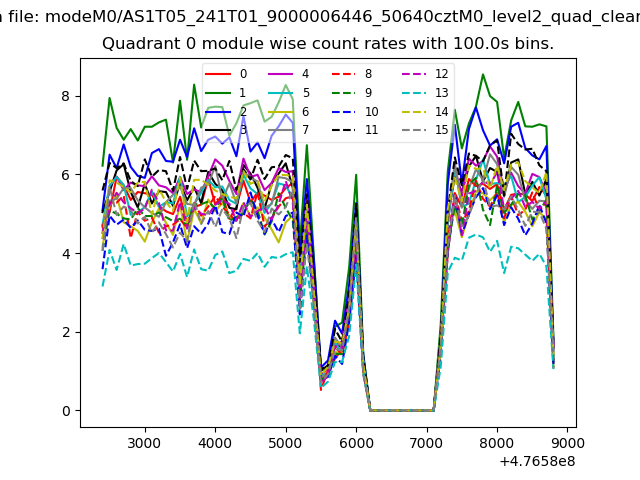 |
 |
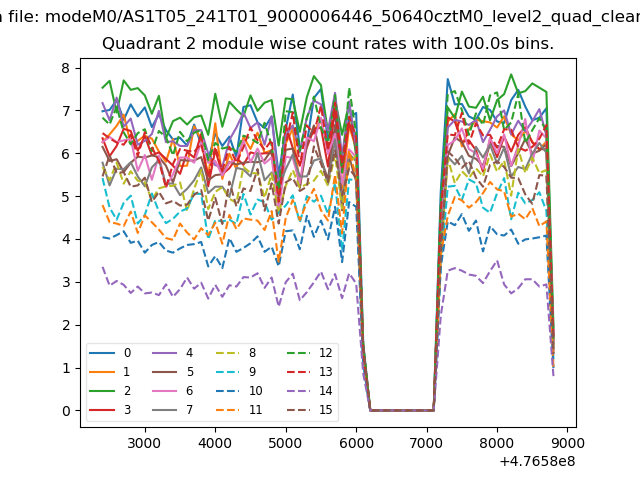
| Module-wise count rates for Quadrant B Data is divided into 100 sec bins |
 |
 |
| Module-wise count rates for Quadrant C Data is divided into 100 sec bins |
 |
 |
| Module-wise count rates for Quadrant D Data is divided into 100 sec bins |
 |
 |
| Parameter | Plot |
|---|---|
| CZT HV Monitor | 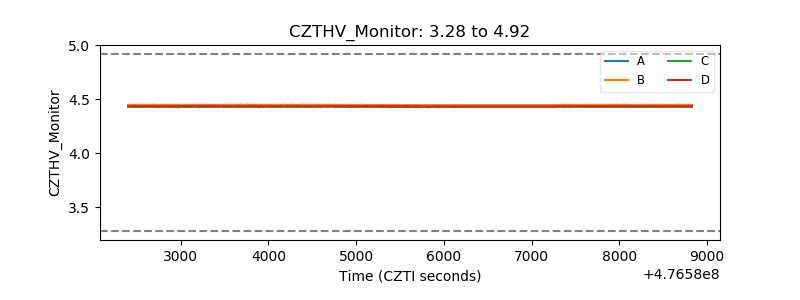 |
| D_VDD | 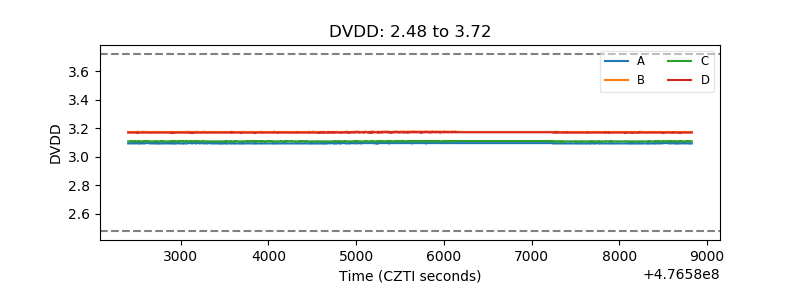 |
| Temperature 1 | 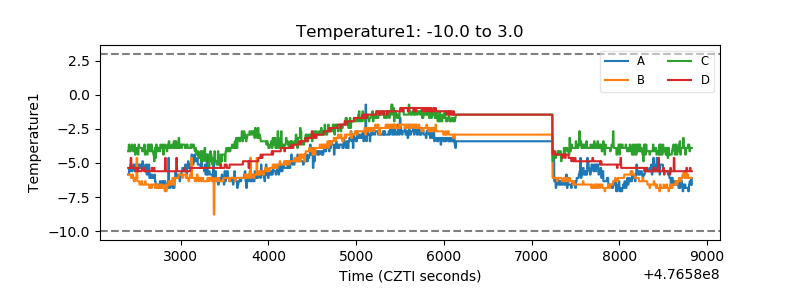 |
| Veto HV Monitor | 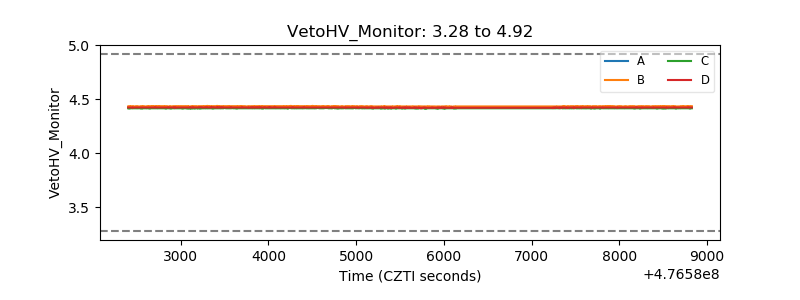 |
| Veto LLD | 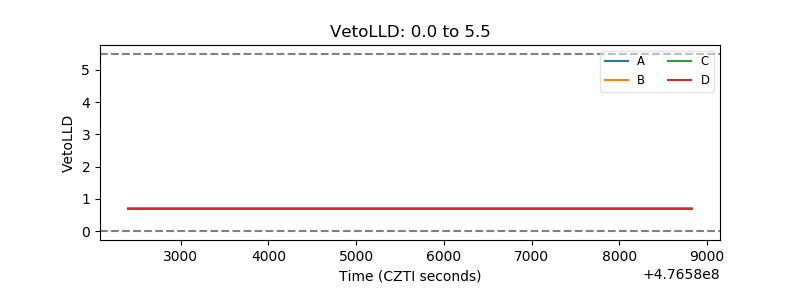 |
| Alpha Counter | 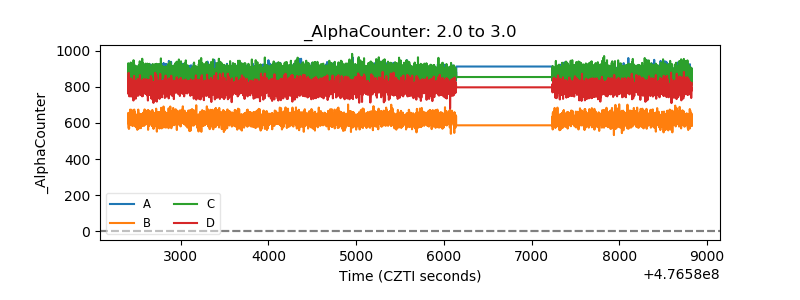 |
| _CPM_Rate | 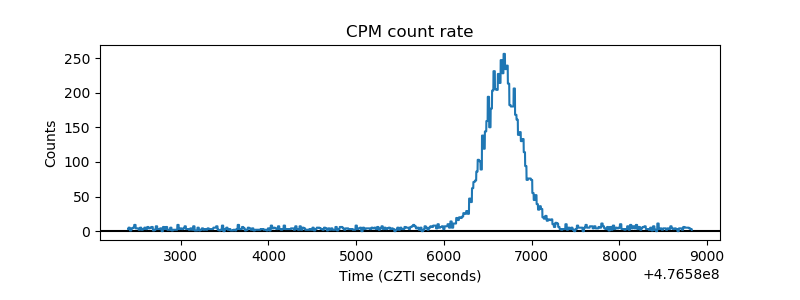 |
| CZT Counter | 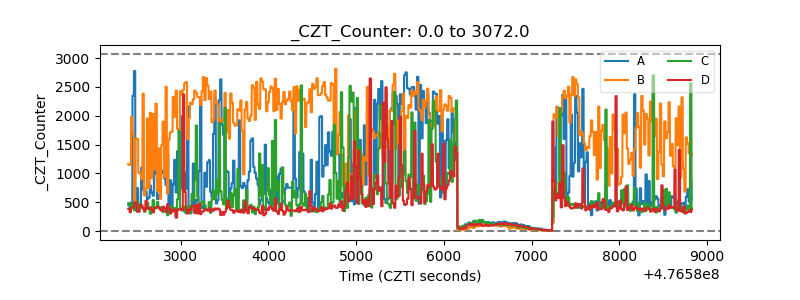 |
| +2.5 Volts monitor | 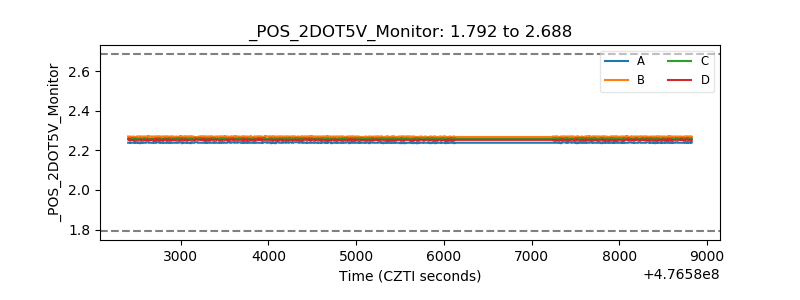 |
| +5 Volts monitor | 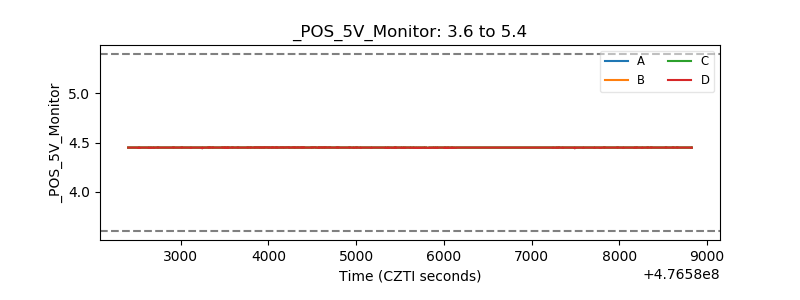 |
| _ROLL_ROT | 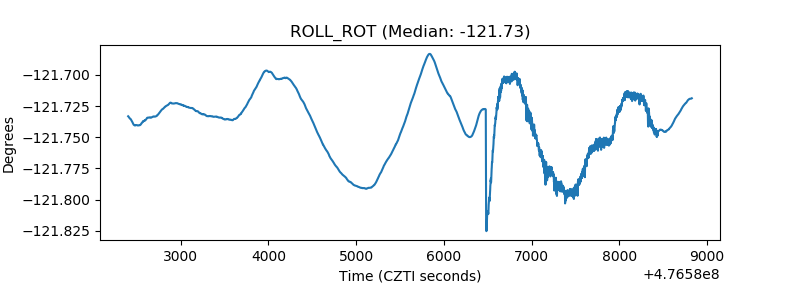 |
| _Roll_DEC | 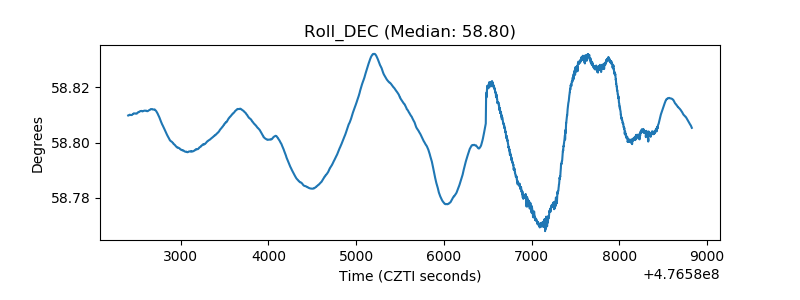 |
| _Roll_RA | 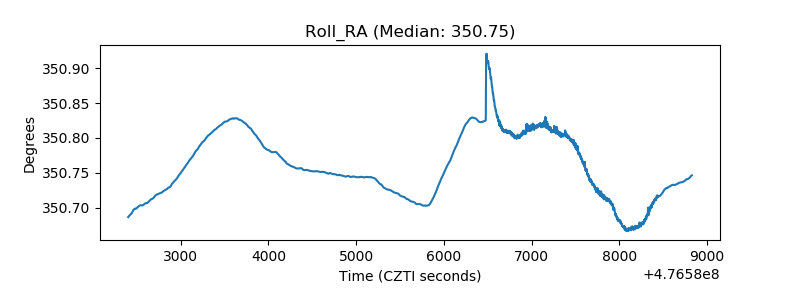 |
| Veto Counter | 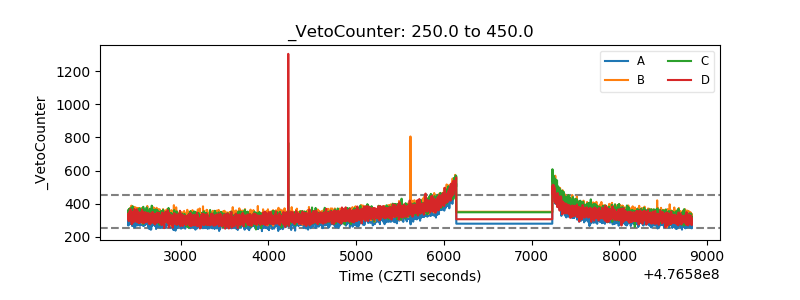 |