| Param | Original file | Final file |
|---|---|---|
| Filename | modeM0/AS1T05_241T01_9000006446_50641cztM0_level2.fits | modeM0/AS1T05_241T01_9000006446_50641cztM0_level2_quad_clean.evt |
| Size (bytes) | 762,284,160 | 89,899,200 |
| Size | 727.0 MB | 85.7 MB |
| Events in quadrant A | 5,272,189 | 623,969 |
| Events in quadrant B | 12,737,025 | 402,968 |
| Events in quadrant C | 5,179,598 | 618,040 |
| Events in quadrant D | 4,479,295 | 583,050 |
| Mode M9 | |||
|---|---|---|---|
| Quadrant | BADHDUFLAG | Total packets | Discarded packets |
| A | 0 | 18 | 0 |
| B | 0 | 18 | 0 |
| C | 0 | 18 | 0 |
| D | 0 | 18 | 0 |
| Mode M0 | |||
|---|---|---|---|
| Quadrant | BADHDUFLAG | Total packets | Discarded packets |
| A | 0 | 20388 | 2 |
| B | 0 | 42752 | 2 |
| C | 0 | 20404 | 2 |
| D | 0 | 18826 | 2 |
| Mode SS | |||
|---|---|---|---|
| Quadrant | BADHDUFLAG | Total packets | Discarded packets |
| A | 0 | 146 | 0 |
| B | 0 | 146 | 0 |
| C | 0 | 146 | 0 |
| D | 0 | 146 | 0 |
| Quadrant | Total seconds | Saturated seconds | Saturation percentage |
|---|---|---|---|
| A | 7090 | 493 | 6.953456% |
| B | 7090 | 3456 | 48.744711% |
| C | 7090 | 470 | 6.629055% |
| D | 7091 | 396 | 5.584544% |
Noise dominated data is calculated using 1-second bins in cleaned event files. If a bin has >2000 counts, and if more than 50% of those come from <1% of pixels, then it is considered to be noise-dominated and hence unusable.
| Quadrant | # 1 sec bins | Bins with >0 counts | Bins with >2000 counts | High rate bins dominated by noise | Noise dominated (total time) | Noise dominated (detector-on time) | Marked lightcurve |
|---|---|---|---|---|---|---|---|
| A | 8915 | 7092 | 291 | 291 | 3.26% | 4.10% | 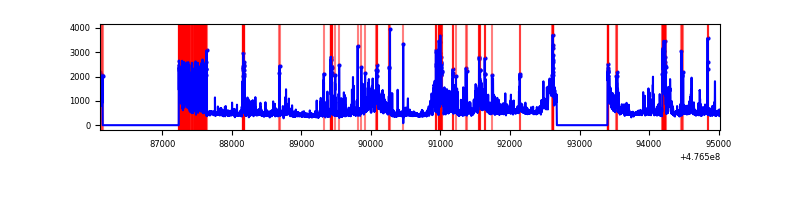 |
| B | 8915 | 7092 | 2719 | 2719 | 30.50% | 38.34% | 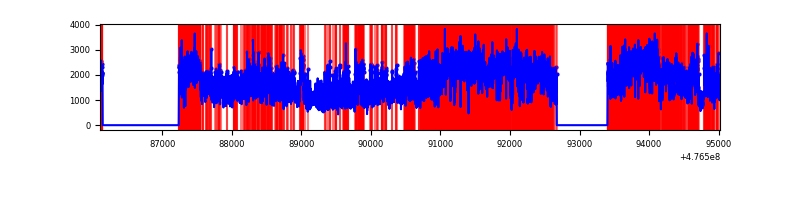 |
| C | 8915 | 7092 | 323 | 323 | 3.62% | 4.55% | 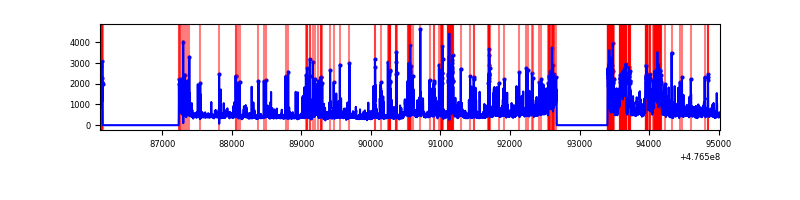 |
| D | 8916 | 7093 | 306 | 306 | 3.43% | 4.31% | 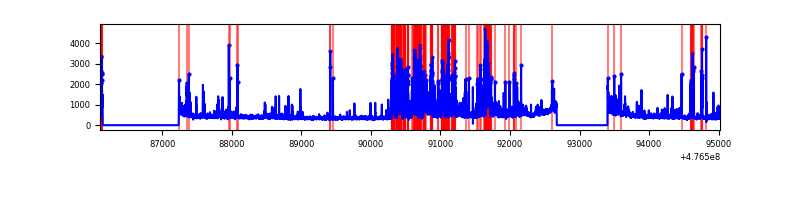 |
Top three noisy pixels from each quadrant. If the there are fewer than three noisy pixels in the level2.evt file, extra rows are filled as -1
| Pixel properties | Quadrant properties | ||||||
|---|---|---|---|---|---|---|---|
| Quadrant | DetID | PixID | Counts | Sigma | Mean | Median | Sigma |
| A | 4 | 4 | 664864 | 3622.06 | 734 | 714 | 183.4 |
| A | 12 | 80 | 556202 | 3029.45 | 734 | 714 | 183.4 |
| A | 8 | 38 | 166731 | 905.4 | 734 | 714 | 183.4 |
| B | 4 | 170 | 9326944 | 74350.43 | 596 | 577 | 125.4 |
| B | 4 | 206 | 301649 | 2400.17 | 596 | 577 | 125.4 |
| B | 5 | 185 | 228447 | 1816.6 | 596 | 577 | 125.4 |
| C | 13 | 3 | 590682 | 2988.77 | 718 | 714 | 197.4 |
| C | 10 | 171 | 436065 | 2205.48 | 718 | 714 | 197.4 |
| C | 0 | 176 | 393591 | 1990.31 | 718 | 714 | 197.4 |
| D | 15 | 185 | 555929 | 2775.94 | 714 | 688 | 200.0 |
| D | 7 | 110 | 217295 | 1082.93 | 714 | 688 | 200.0 |
| D | 2 | 249 | 185209 | 922.52 | 714 | 688 | 200.0 |
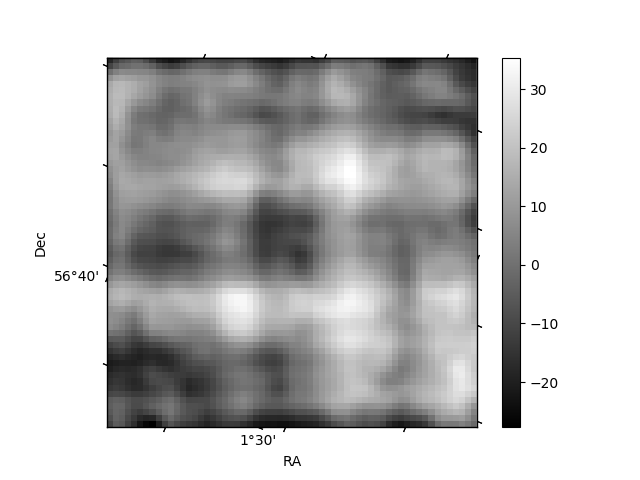
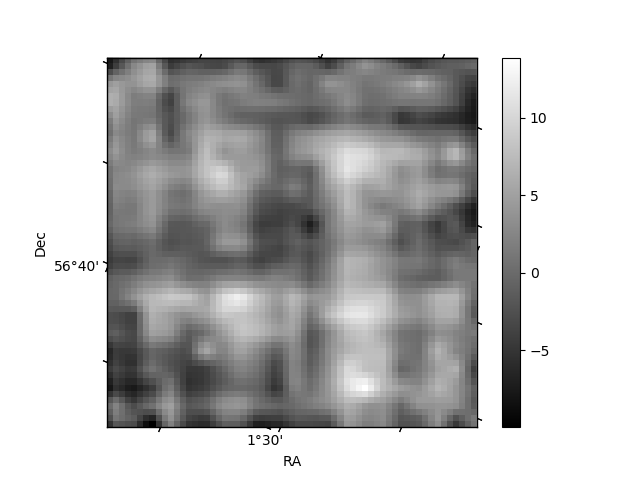
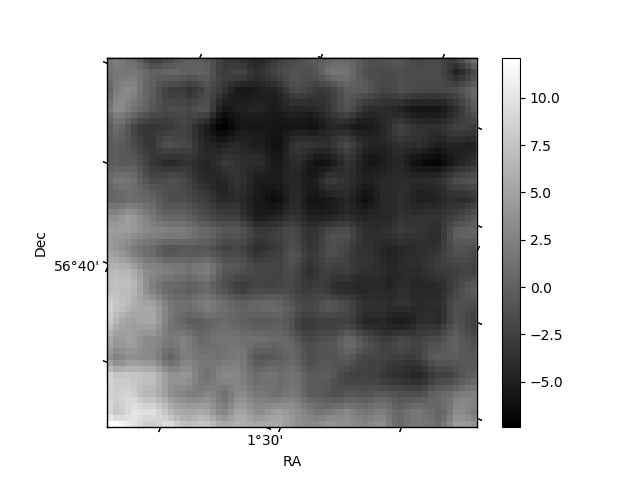
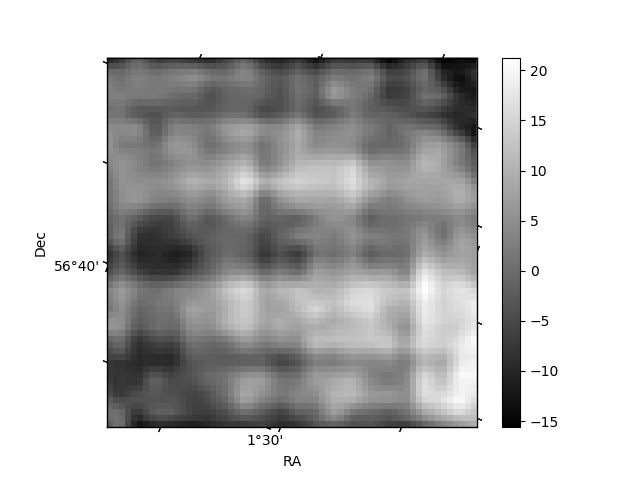
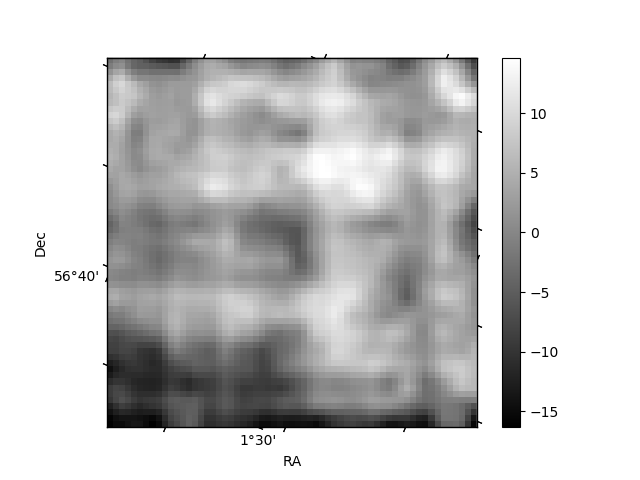
Histogram calculated using DETX and DETY for each event in the final _common_clean file
| Quadrant A | 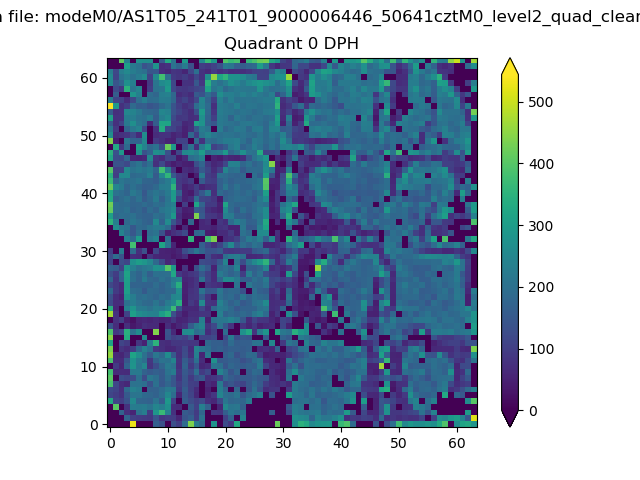 |
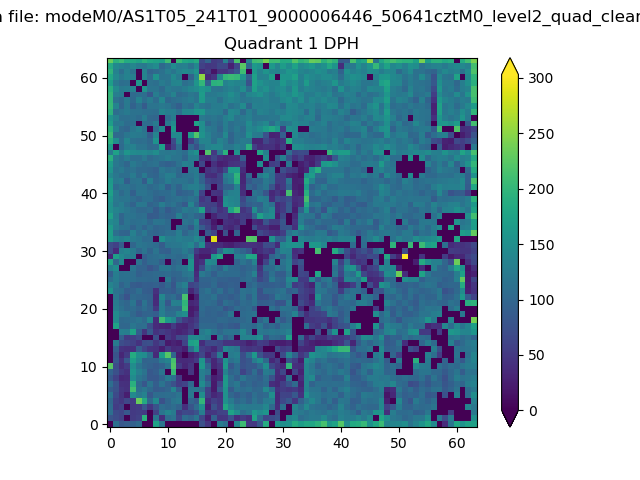 |
Quadrant B |
|---|---|---|---|
| Quadrant D | 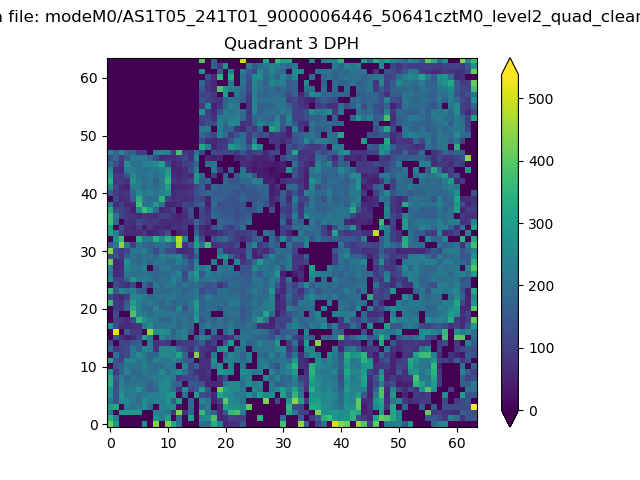 |
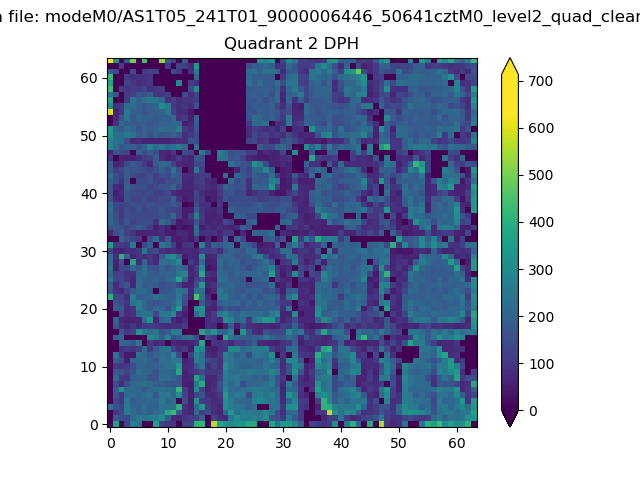 |
Quadrant C |
| Plot type | Count rate plots | Images |
|---|---|---|
| Comparison with Poisson distribution Blue bars denote a histogram of data divided into 1 sec bins. Red curve is a Poisson curve with rate = median count rate of data. |
 |
 |
| Quadrant-wise count rates Data is divided into 100 sec bins |
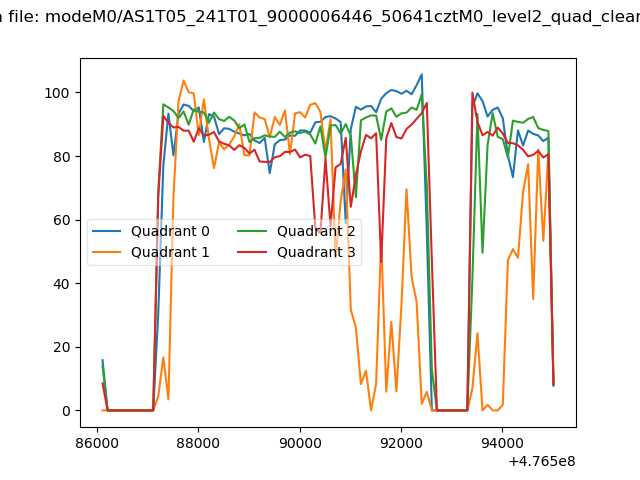 |
|
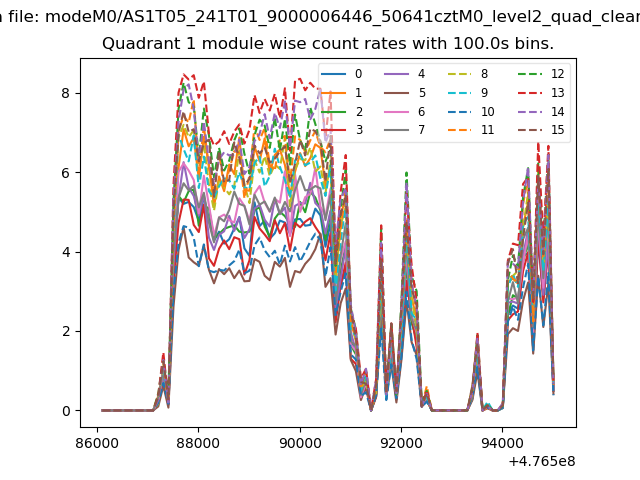
| Module-wise count rates for Quadrant A Data is divided into 100 sec bins |
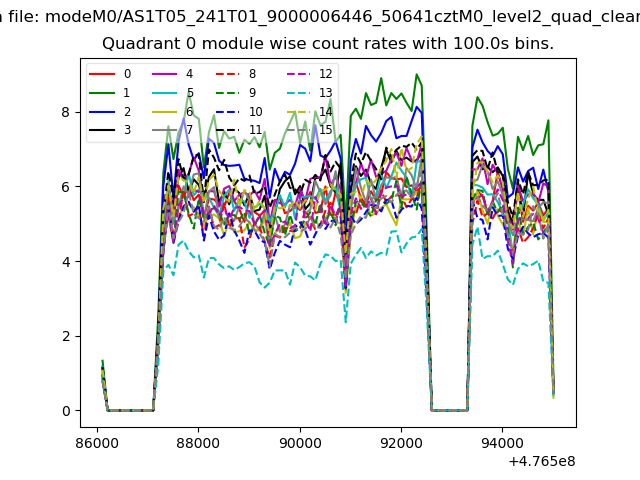 |
 |
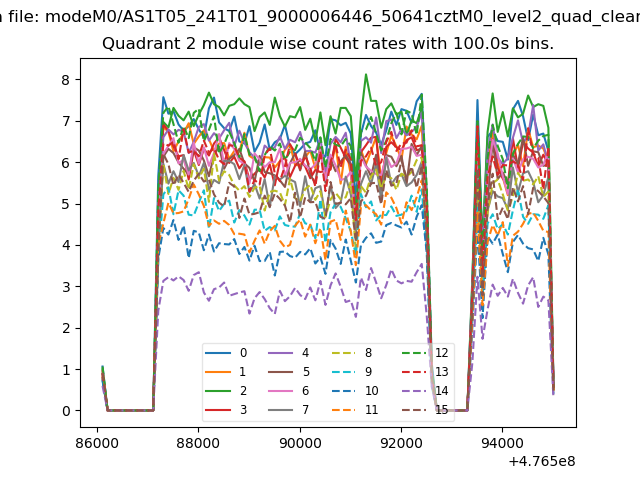
| Module-wise count rates for Quadrant B Data is divided into 100 sec bins |
 |
 |
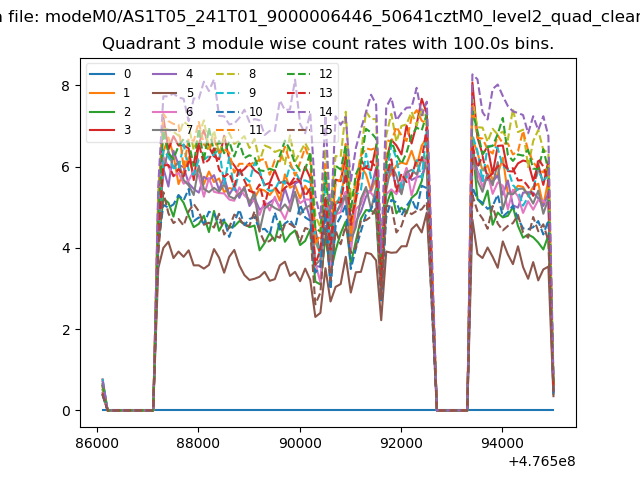
| Module-wise count rates for Quadrant C Data is divided into 100 sec bins |
 |
 |
| Module-wise count rates for Quadrant D Data is divided into 100 sec bins |
 |
 |
| Parameter | Plot |
|---|---|
| CZT HV Monitor | 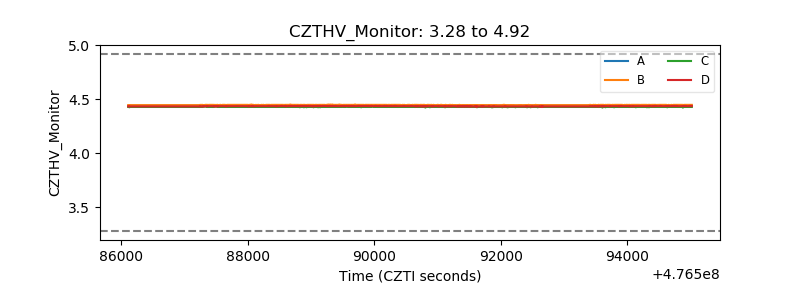 |
| D_VDD | 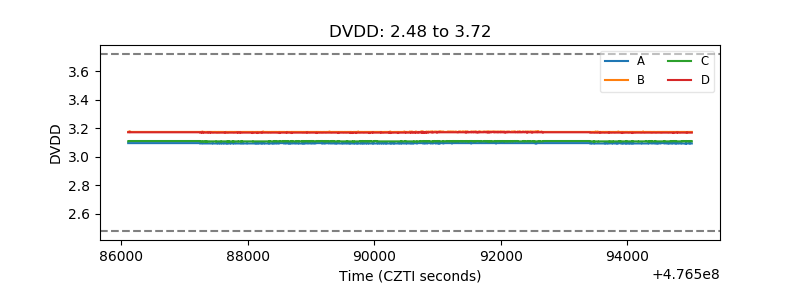 |
| Temperature 1 | 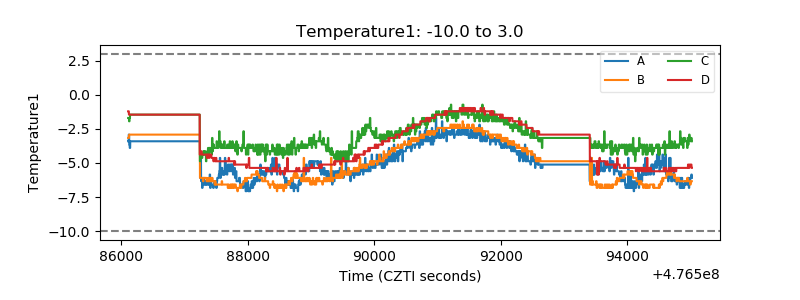 |
| Veto HV Monitor | 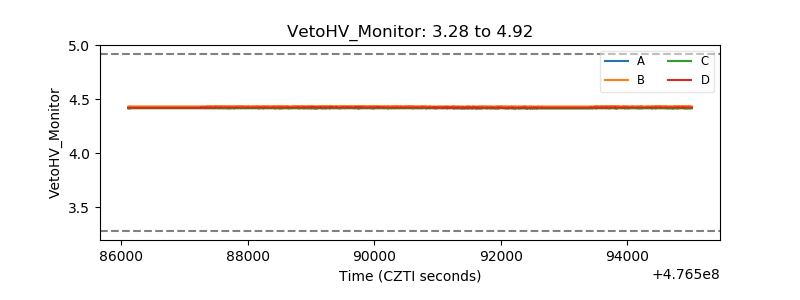 |
| Veto LLD | 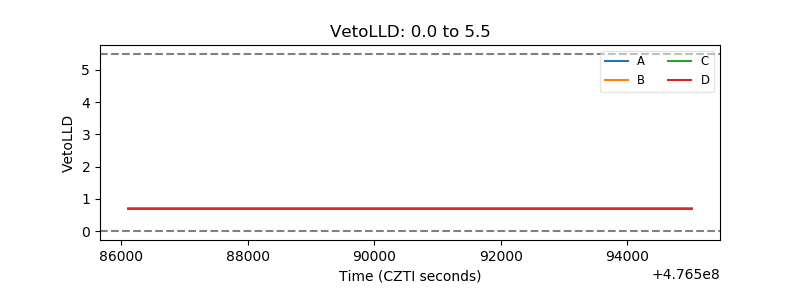 |
| Alpha Counter | 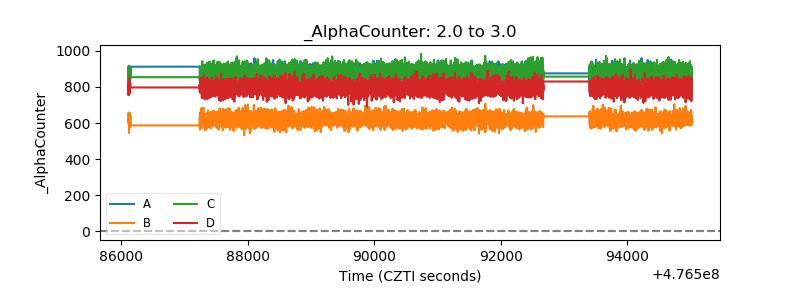 |
| _CPM_Rate | 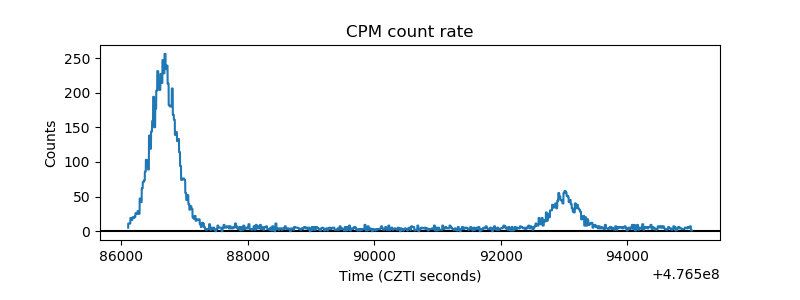 |
| CZT Counter | 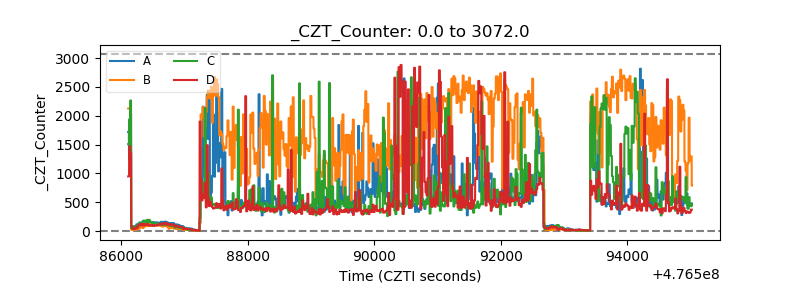 |
| +2.5 Volts monitor | 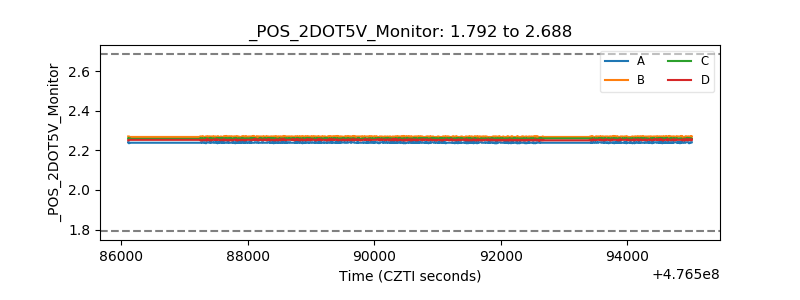 |
| +5 Volts monitor |  |
| _ROLL_ROT | 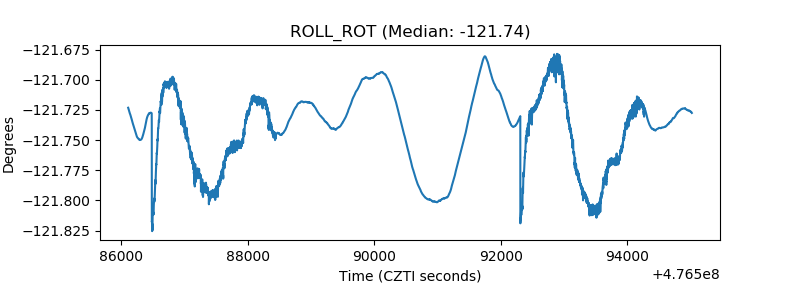 |
| _Roll_DEC | 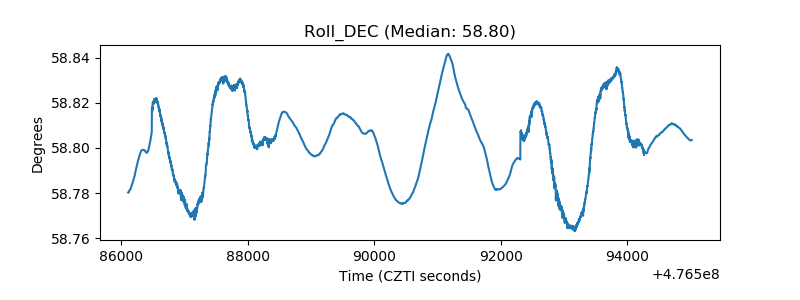 |
| _Roll_RA | 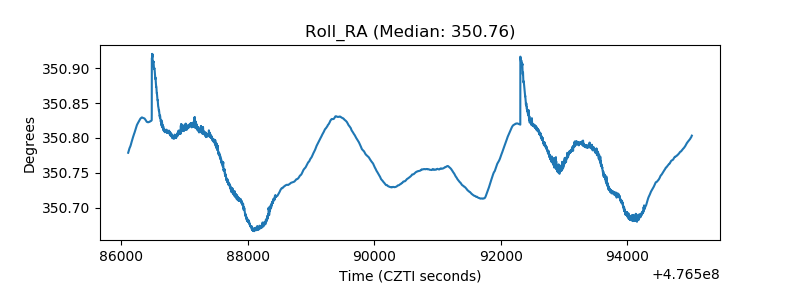 |
| Veto Counter | 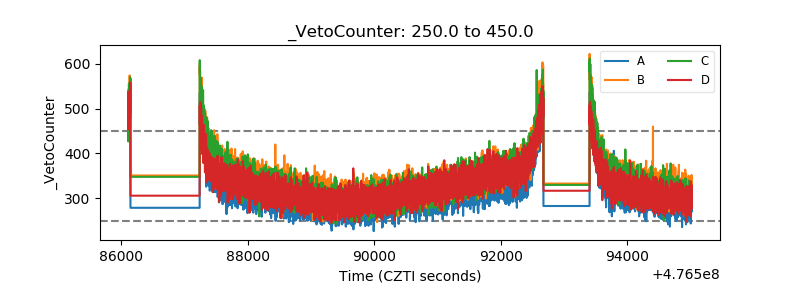 |