| Param | Original file | Final file |
|---|---|---|
| Filename | modeM0/AS1T05_241T01_9000006446_50642cztM0_level2.fits | modeM0/AS1T05_241T01_9000006446_50642cztM0_level2_quad_clean.evt |
| Size (bytes) | 235,065,600 | 29,911,680 |
| Size | 224.2 MB | 28.5 MB |
| Events in quadrant A | 1,619,708 | 202,748 |
| Events in quadrant B | 3,304,501 | 144,156 |
| Events in quadrant C | 2,385,315 | 193,012 |
| Events in quadrant D | 1,211,723 | 200,518 |
| Mode M9 | |||
|---|---|---|---|
| Quadrant | BADHDUFLAG | Total packets | Discarded packets |
| A | 0 | 18 | 15 |
| B | 0 | 25 | 22 |
| C | 0 | 9 | 6 |
| D | 0 | 21 | 18 |
| Mode M0 | |||
|---|---|---|---|
| Quadrant | BADHDUFLAG | Total packets | Discarded packets |
| A | 0 | 12987 | 6631 |
| B | 0 | 24814 | 13416 |
| C | 0 | 14591 | 5911 |
| D | 0 | 13159 | 7840 |
| Mode SS | |||
|---|---|---|---|
| Quadrant | BADHDUFLAG | Total packets | Discarded packets |
| A | 0 | 89 | 43 |
| B | 0 | 93 | 47 |
| C | 0 | 111 | 65 |
| D | 0 | 109 | 61 |
| Quadrant | Total seconds | Saturated seconds | Saturation percentage |
|---|---|---|---|
| A | 2301 | 143 | 6.214689% |
| B | 2275 | 903 | 39.692308% |
| C | 2288 | 289 | 12.631119% |
| D | 2301 | 15 | 0.651890% |
Noise dominated data is calculated using 1-second bins in cleaned event files. If a bin has >2000 counts, and if more than 50% of those come from <1% of pixels, then it is considered to be noise-dominated and hence unusable.
| Quadrant | # 1 sec bins | Bins with >0 counts | Bins with >2000 counts | High rate bins dominated by noise | Noise dominated (total time) | Noise dominated (detector-on time) | Marked lightcurve |
|---|---|---|---|---|---|---|---|
| A | 7797 | 2326 | 65 | 65 | 0.83% | 2.79% | 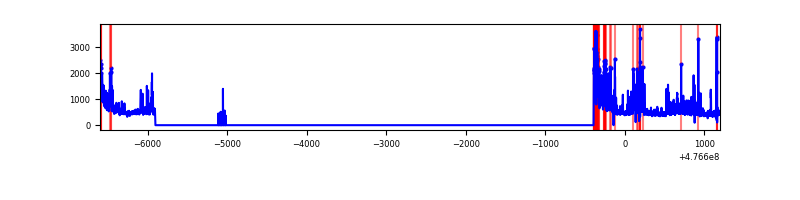 |
| B | 7797 | 2295 | 592 | 592 | 7.59% | 25.80% | 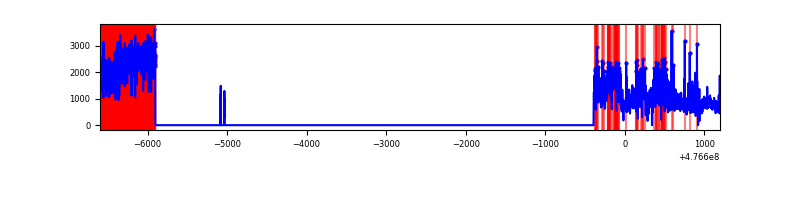 |
| C | 7797 | 2323 | 235 | 235 | 3.01% | 10.12% | 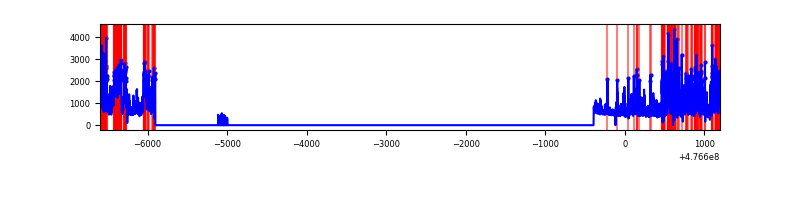 |
| D | 7797 | 2324 | 4 | 4 | 0.05% | 0.17% | 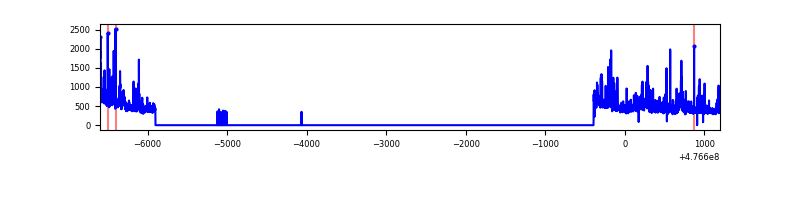 |
Top three noisy pixels from each quadrant. If the there are fewer than three noisy pixels in the level2.evt file, extra rows are filled as -1
| Pixel properties | Quadrant properties | ||||||
|---|---|---|---|---|---|---|---|
| Quadrant | DetID | PixID | Counts | Sigma | Mean | Median | Sigma |
| A | 12 | 250 | 228633 | 3790.94 | 241 | 235 | 60.2 |
| A | 4 | 4 | 101493 | 1680.68 | 241 | 235 | 60.2 |
| A | 12 | 80 | 65751 | 1087.43 | 241 | 235 | 60.2 |
| B | 4 | 170 | 2084950 | 45989.94 | 204 | 198 | 45.3 |
| B | 5 | 185 | 123776 | 2726.15 | 204 | 198 | 45.3 |
| B | 5 | 172 | 78700 | 1731.77 | 204 | 198 | 45.3 |
| C | 15 | 174 | 576371 | 8705.08 | 235 | 233 | 66.2 |
| C | 10 | 171 | 269025 | 4061.28 | 235 | 233 | 66.2 |
| C | 13 | 3 | 237020 | 3577.7 | 235 | 233 | 66.2 |
| D | 6 | 42 | 40100 | 582.78 | 240 | 231 | 68.4 |
| D | 5 | 32 | 30368 | 440.52 | 240 | 231 | 68.4 |
| D | 15 | 169 | 25791 | 373.62 | 240 | 231 | 68.4 |
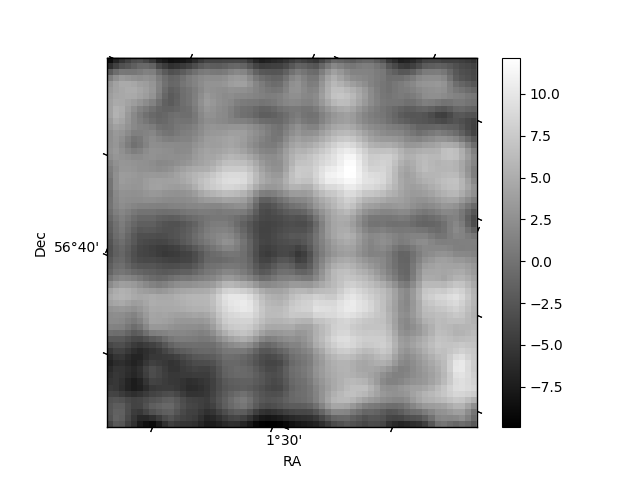
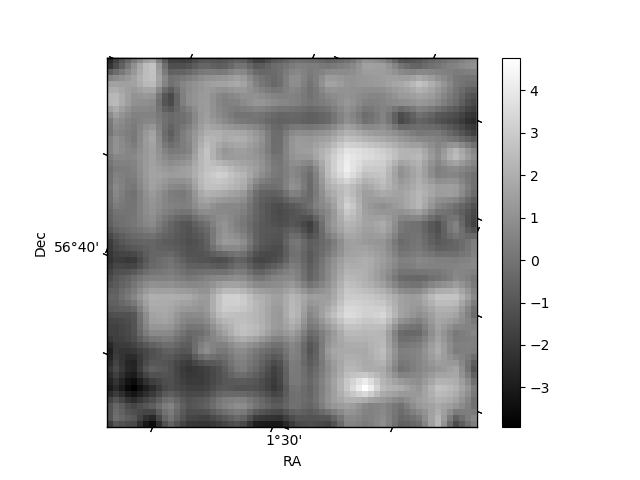
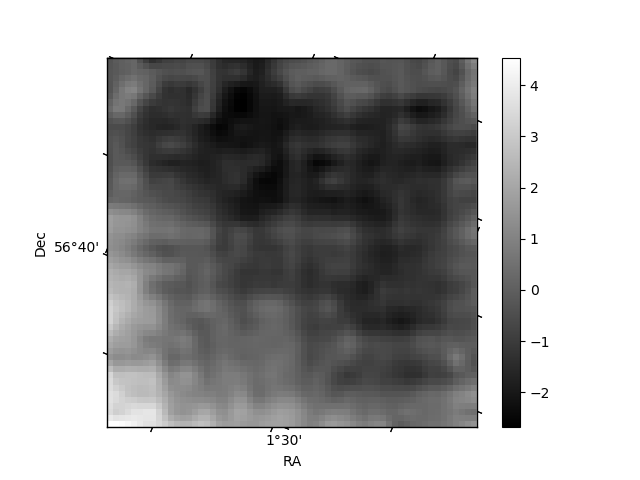
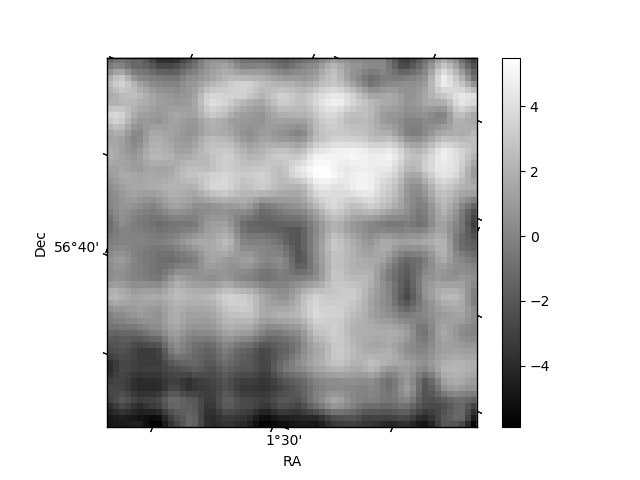
Histogram calculated using DETX and DETY for each event in the final _common_clean file
| Quadrant A | 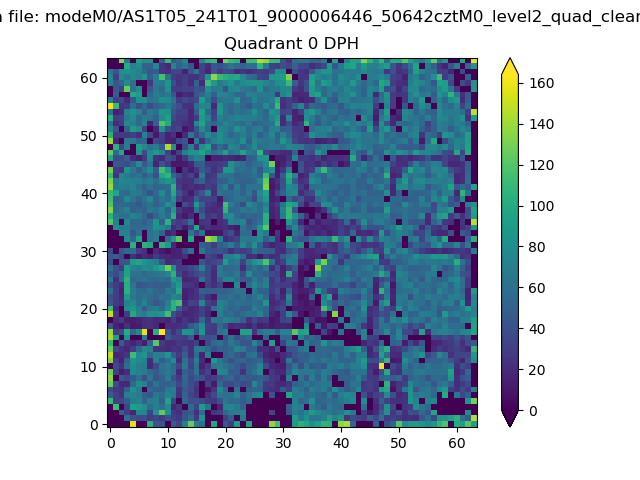 |
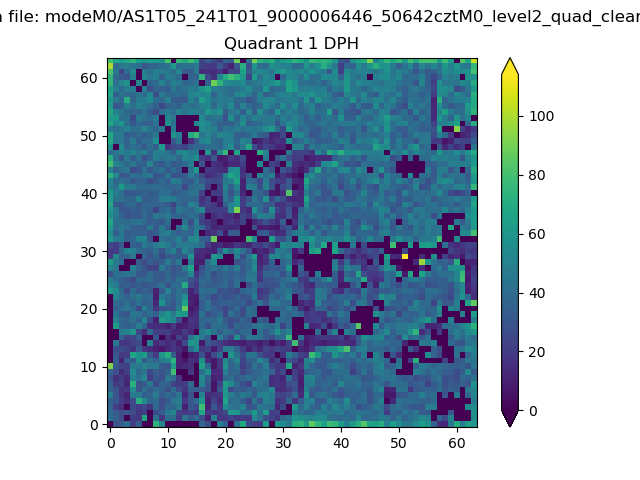 |
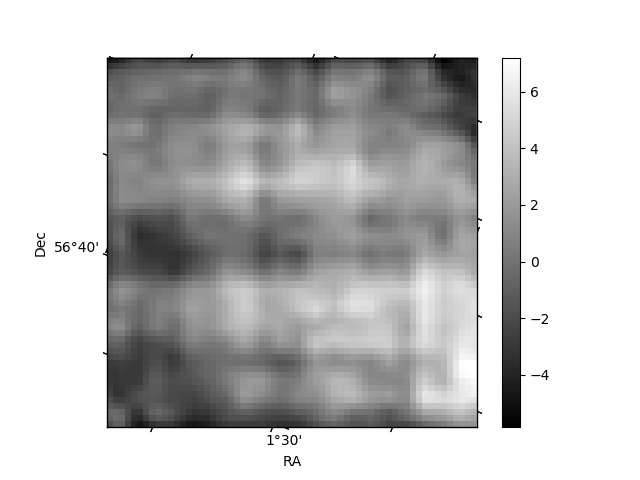
Quadrant B |
|---|---|---|---|
| Quadrant D | 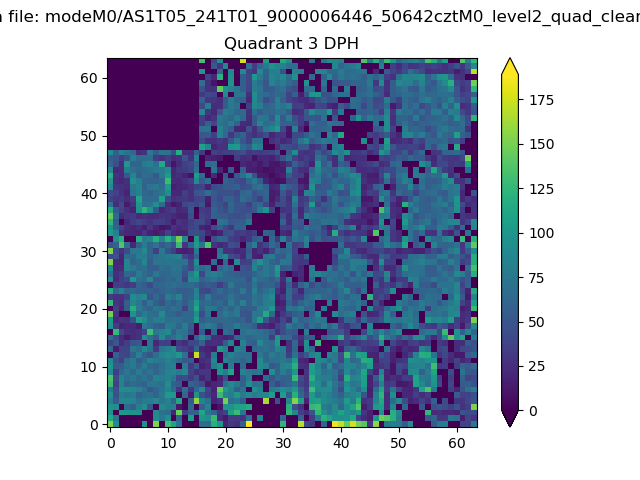 |
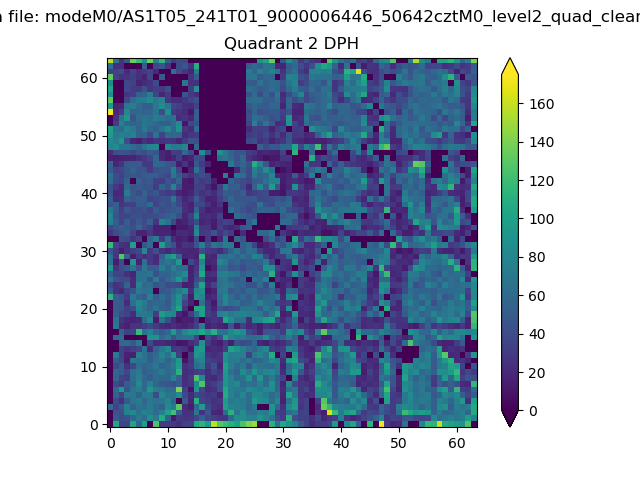 |
Quadrant C |
| Plot type | Count rate plots | Images |
|---|---|---|
| Comparison with Poisson distribution Blue bars denote a histogram of data divided into 1 sec bins. Red curve is a Poisson curve with rate = median count rate of data. |
 |
 |
| Quadrant-wise count rates Data is divided into 100 sec bins |
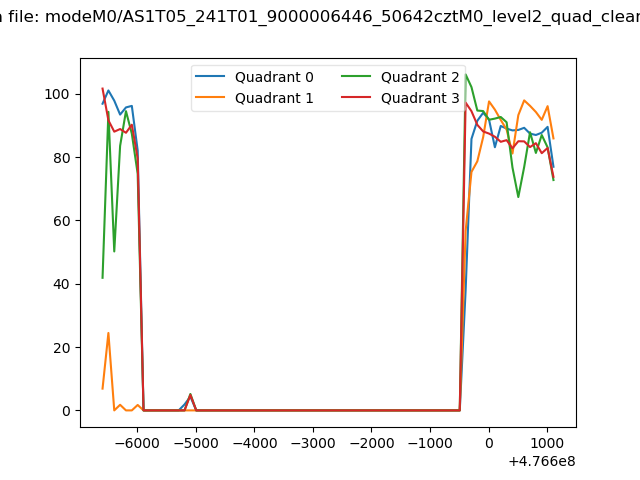 |
|
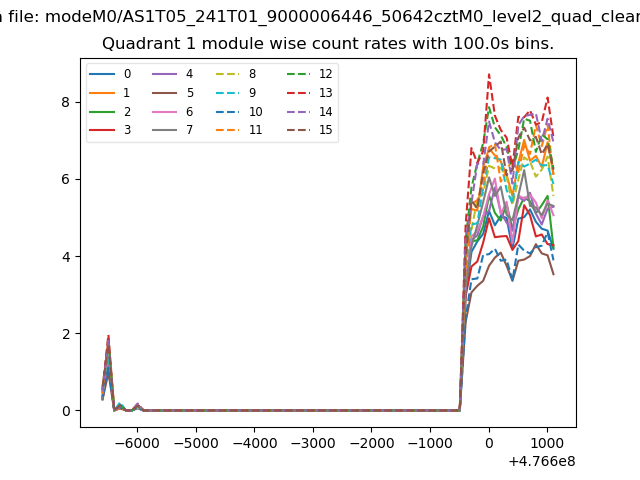
| Module-wise count rates for Quadrant A Data is divided into 100 sec bins |
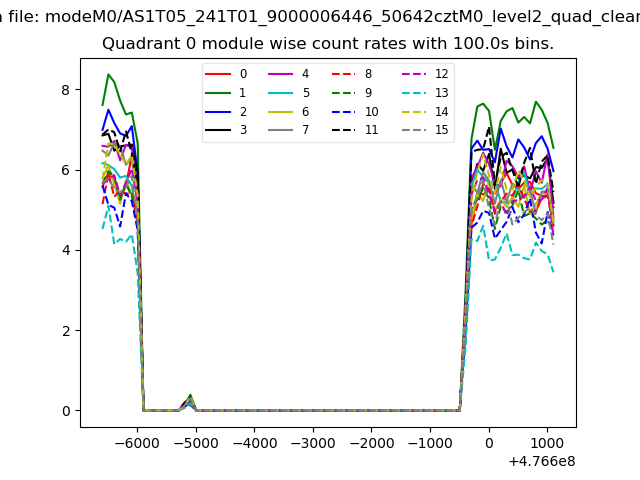 |
 |
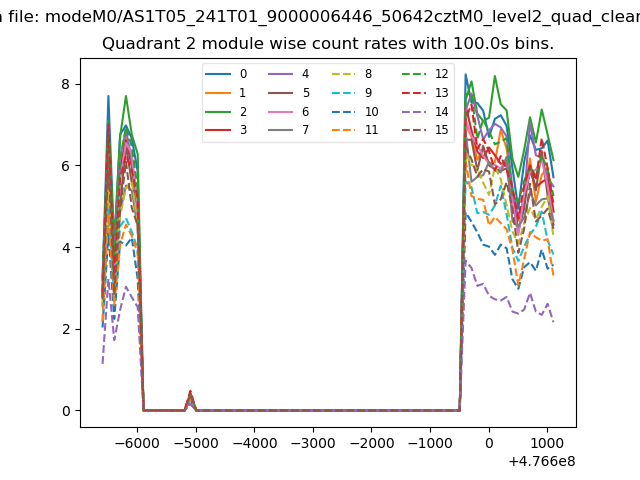
| Module-wise count rates for Quadrant B Data is divided into 100 sec bins |
 |
 |
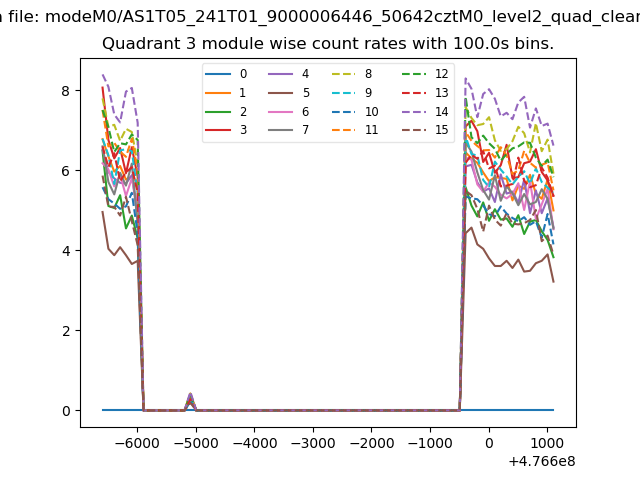
| Module-wise count rates for Quadrant C Data is divided into 100 sec bins |
 |
 |
| Module-wise count rates for Quadrant D Data is divided into 100 sec bins |
 |
 |
| Parameter | Plot |
|---|---|
| CZT HV Monitor |  |
| D_VDD | 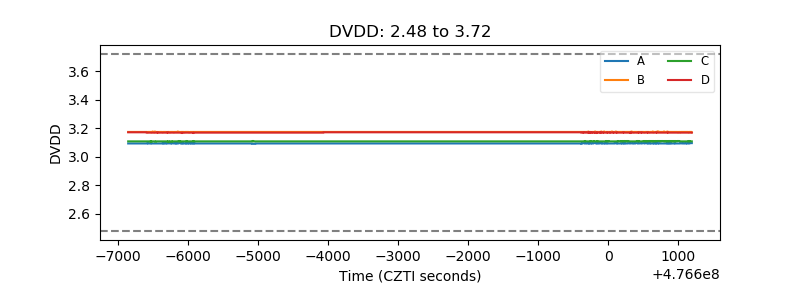 |
| Temperature 1 | 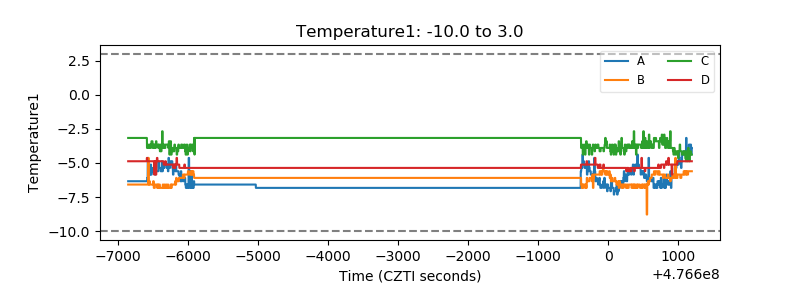 |
| Veto HV Monitor | 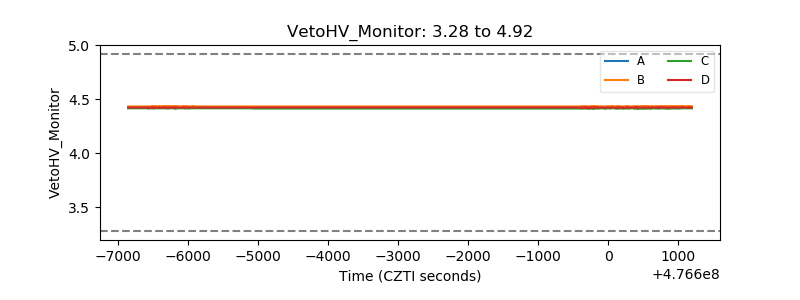 |
| Veto LLD | 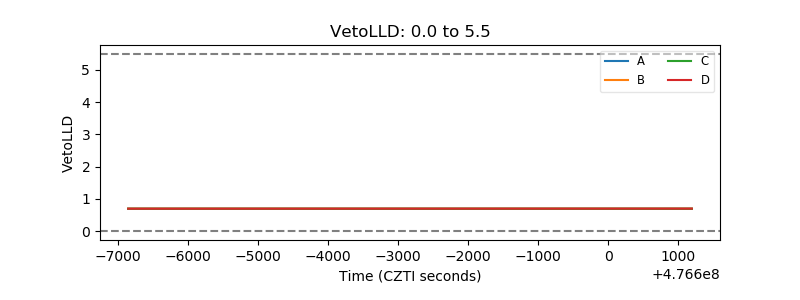 |
| Alpha Counter | 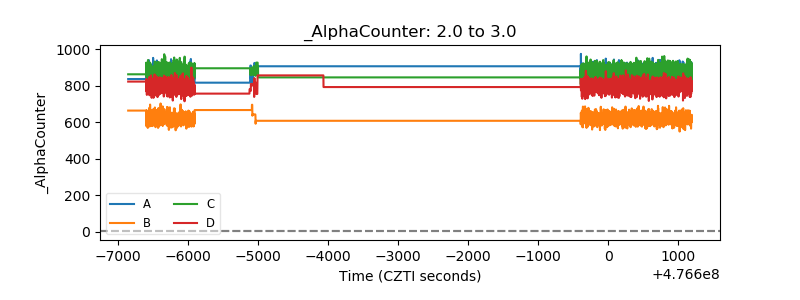 |
| _CPM_Rate | 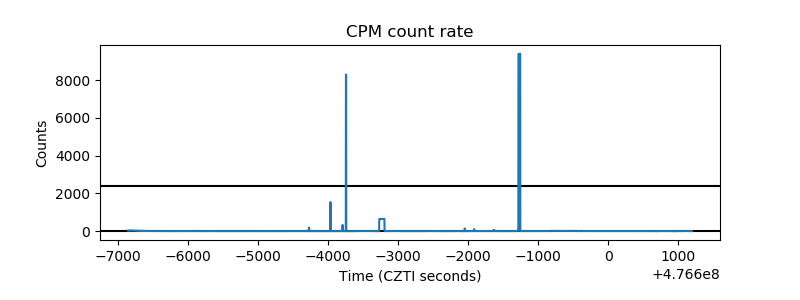 |
| CZT Counter | 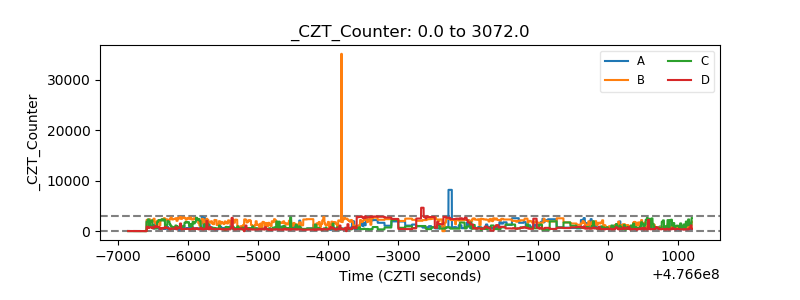 |
| +2.5 Volts monitor | 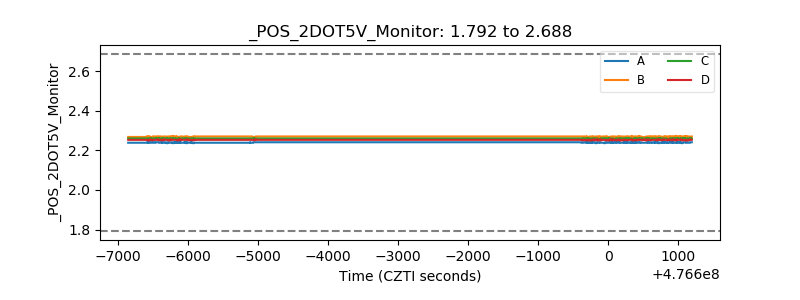 |
| +5 Volts monitor |  |
| _ROLL_ROT |  |
| _Roll_DEC | 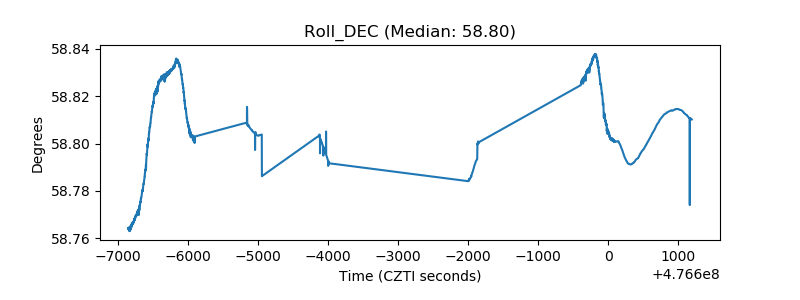 |
| _Roll_RA | 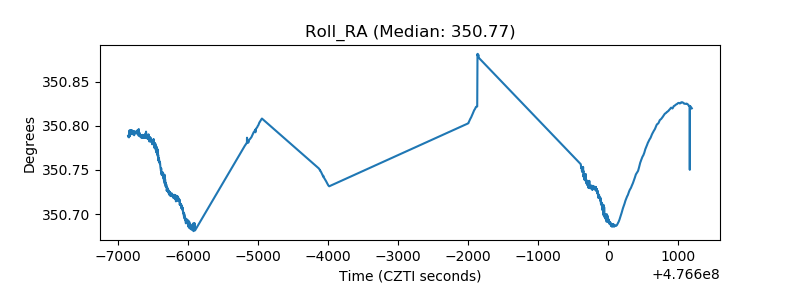 |
| Veto Counter | 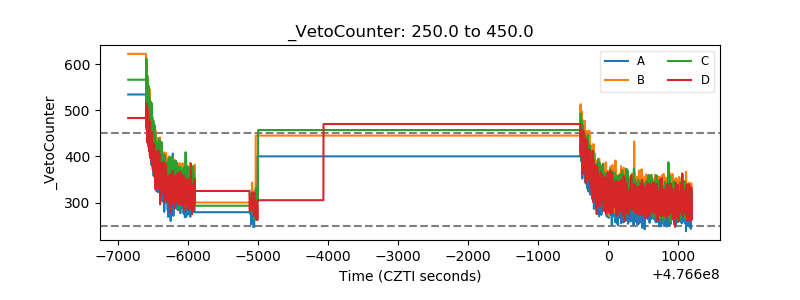 |