| Param | Original file | Final file |
|---|---|---|
| Filename | modeM0/AS1T05_241T01_9000006446_50643cztM0_level2.fits | modeM0/AS1T05_241T01_9000006446_50643cztM0_level2_quad_clean.evt |
| Size (bytes) | 874,474,560 | 96,203,520 |
| Size | 834.0 MB | 91.7 MB |
| Events in quadrant A | 5,092,562 | 679,934 |
| Events in quadrant B | 11,571,083 | 528,959 |
| Events in quadrant C | 8,724,283 | 603,795 |
| Events in quadrant D | 6,402,432 | 577,090 |
| Mode M0 | |||
|---|---|---|---|
| Quadrant | BADHDUFLAG | Total packets | Discarded packets |
| A | 0 | 20174 | 0 |
| B | 0 | 39610 | 0 |
| C | 0 | 31224 | 0 |
| D | 0 | 24424 | 0 |
| Mode SS | |||
|---|---|---|---|
| Quadrant | BADHDUFLAG | Total packets | Discarded packets |
| A | 0 | 150 | 0 |
| B | 0 | 150 | 0 |
| C | 0 | 150 | 0 |
| D | 0 | 150 | 0 |
| Quadrant | Total seconds | Saturated seconds | Saturation percentage |
|---|---|---|---|
| A | 7510 | 137 | 1.824234% |
| B | 7511 | 2754 | 36.666223% |
| C | 7511 | 1112 | 14.804953% |
| D | 7511 | 711 | 9.466116% |
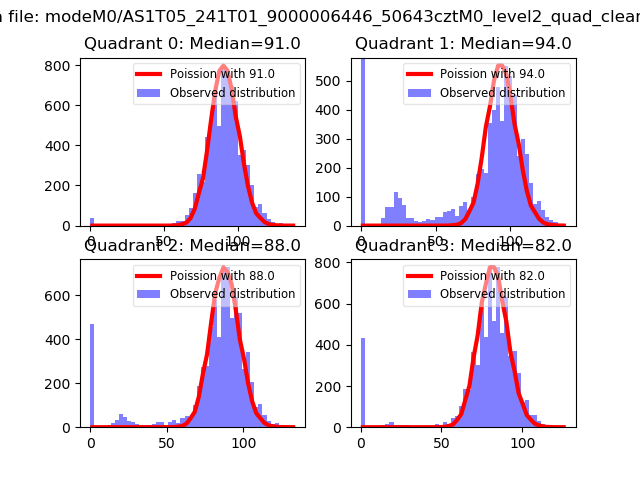
Noise dominated data is calculated using 1-second bins in cleaned event files. If a bin has >2000 counts, and if more than 50% of those come from <1% of pixels, then it is considered to be noise-dominated and hence unusable.
| Quadrant | # 1 sec bins | Bins with >0 counts | Bins with >2000 counts | High rate bins dominated by noise | Noise dominated (total time) | Noise dominated (detector-on time) | Marked lightcurve |
|---|---|---|---|---|---|---|---|
| A | 7510 | 7510 | 91 | 91 | 1.21% | 1.21% | 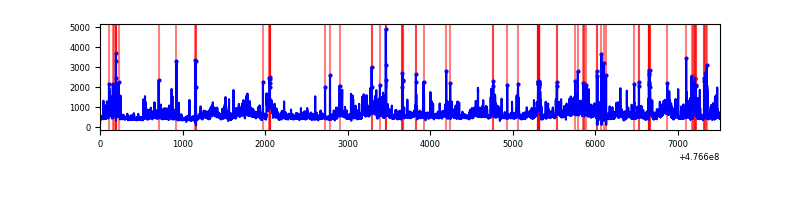 |
| B | 7511 | 7511 | 2098 | 2098 | 27.93% | 27.93% | 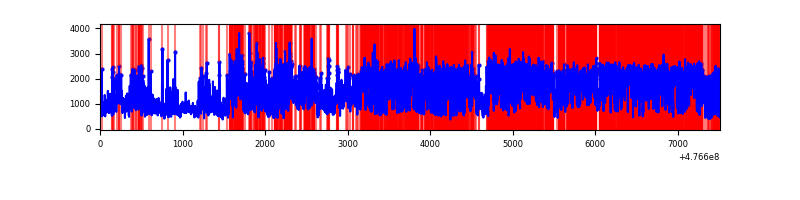 |
| C | 7511 | 7511 | 951 | 951 | 12.66% | 12.66% |  |
| D | 7511 | 7510 | 626 | 626 | 8.33% | 8.34% | 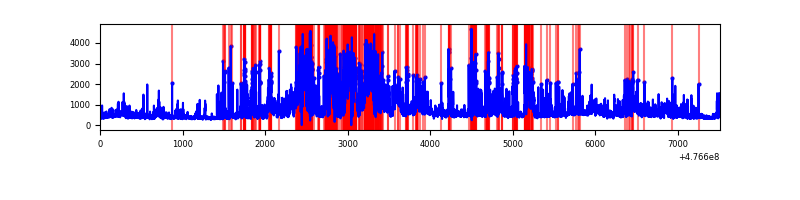 |
Top three noisy pixels from each quadrant. If the there are fewer than three noisy pixels in the level2.evt file, extra rows are filled as -1
| Pixel properties | Quadrant properties | ||||||
|---|---|---|---|---|---|---|---|
| Quadrant | DetID | PixID | Counts | Sigma | Mean | Median | Sigma |
| A | 4 | 4 | 632387 | 3296.09 | 775 | 755 | 191.6 |
| A | 4 | 3 | 241942 | 1258.6 | 775 | 755 | 191.6 |
| A | 12 | 250 | 232729 | 1210.52 | 775 | 755 | 191.6 |
| B | 4 | 170 | 7627799 | 49463.62 | 710 | 684 | 154.2 |
| B | 5 | 185 | 255610 | 1653.25 | 710 | 684 | 154.2 |
| B | 3 | 249 | 186078 | 1202.32 | 710 | 684 | 154.2 |
| C | 15 | 174 | 3663141 | 18371.2 | 720 | 714 | 199.4 |
| C | 13 | 3 | 510643 | 2557.87 | 720 | 714 | 199.4 |
| C | 15 | 1 | 402456 | 2015.19 | 720 | 714 | 199.4 |
| D | 7 | 110 | 1308931 | 6537.52 | 720 | 695 | 200.1 |
| D | 11 | 245 | 338941 | 1690.28 | 720 | 695 | 200.1 |
| D | 15 | 185 | 324523 | 1618.23 | 720 | 695 | 200.1 |
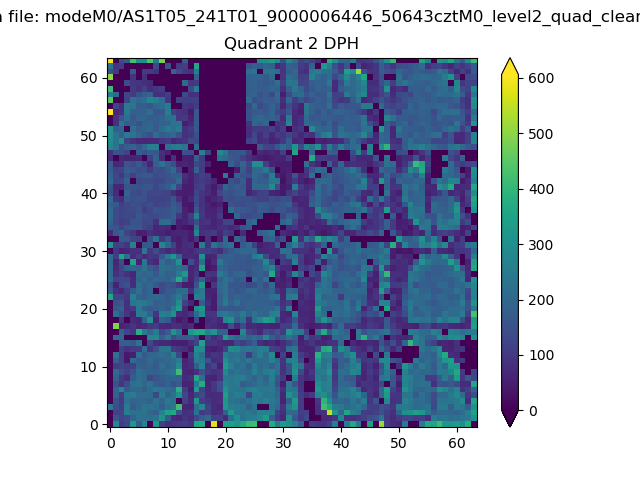
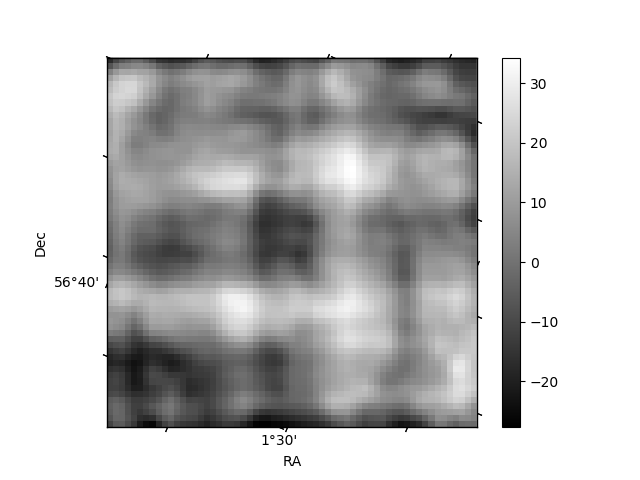
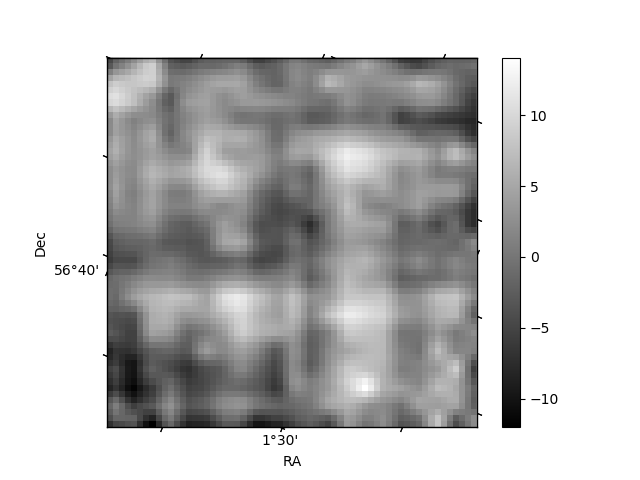
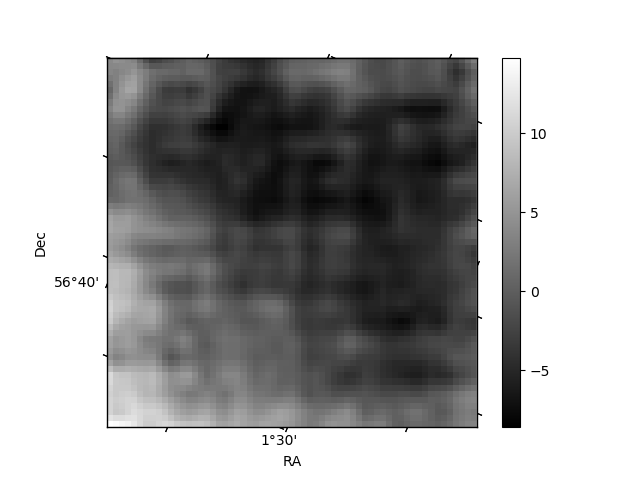
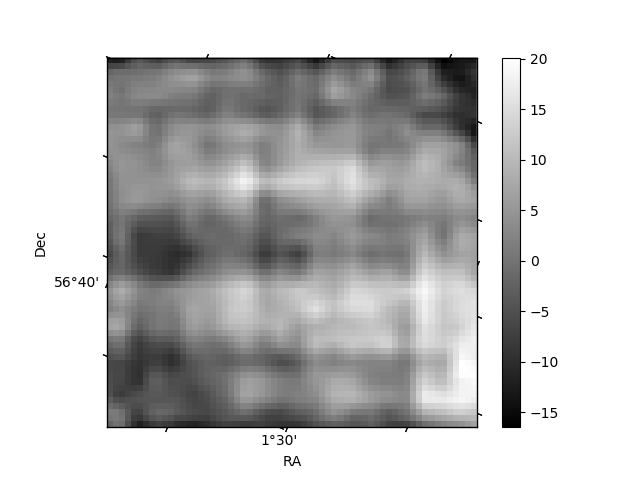
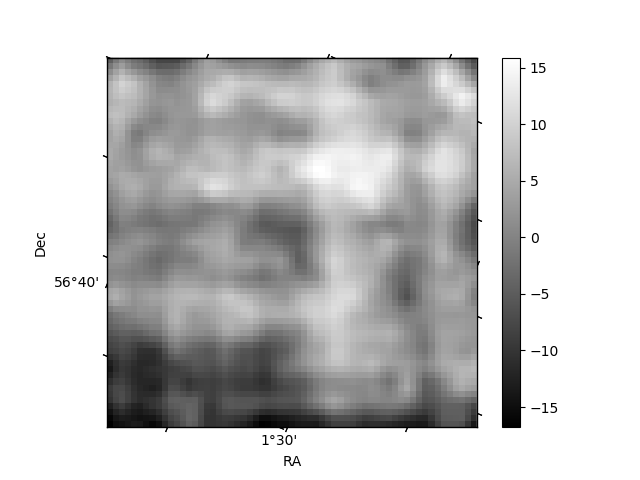
Histogram calculated using DETX and DETY for each event in the final _common_clean file
| Quadrant A | 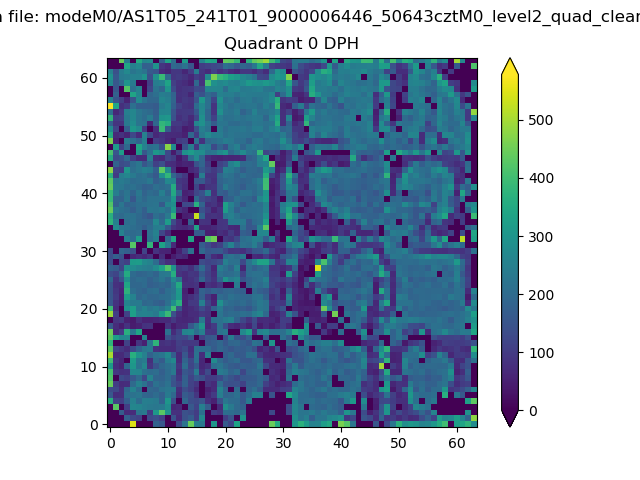 |
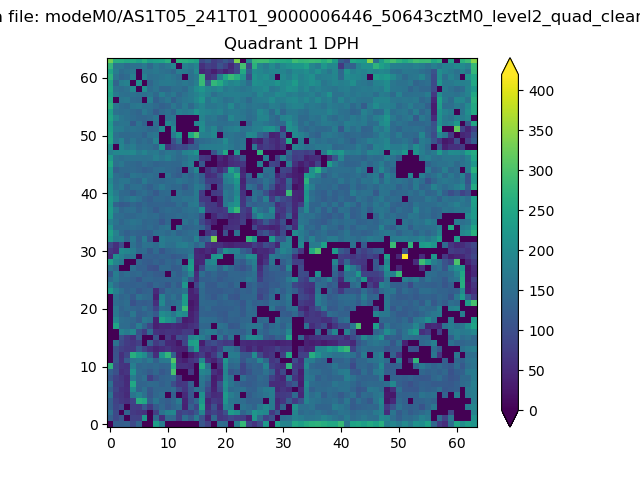 |
Quadrant B |
|---|---|---|---|
| Quadrant D | 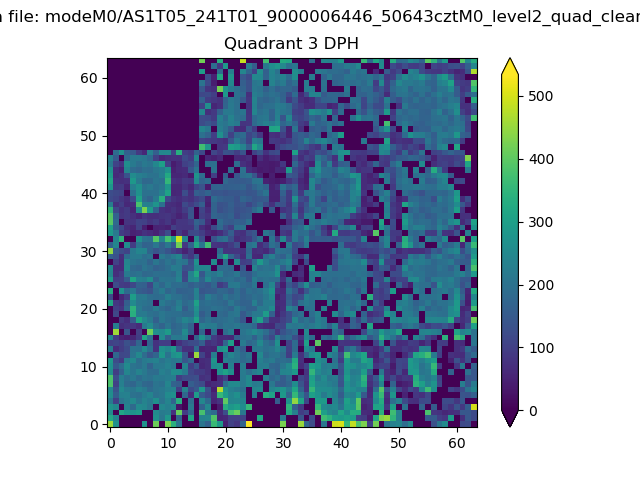 |
 |
Quadrant C |
| Plot type | Count rate plots | Images |
|---|---|---|
| Comparison with Poisson distribution Blue bars denote a histogram of data divided into 1 sec bins. Red curve is a Poisson curve with rate = median count rate of data. |
 |
 |
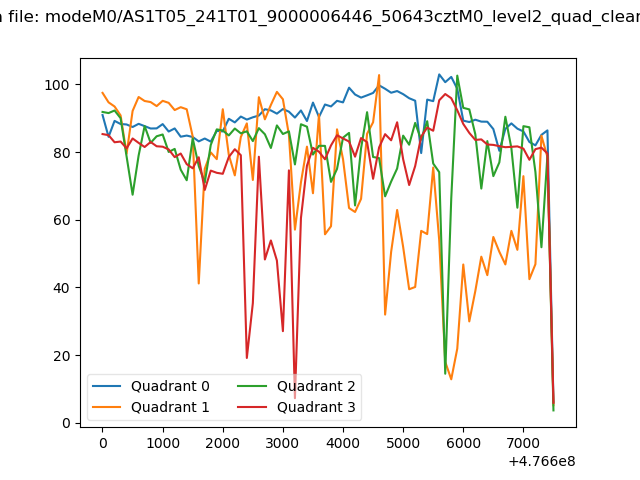
| Quadrant-wise count rates Data is divided into 100 sec bins |
 |
|
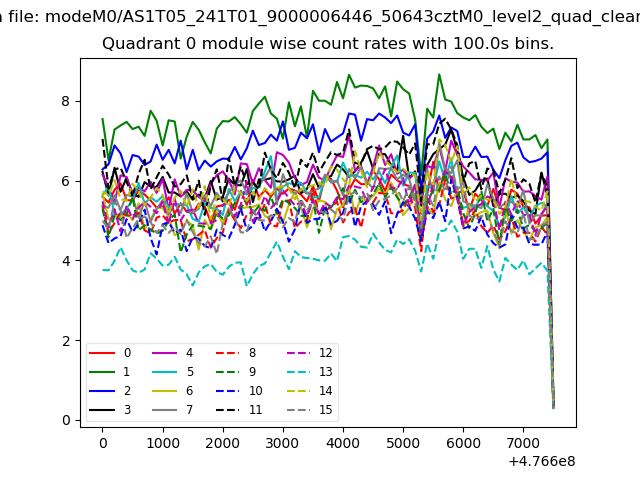
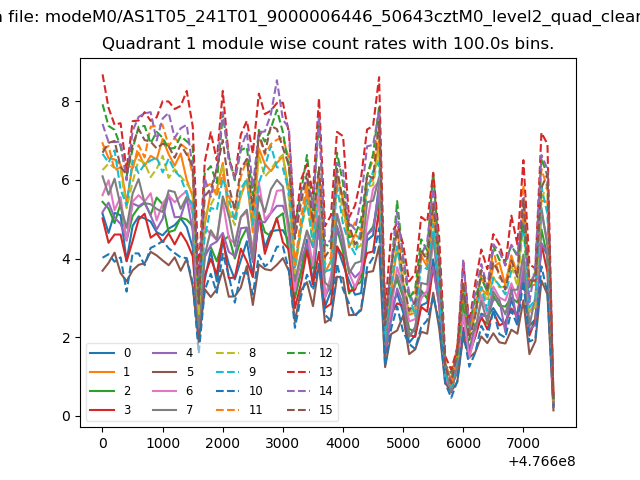
| Module-wise count rates for Quadrant A Data is divided into 100 sec bins |
 |
 |
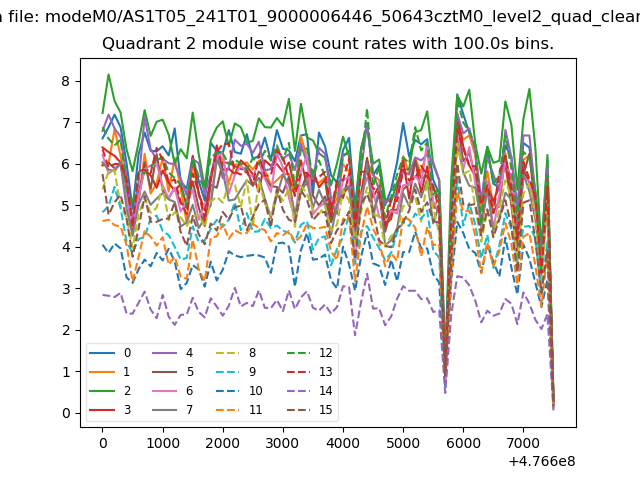
| Module-wise count rates for Quadrant B Data is divided into 100 sec bins |
 |
 |
| Module-wise count rates for Quadrant C Data is divided into 100 sec bins |
 |
 |
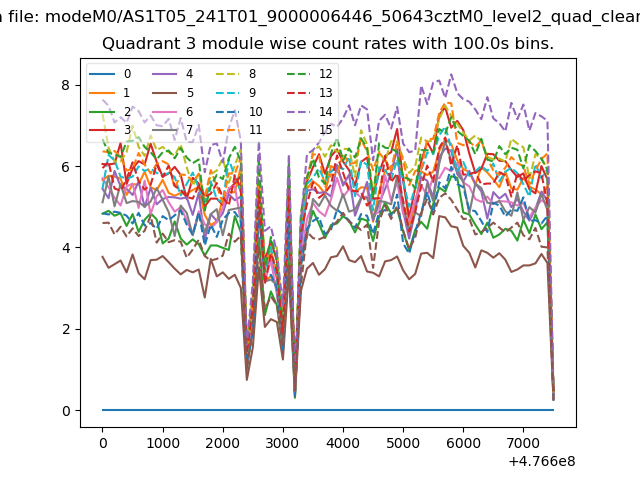
| Module-wise count rates for Quadrant D Data is divided into 100 sec bins |
 |
 |
| Parameter | Plot |
|---|---|
| CZT HV Monitor |  |
| D_VDD |  |
| Temperature 1 | 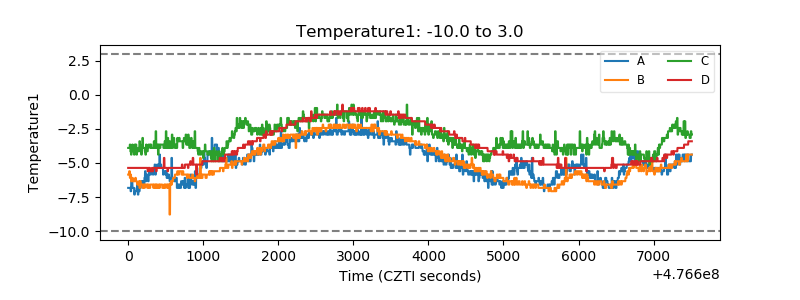 |
| Veto HV Monitor | 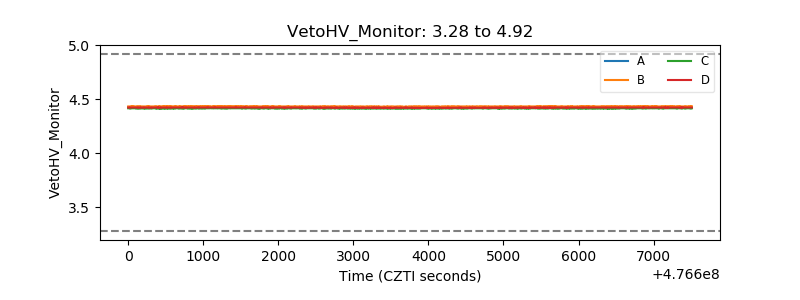 |
| Veto LLD | 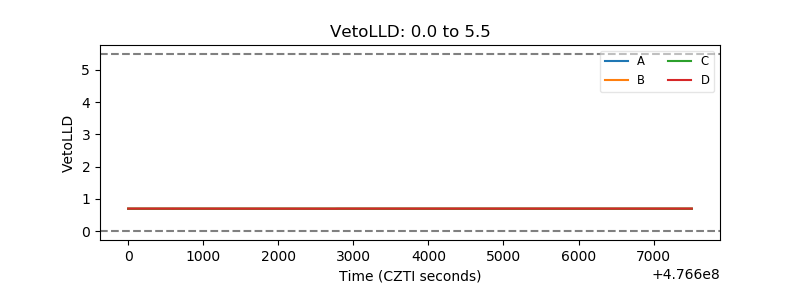 |
| Alpha Counter | 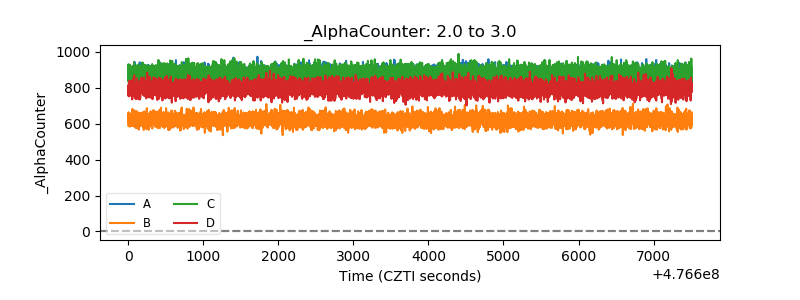 |
| _CPM_Rate | 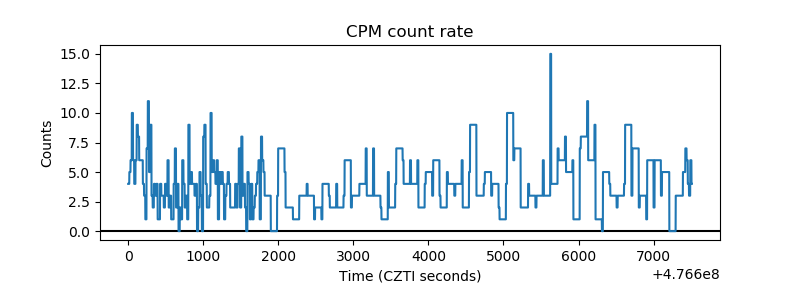 |
| CZT Counter | 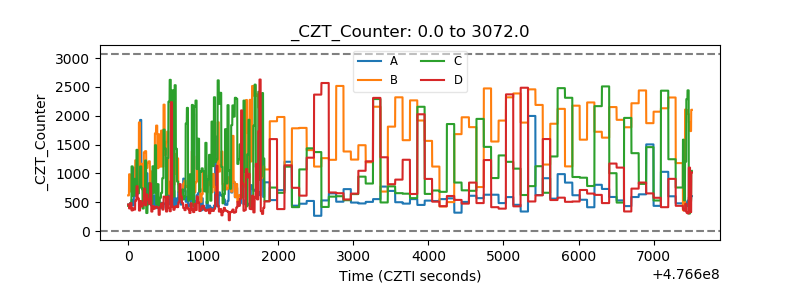 |
| +2.5 Volts monitor | 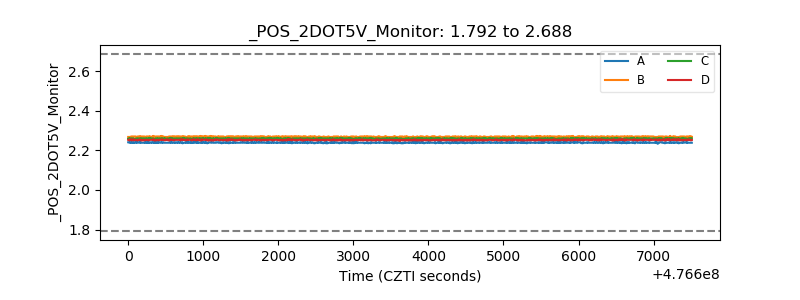 |
| +5 Volts monitor | 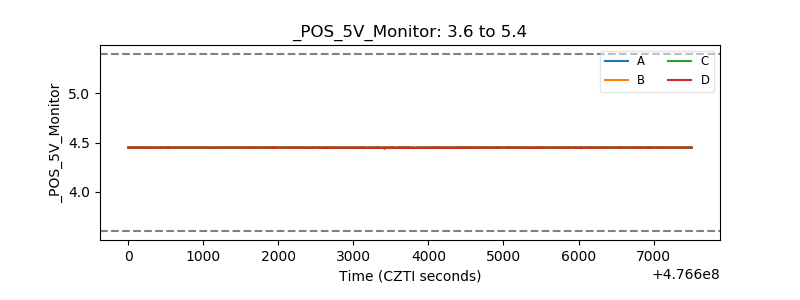 |
| _ROLL_ROT | 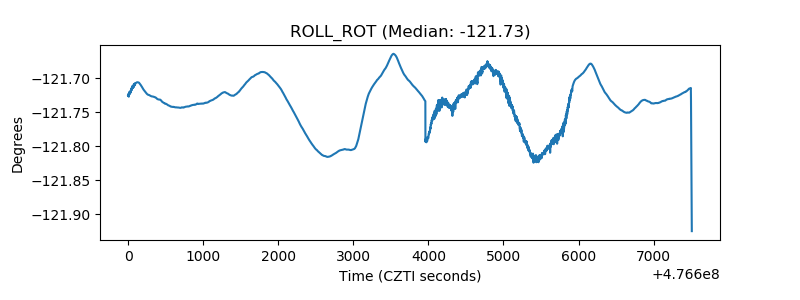 |
| _Roll_DEC |  |
| _Roll_RA | 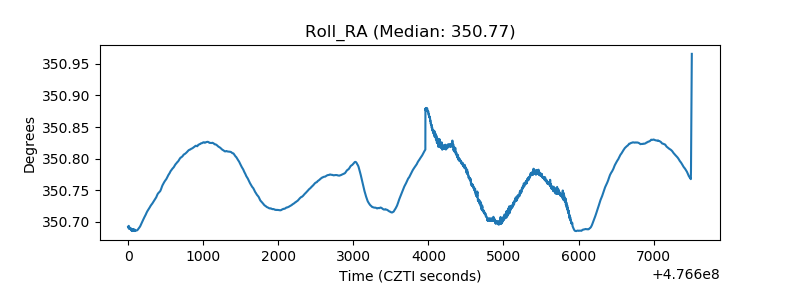 |
| Veto Counter | 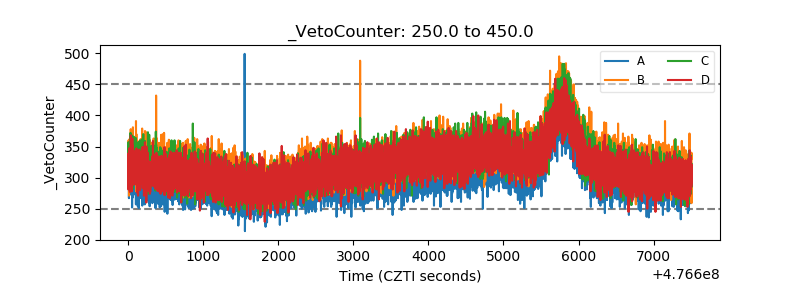 |