| Param | Original file | Final file |
|---|---|---|
| Filename | modeM0/AS1T05_241T01_9000006446_50648cztM0_level2.fits | modeM0/AS1T05_241T01_9000006446_50648cztM0_level2_quad_clean.evt |
| Size (bytes) | 670,677,120 | 85,144,320 |
| Size | 639.6 MB | 81.2 MB |
| Events in quadrant A | 4,669,091 | 567,809 |
| Events in quadrant B | 5,514,488 | 609,905 |
| Events in quadrant C | 8,474,495 | 460,340 |
| Events in quadrant D | 5,676,738 | 495,899 |
| Mode M9 | |||
|---|---|---|---|
| Quadrant | BADHDUFLAG | Total packets | Discarded packets |
| A | 0 | 8 | 0 |
| B | 0 | 8 | 0 |
| C | 0 | 8 | 0 |
| D | 0 | 8 | 0 |
| Mode M0 | |||
|---|---|---|---|
| Quadrant | BADHDUFLAG | Total packets | Discarded packets |
| A | 0 | 18171 | 1 |
| B | 0 | 20794 | 1 |
| C | 0 | 29643 | 8 |
| D | 0 | 21403 | 2 |
| Mode SS | |||
|---|---|---|---|
| Quadrant | BADHDUFLAG | Total packets | Discarded packets |
| A | 0 | 130 | 0 |
| B | 0 | 130 | 0 |
| C | 0 | 130 | 0 |
| D | 0 | 130 | 0 |
| Quadrant | Total seconds | Saturated seconds | Saturation percentage |
|---|---|---|---|
| A | 6355 | 419 | 6.593234% |
| B | 6355 | 477 | 7.505901% |
| C | 6355 | 1495 | 23.524784% |
| D | 6355 | 617 | 9.708891% |
Noise dominated data is calculated using 1-second bins in cleaned event files. If a bin has >2000 counts, and if more than 50% of those come from <1% of pixels, then it is considered to be noise-dominated and hence unusable.
| Quadrant | # 1 sec bins | Bins with >0 counts | Bins with >2000 counts | High rate bins dominated by noise | Noise dominated (total time) | Noise dominated (detector-on time) | Marked lightcurve |
|---|---|---|---|---|---|---|---|
| A | 7210 | 6356 | 293 | 293 | 4.06% | 4.61% | 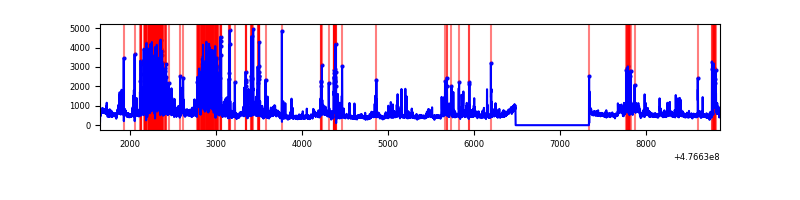 |
| B | 7210 | 6356 | 310 | 310 | 4.30% | 4.88% | 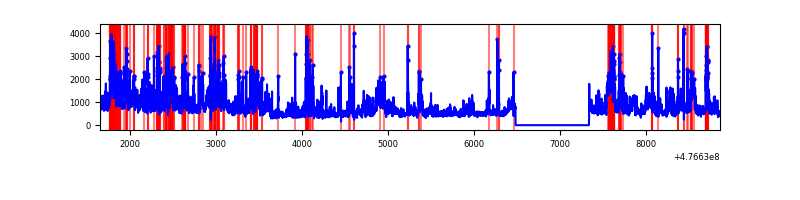 |
| C | 7211 | 6357 | 1164 | 1164 | 16.14% | 18.31% | 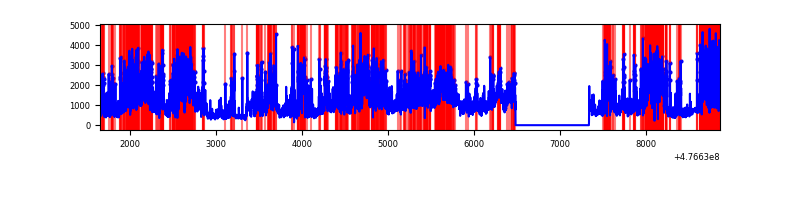 |
| D | 7210 | 6356 | 549 | 549 | 7.61% | 8.64% | 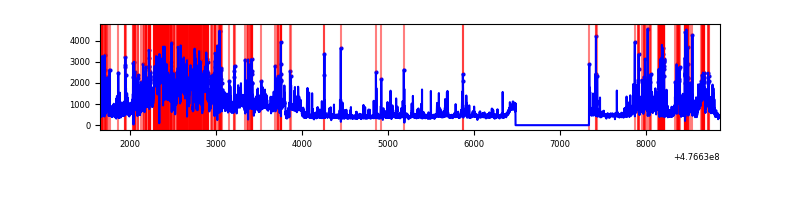 |
Top three noisy pixels from each quadrant. If the there are fewer than three noisy pixels in the level2.evt file, extra rows are filled as -1
| Pixel properties | Quadrant properties | ||||||
|---|---|---|---|---|---|---|---|
| Quadrant | DetID | PixID | Counts | Sigma | Mean | Median | Sigma |
| A | 3 | 130 | 954930 | 5828.7 | 656 | 637 | 163.7 |
| A | 4 | 4 | 417501 | 2546.15 | 656 | 637 | 163.7 |
| A | 4 | 3 | 170433 | 1037.09 | 656 | 637 | 163.7 |
| B | 4 | 170 | 1916175 | 13869.79 | 650 | 628 | 138.1 |
| B | 5 | 185 | 319906 | 2311.78 | 650 | 628 | 138.1 |
| B | 10 | 247 | 165028 | 1190.36 | 650 | 628 | 138.1 |
| C | 4 | 5 | 1478863 | 9011.7 | 592 | 588 | 164.0 |
| C | 0 | 209 | 1189701 | 7248.94 | 592 | 588 | 164.0 |
| C | 15 | 1 | 1167477 | 7113.46 | 592 | 588 | 164.0 |
| D | 2 | 249 | 1221822 | 7010.16 | 629 | 609 | 174.2 |
| D | 8 | 246 | 602168 | 3453.14 | 629 | 609 | 174.2 |
| D | 15 | 170 | 300349 | 1720.6 | 629 | 609 | 174.2 |
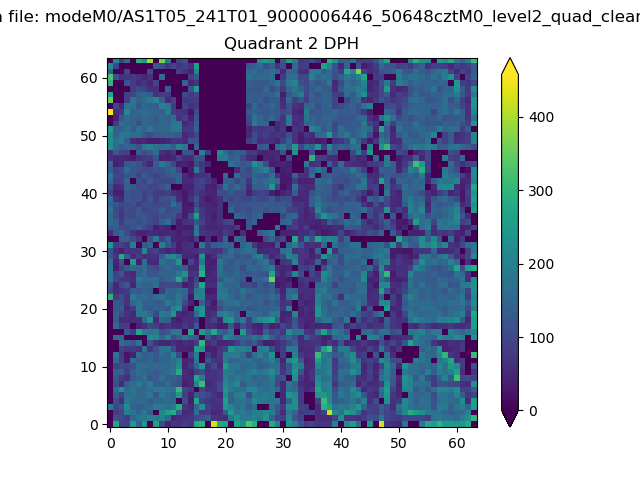
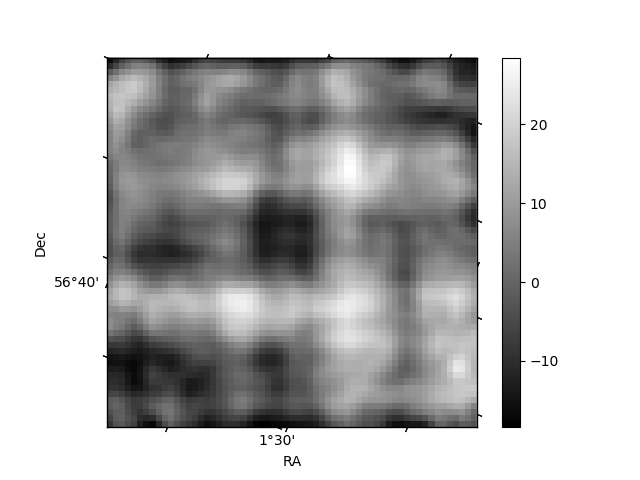
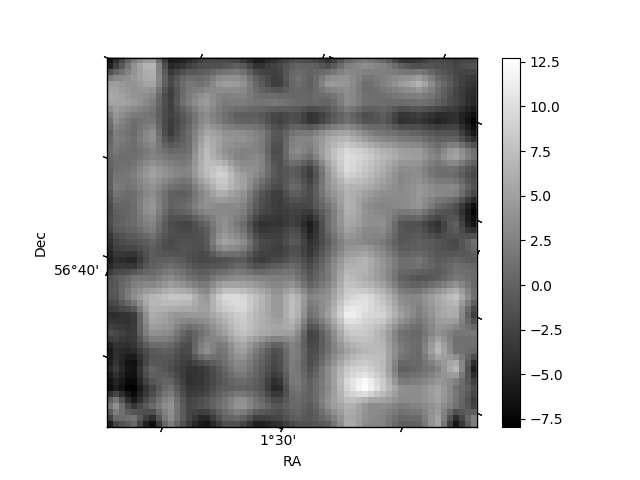
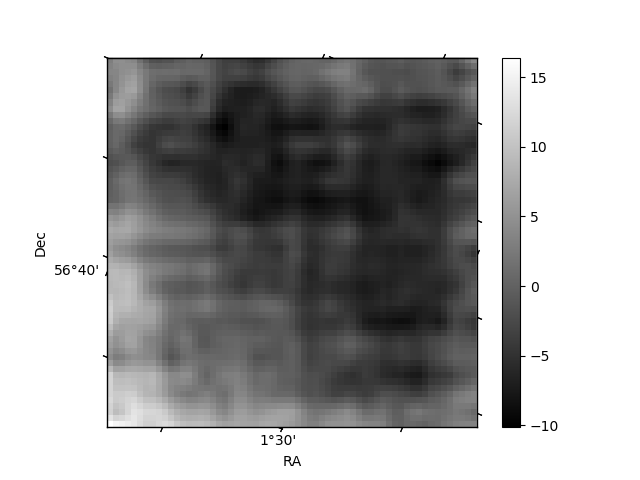
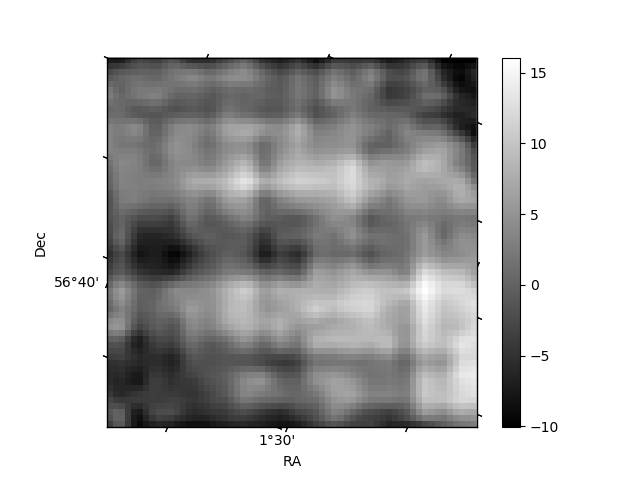
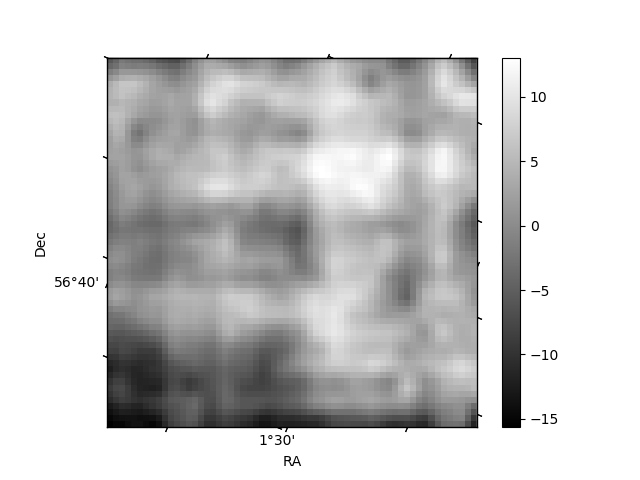
Histogram calculated using DETX and DETY for each event in the final _common_clean file
| Quadrant A | 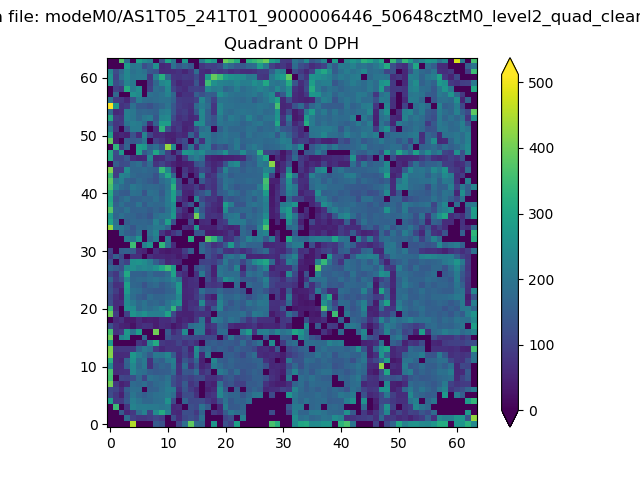 |
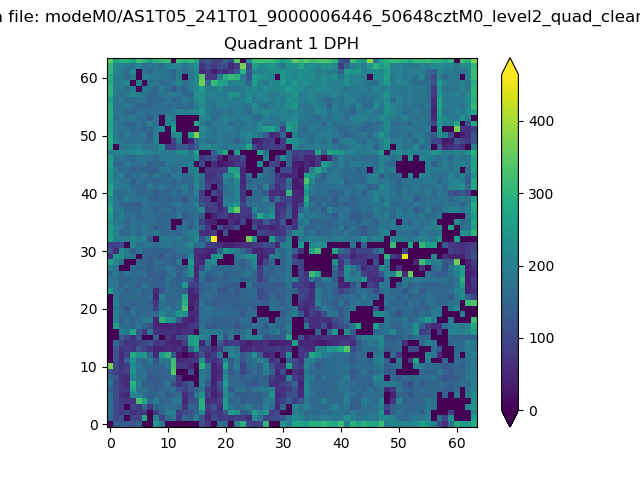 |
Quadrant B |
|---|---|---|---|
| Quadrant D | 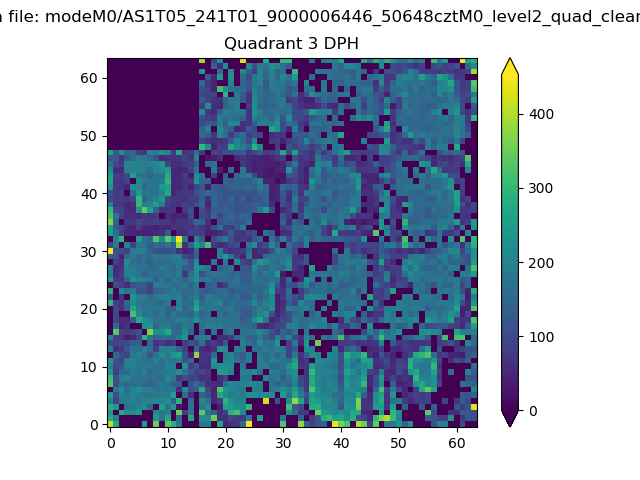 |
 |
Quadrant C |
| Plot type | Count rate plots | Images |
|---|---|---|
| Comparison with Poisson distribution Blue bars denote a histogram of data divided into 1 sec bins. Red curve is a Poisson curve with rate = median count rate of data. |
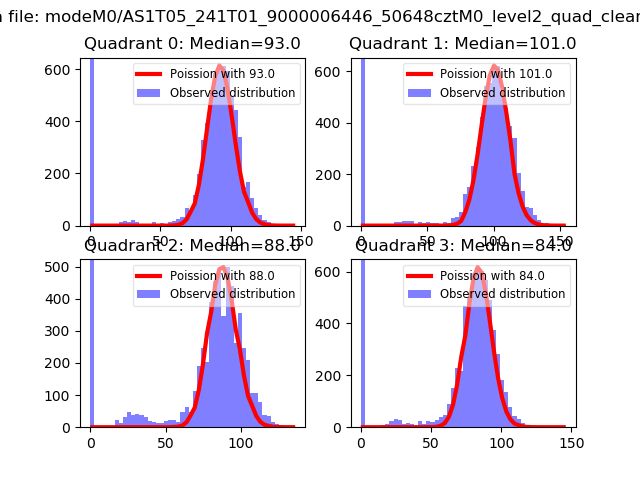 |
 |
| Quadrant-wise count rates Data is divided into 100 sec bins |
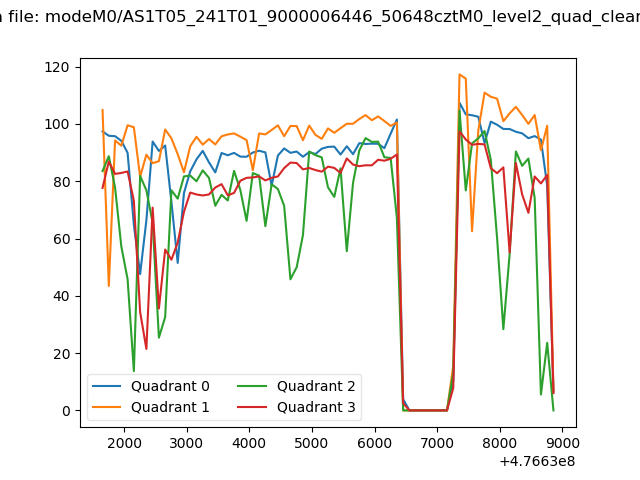 |
|
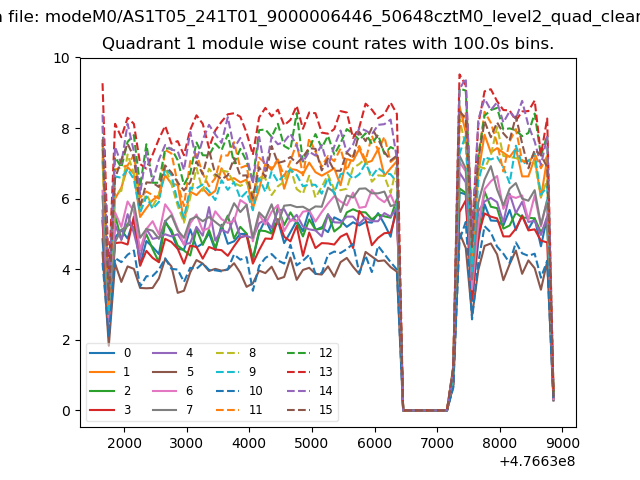
| Module-wise count rates for Quadrant A Data is divided into 100 sec bins |
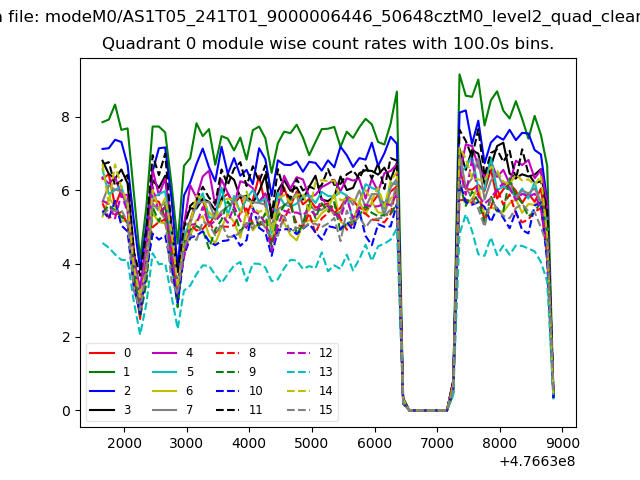 |
 |
| Module-wise count rates for Quadrant B Data is divided into 100 sec bins |
 |
 |
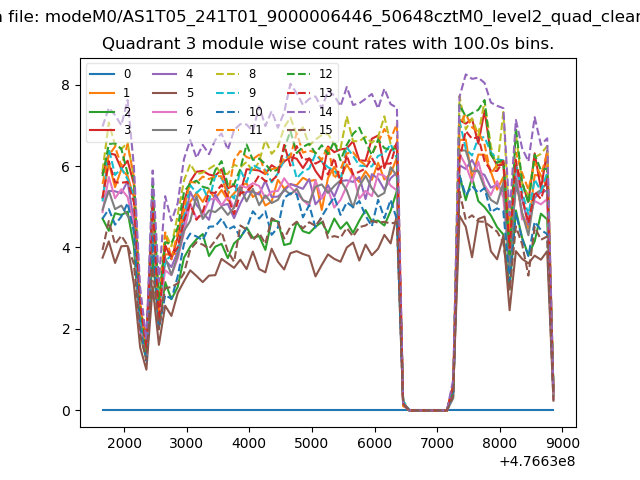
| Module-wise count rates for Quadrant C Data is divided into 100 sec bins |
 |
 |
| Module-wise count rates for Quadrant D Data is divided into 100 sec bins |
 |
 |
| Parameter | Plot |
|---|---|
| CZT HV Monitor | 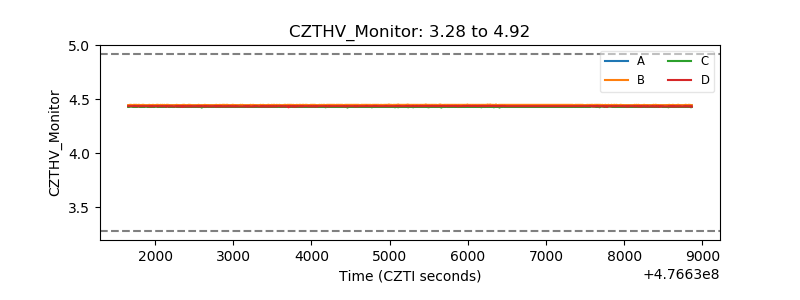 |
| D_VDD | 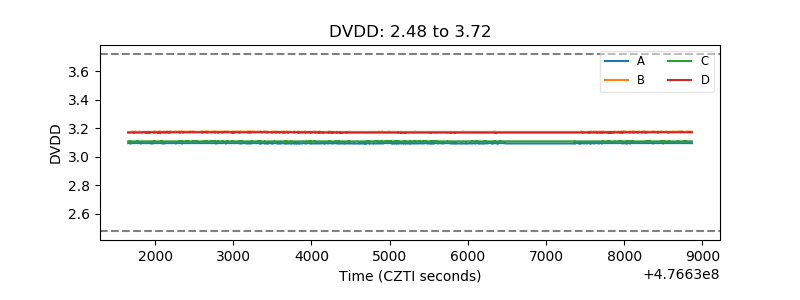 |
| Temperature 1 | 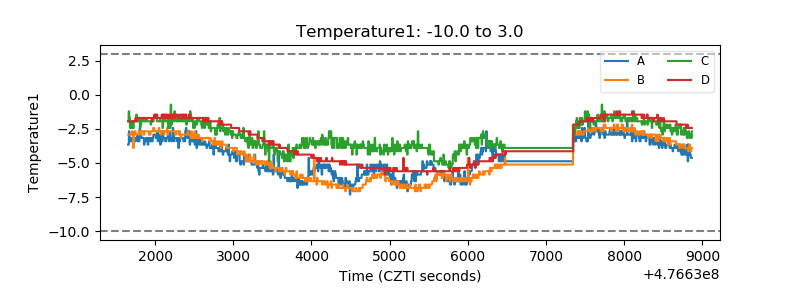 |
| Veto HV Monitor |  |
| Veto LLD | 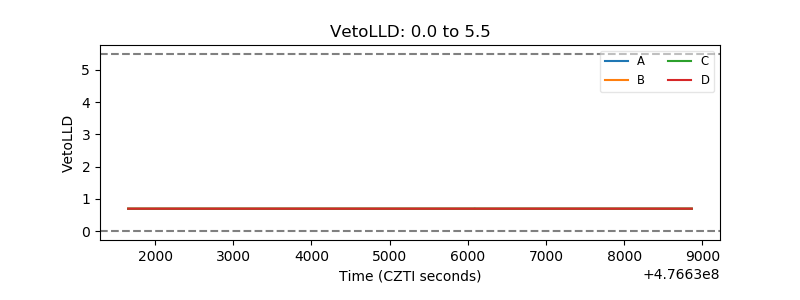 |
| Alpha Counter | 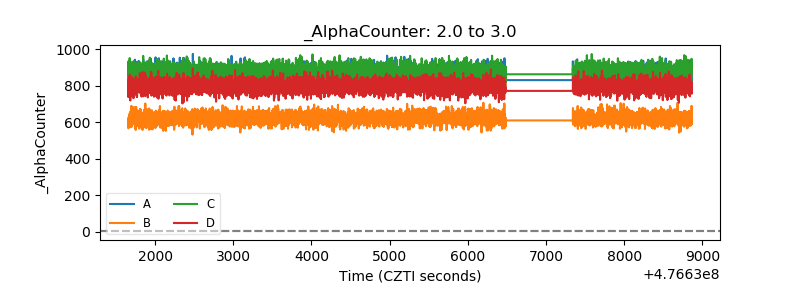 |
| _CPM_Rate | 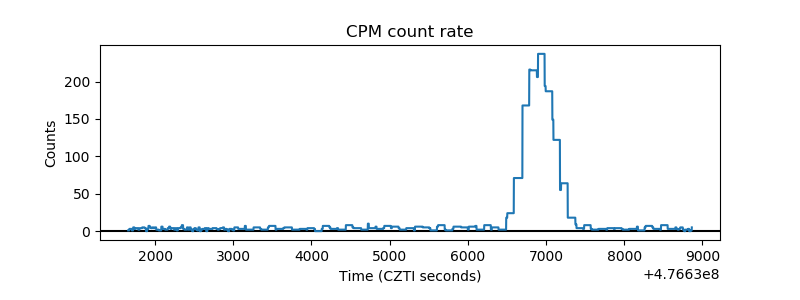 |
| CZT Counter | 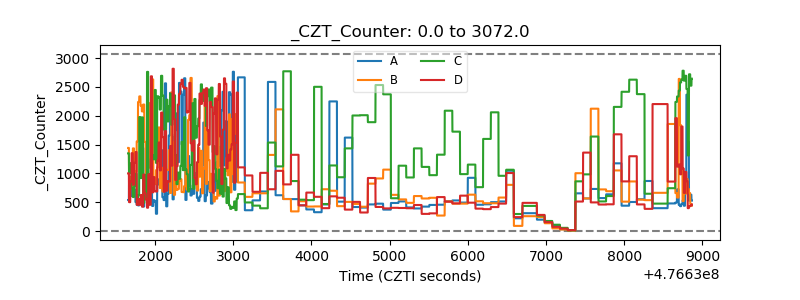 |
| +2.5 Volts monitor | 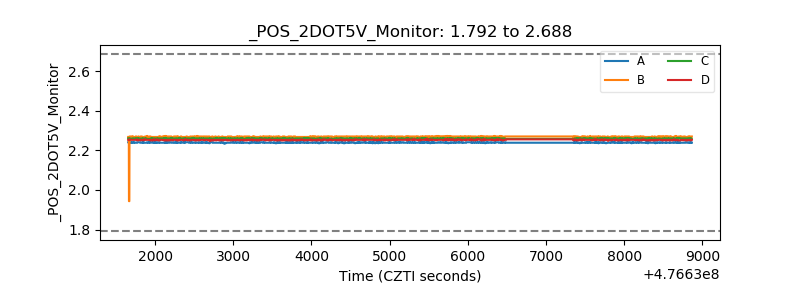 |
| +5 Volts monitor |  |
| _ROLL_ROT | 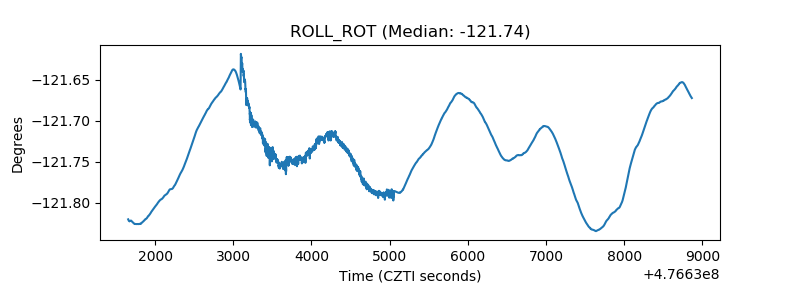 |
| _Roll_DEC | 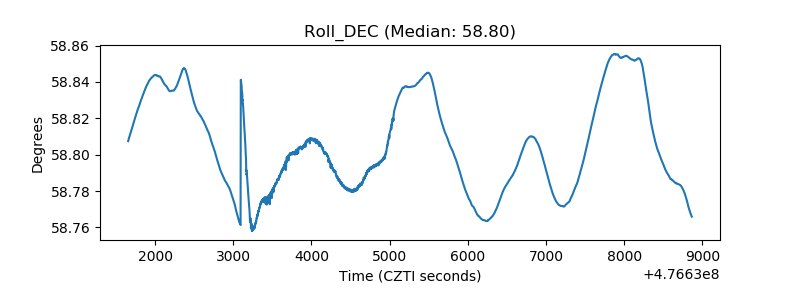 |
| _Roll_RA | 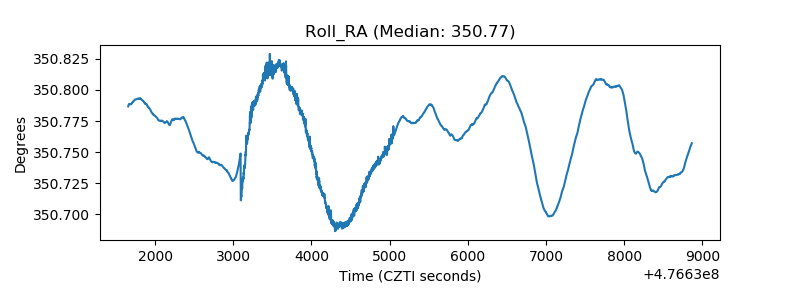 |
| Veto Counter | 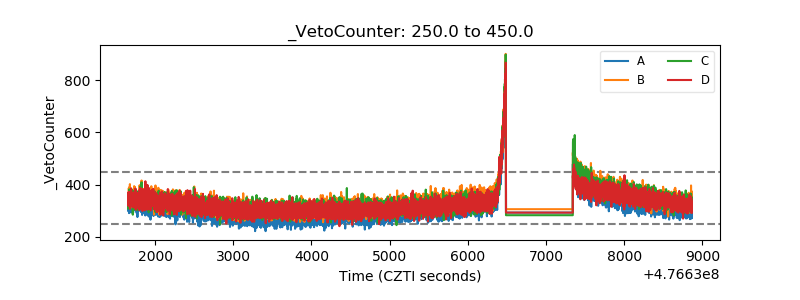 |