| Param | Original file | Final file |
|---|---|---|
| Filename | modeM0/AS1T05_241T01_9000006446_50650cztM0_level2.fits | modeM0/AS1T05_241T01_9000006446_50650cztM0_level2_quad_clean.evt |
| Size (bytes) | 561,663,360 | 85,026,240 |
| Size | 535.6 MB | 81.1 MB |
| Events in quadrant A | 4,964,938 | 526,839 |
| Events in quadrant B | 4,405,693 | 617,588 |
| Events in quadrant C | 6,102,268 | 501,721 |
| Events in quadrant D | 4,843,845 | 500,690 |
| Mode M9 | |||
|---|---|---|---|
| Quadrant | BADHDUFLAG | Total packets | Discarded packets |
| A | 0 | 10 | 0 |
| B | 0 | 10 | 0 |
| C | 0 | 10 | 0 |
| D | 0 | 10 | 0 |
| Mode M0 | |||
|---|---|---|---|
| Quadrant | BADHDUFLAG | Total packets | Discarded packets |
| A | 0 | 18749 | 1 |
| B | 0 | 17295 | 1 |
| C | 0 | 22317 | 1 |
| D | 0 | 18781 | 1 |
| Mode SS | |||
|---|---|---|---|
| Quadrant | BADHDUFLAG | Total packets | Discarded packets |
| A | 0 | 126 | 0 |
| B | 0 | 126 | 0 |
| C | 0 | 126 | 0 |
| D | 0 | 126 | 0 |
| Quadrant | Total seconds | Saturated seconds | Saturation percentage |
|---|---|---|---|
| A | 6120 | 608 | 9.934641% |
| B | 6119 | 159 | 2.598464% |
| C | 6119 | 716 | 11.701258% |
| D | 6119 | 390 | 6.373590% |
Noise dominated data is calculated using 1-second bins in cleaned event files. If a bin has >2000 counts, and if more than 50% of those come from <1% of pixels, then it is considered to be noise-dominated and hence unusable.
| Quadrant | # 1 sec bins | Bins with >0 counts | Bins with >2000 counts | High rate bins dominated by noise | Noise dominated (total time) | Noise dominated (detector-on time) | Marked lightcurve |
|---|---|---|---|---|---|---|---|
| A | 7140 | 6121 | 512 | 512 | 7.17% | 8.36% | 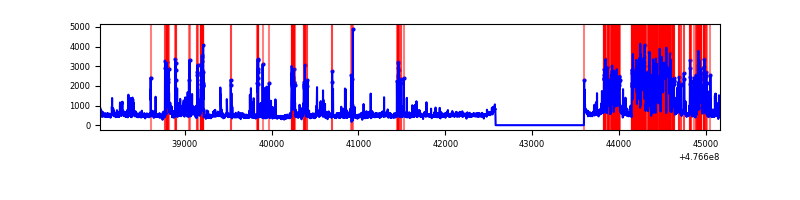 |
| B | 7139 | 6120 | 96 | 96 | 1.34% | 1.57% | 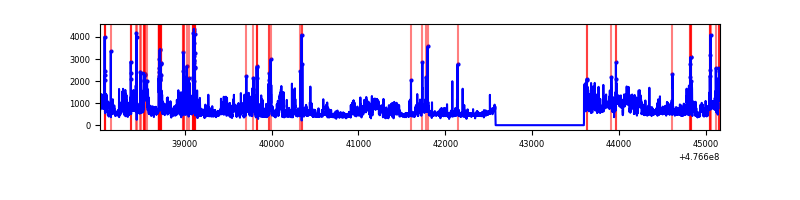 |
| C | 7139 | 6120 | 567 | 567 | 7.94% | 9.26% | 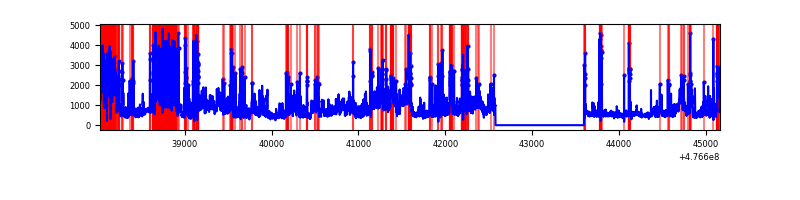 |
| D | 7139 | 6120 | 314 | 314 | 4.40% | 5.13% | 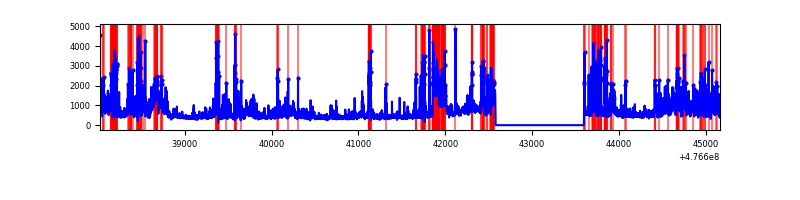 |
Top three noisy pixels from each quadrant. If the there are fewer than three noisy pixels in the level2.evt file, extra rows are filled as -1
| Pixel properties | Quadrant properties | ||||||
|---|---|---|---|---|---|---|---|
| Quadrant | DetID | PixID | Counts | Sigma | Mean | Median | Sigma |
| A | 4 | 249 | 624590 | 4025.43 | 615 | 600 | 155.0 |
| A | 3 | 130 | 498411 | 3211.44 | 615 | 600 | 155.0 |
| A | 8 | 247 | 276061 | 1777.03 | 615 | 600 | 155.0 |
| B | 4 | 170 | 1106041 | 8132.57 | 633 | 612 | 135.9 |
| B | 5 | 185 | 254935 | 1871.04 | 633 | 612 | 135.9 |
| B | 4 | 206 | 144218 | 1056.5 | 633 | 612 | 135.9 |
| C | 4 | 5 | 1225689 | 7363.68 | 599 | 594 | 166.4 |
| C | 15 | 1 | 774047 | 4648.99 | 599 | 594 | 166.4 |
| C | 15 | 174 | 498157 | 2990.7 | 599 | 594 | 166.4 |
| D | 7 | 96 | 541508 | 3210.19 | 608 | 587 | 168.5 |
| D | 2 | 249 | 493976 | 2928.11 | 608 | 587 | 168.5 |
| D | 15 | 122 | 259967 | 1539.34 | 608 | 587 | 168.5 |
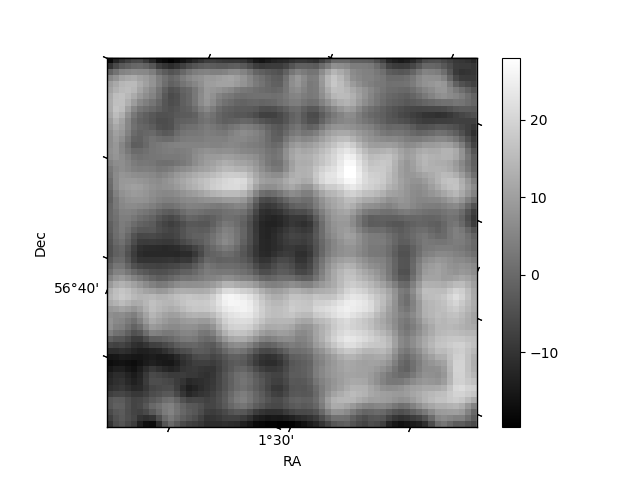
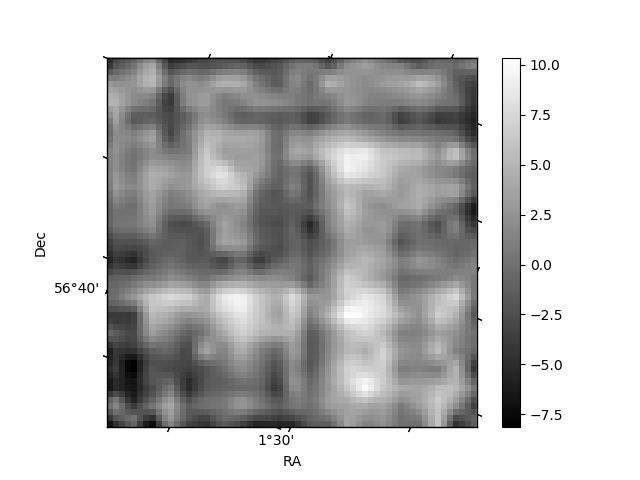
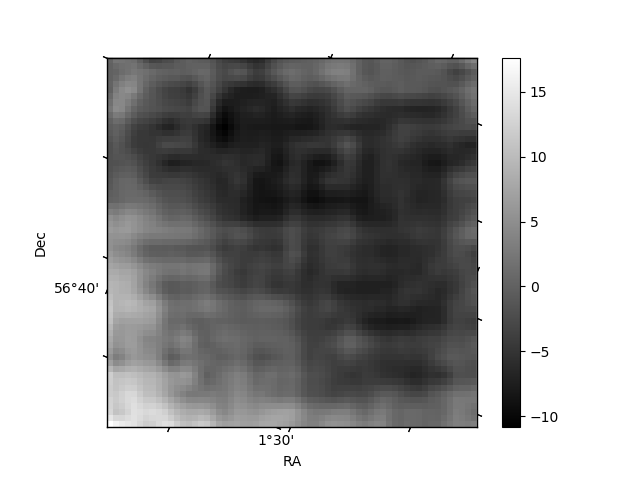
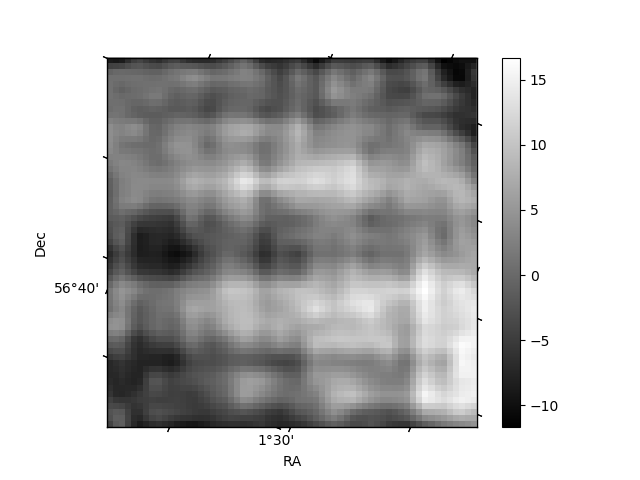
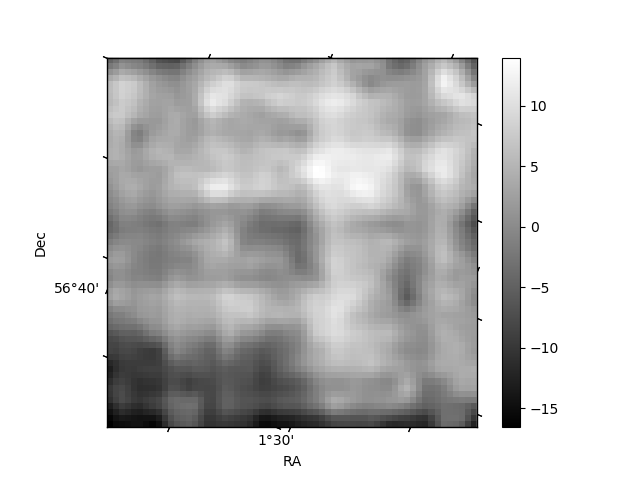
Histogram calculated using DETX and DETY for each event in the final _common_clean file
| Quadrant A | 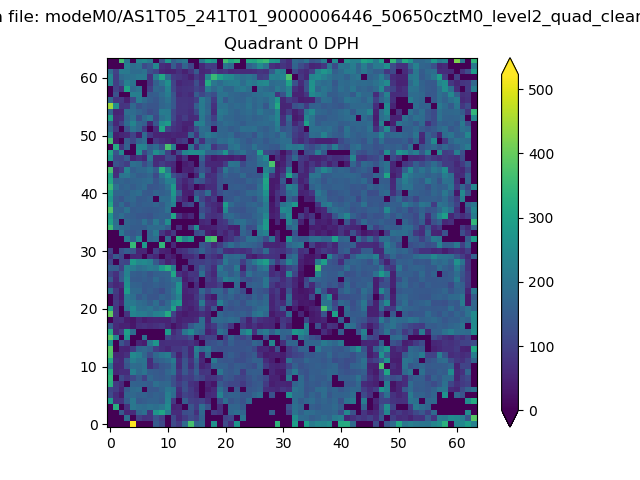 |
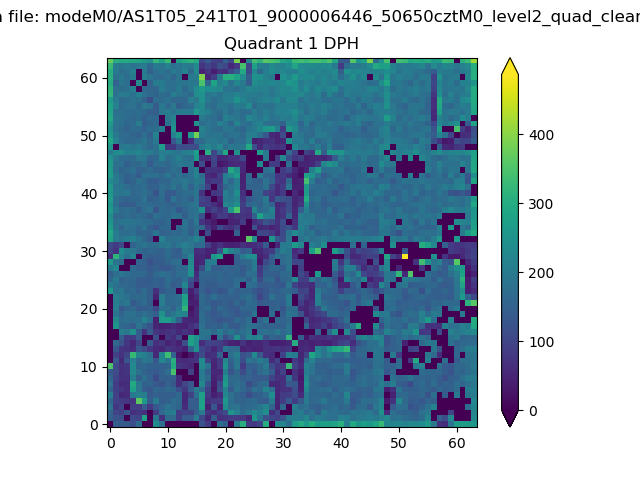 |
Quadrant B |
|---|---|---|---|
| Quadrant D | 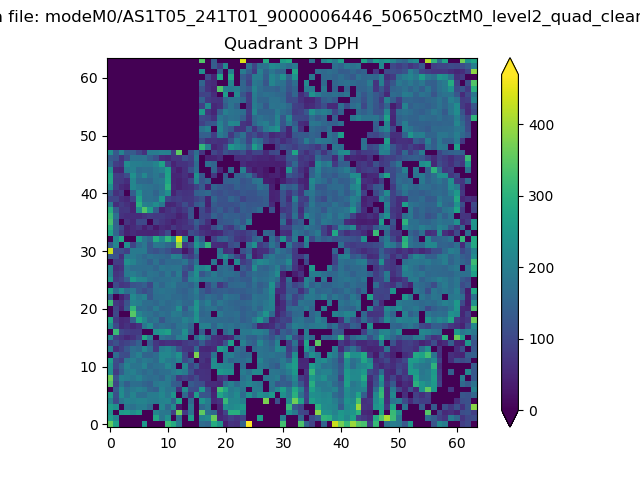 |
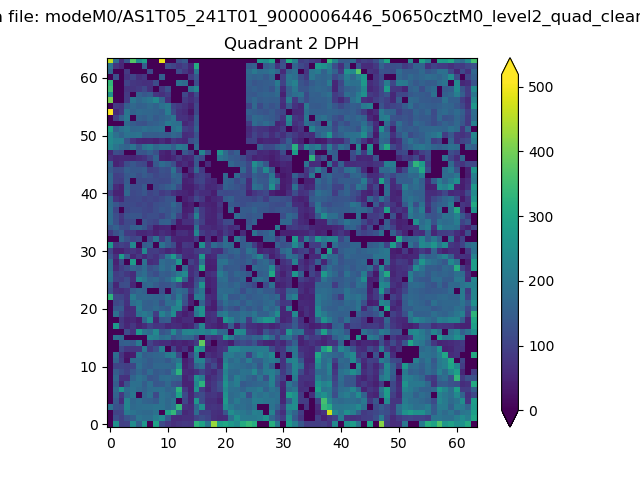 |
Quadrant C |
| Plot type | Count rate plots | Images |
|---|---|---|
| Comparison with Poisson distribution Blue bars denote a histogram of data divided into 1 sec bins. Red curve is a Poisson curve with rate = median count rate of data. |
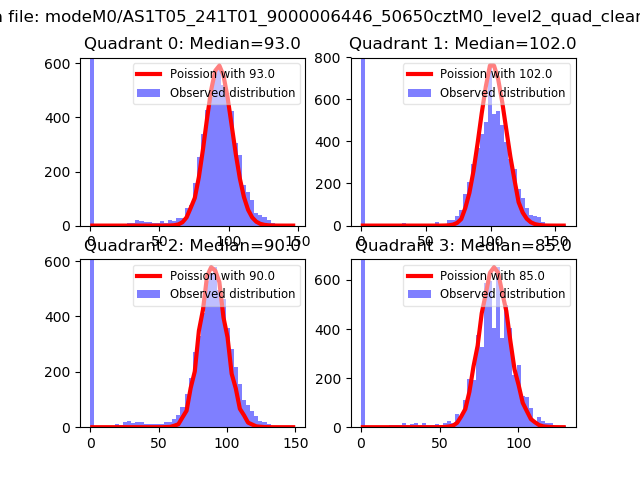 |
 |
| Quadrant-wise count rates Data is divided into 100 sec bins |
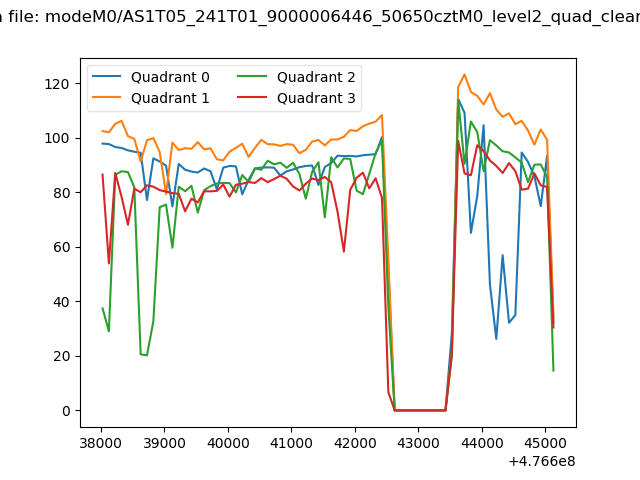 |
|
| Module-wise count rates for Quadrant A Data is divided into 100 sec bins |
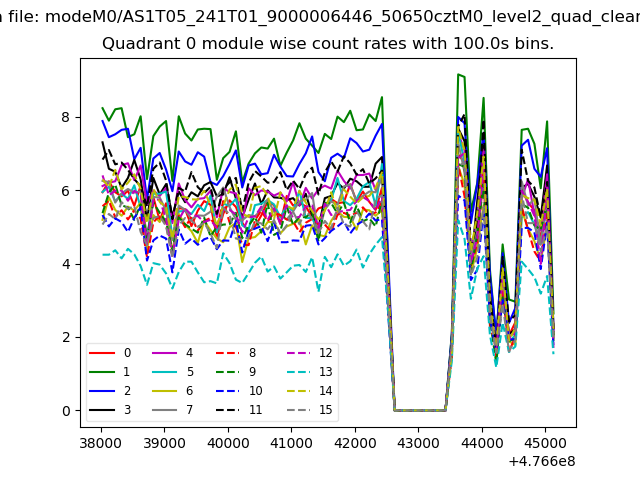 |
 |
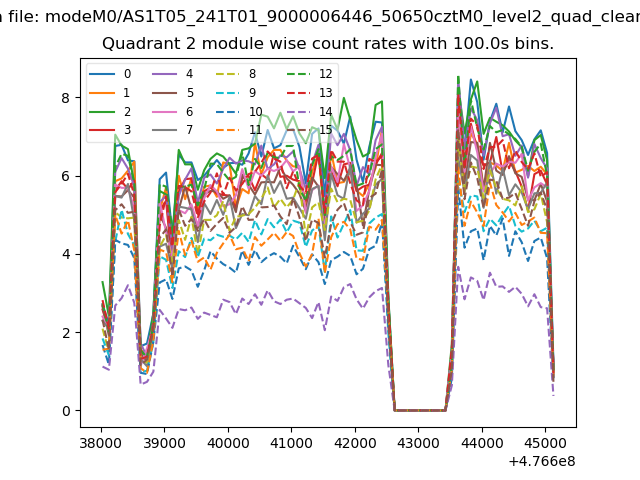
| Module-wise count rates for Quadrant B Data is divided into 100 sec bins |
 |
 |
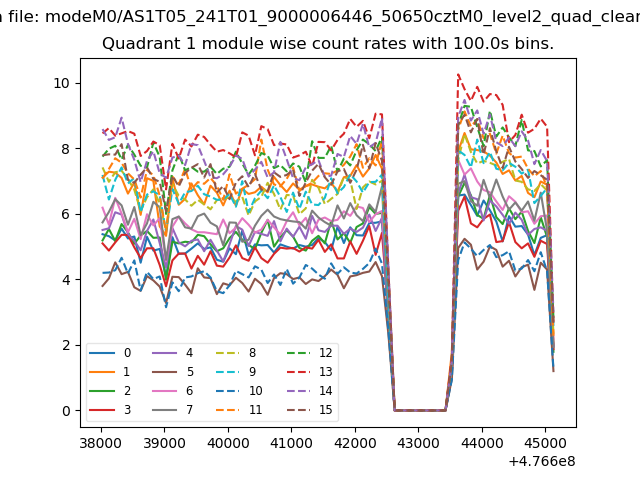
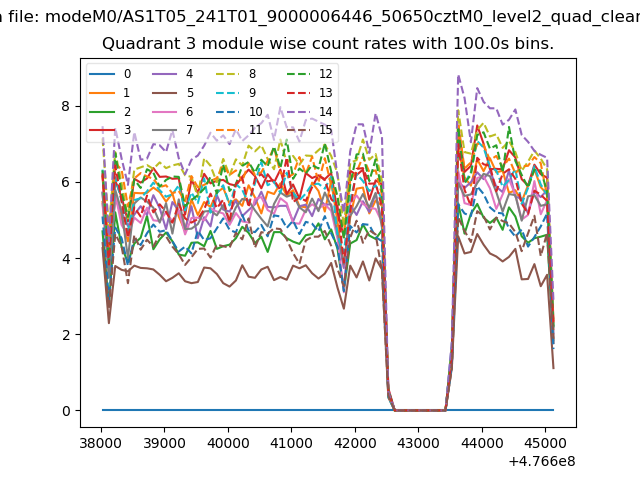
| Module-wise count rates for Quadrant C Data is divided into 100 sec bins |
 |
 |
| Module-wise count rates for Quadrant D Data is divided into 100 sec bins |
 |
 |
| Parameter | Plot |
|---|---|
| CZT HV Monitor | 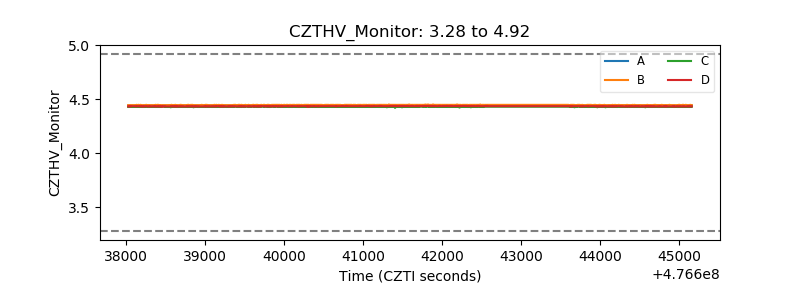 |
| D_VDD | 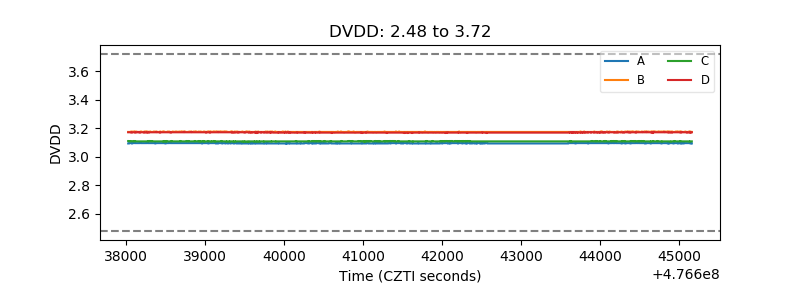 |
| Temperature 1 | 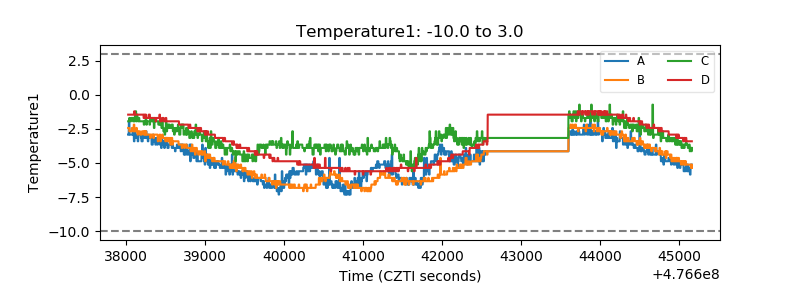 |
| Veto HV Monitor | 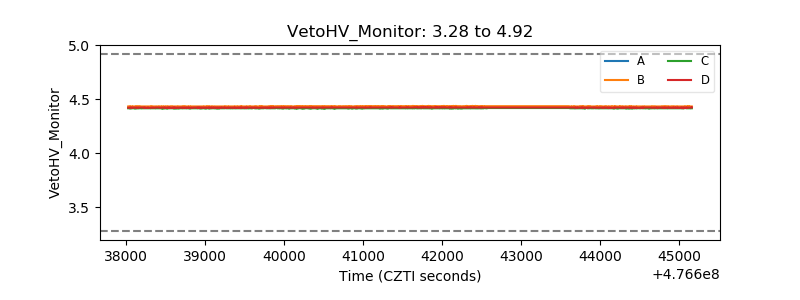 |
| Veto LLD | 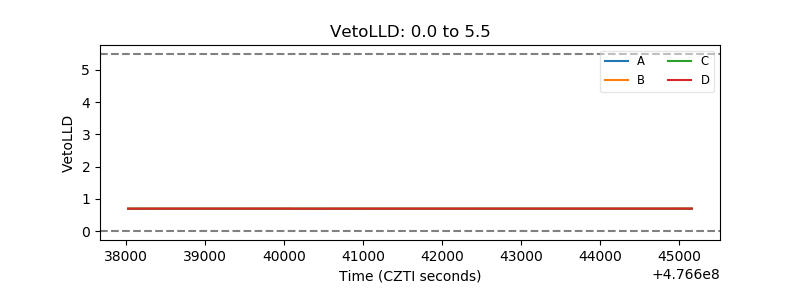 |
| Alpha Counter | 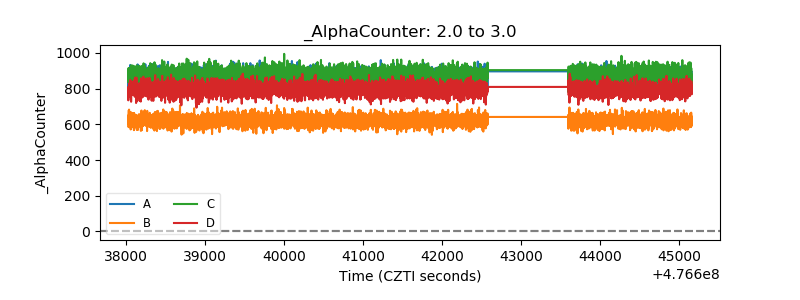 |
| _CPM_Rate | 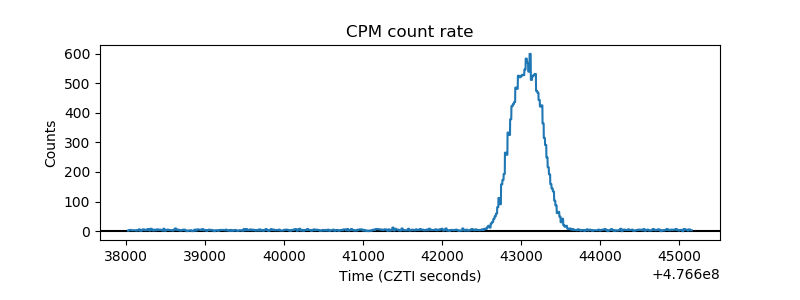 |
| CZT Counter | 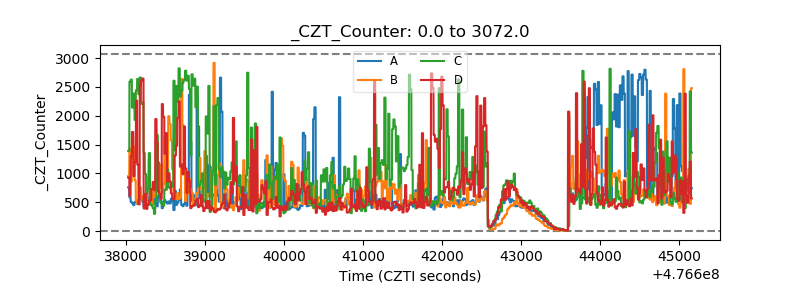 |
| +2.5 Volts monitor | 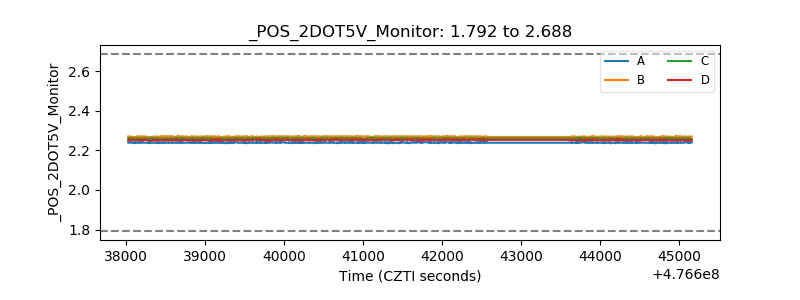 |
| +5 Volts monitor | 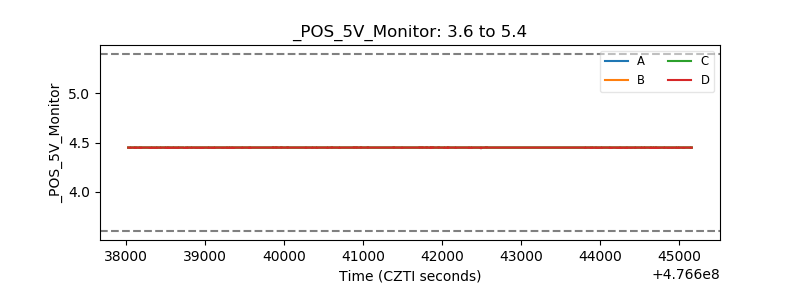 |
| _ROLL_ROT | 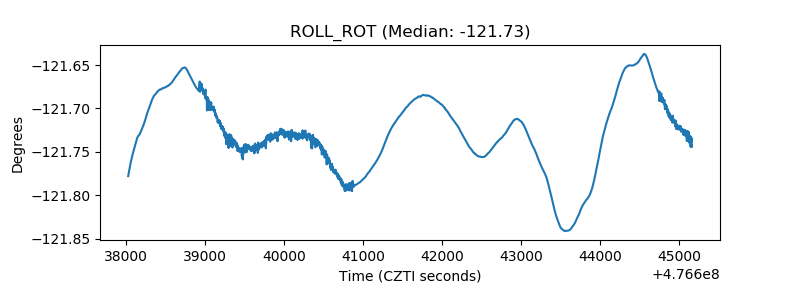 |
| _Roll_DEC | 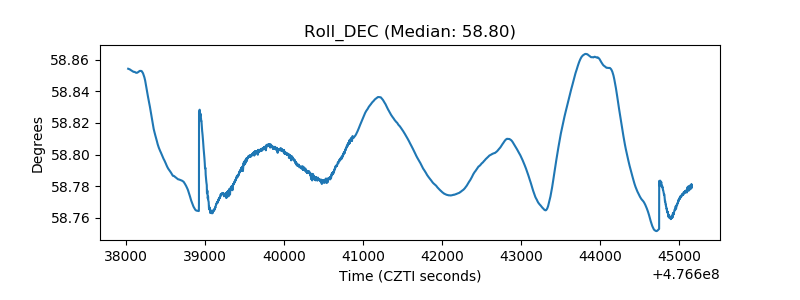 |
| _Roll_RA | 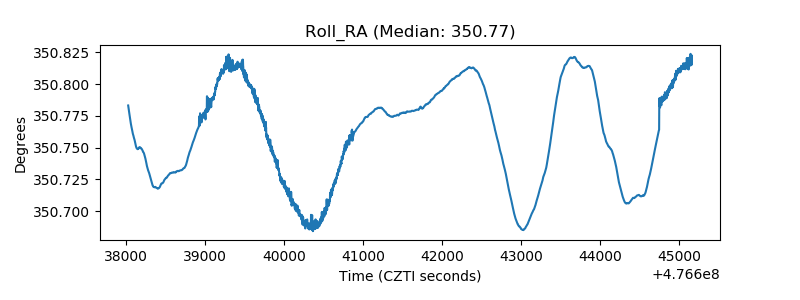 |
| Veto Counter | 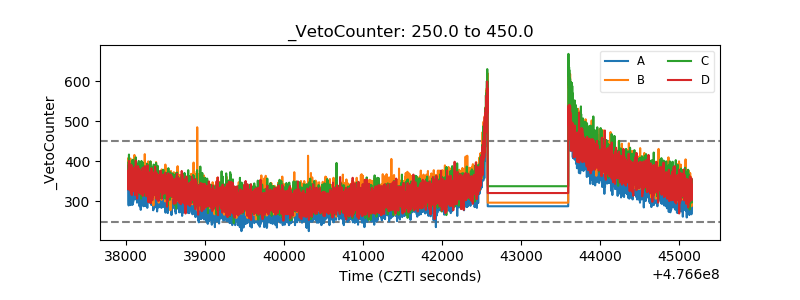 |