| Param | Original file | Final file |
|---|---|---|
| Filename | modeM0/AS1T05_241T01_9000006446_50651cztM0_level2.fits | modeM0/AS1T05_241T01_9000006446_50651cztM0_level2_quad_clean.evt |
| Size (bytes) | 523,584,000 | 88,678,080 |
| Size | 499.3 MB | 84.6 MB |
| Events in quadrant A | 5,586,282 | 521,025 |
| Events in quadrant B | 4,306,074 | 639,764 |
| Events in quadrant C | 4,824,533 | 557,494 |
| Events in quadrant D | 4,185,902 | 535,886 |
| Mode M9 | |||
|---|---|---|---|
| Quadrant | BADHDUFLAG | Total packets | Discarded packets |
| A | 0 | 11 | 0 |
| B | 0 | 11 | 0 |
| C | 0 | 11 | 0 |
| D | 0 | 11 | 0 |
| Mode M0 | |||
|---|---|---|---|
| Quadrant | BADHDUFLAG | Total packets | Discarded packets |
| A | 0 | 20900 | 1 |
| B | 0 | 17049 | 2 |
| C | 0 | 18480 | 1 |
| D | 0 | 16844 | 1 |
| Mode SS | |||
|---|---|---|---|
| Quadrant | BADHDUFLAG | Total packets | Discarded packets |
| A | 0 | 126 | 0 |
| B | 0 | 126 | 0 |
| C | 0 | 126 | 0 |
| D | 0 | 126 | 0 |
| Quadrant | Total seconds | Saturated seconds | Saturation percentage |
|---|---|---|---|
| A | 6170 | 892 | 14.457050% |
| B | 6169 | 183 | 2.966445% |
| C | 6169 | 393 | 6.370562% |
| D | 6170 | 172 | 2.787682% |
Noise dominated data is calculated using 1-second bins in cleaned event files. If a bin has >2000 counts, and if more than 50% of those come from <1% of pixels, then it is considered to be noise-dominated and hence unusable.
| Quadrant | # 1 sec bins | Bins with >0 counts | Bins with >2000 counts | High rate bins dominated by noise | Noise dominated (total time) | Noise dominated (detector-on time) | Marked lightcurve |
|---|---|---|---|---|---|---|---|
| A | 7270 | 6171 | 755 | 755 | 10.39% | 12.23% | 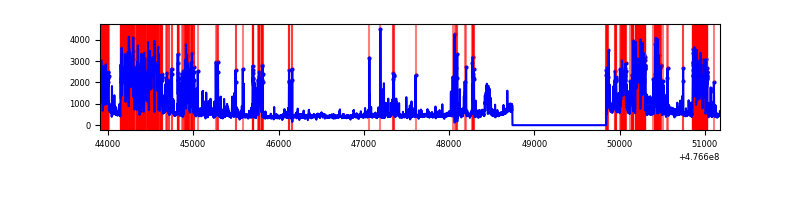 |
| B | 7269 | 6170 | 61 | 61 | 0.84% | 0.99% | 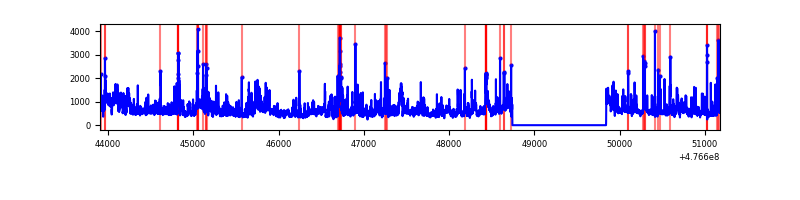 |
| C | 7269 | 6170 | 313 | 313 | 4.31% | 5.07% | 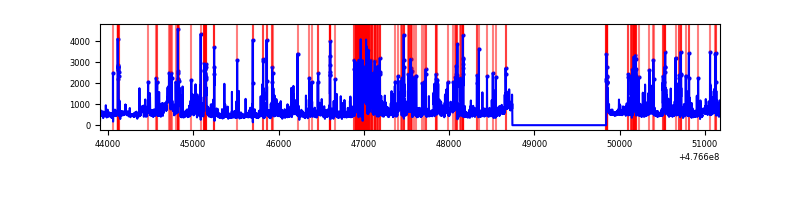 |
| D | 7270 | 6171 | 121 | 121 | 1.66% | 1.96% | 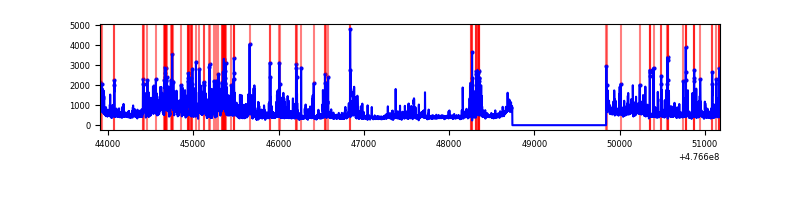 |
Top three noisy pixels from each quadrant. If the there are fewer than three noisy pixels in the level2.evt file, extra rows are filled as -1
| Pixel properties | Quadrant properties | ||||||
|---|---|---|---|---|---|---|---|
| Quadrant | DetID | PixID | Counts | Sigma | Mean | Median | Sigma |
| A | 4 | 249 | 911843 | 5998.56 | 616 | 601 | 151.9 |
| A | 6 | 161 | 630754 | 4148.19 | 616 | 601 | 151.9 |
| A | 3 | 130 | 524803 | 3450.74 | 616 | 601 | 151.9 |
| B | 4 | 170 | 925767 | 6732.72 | 652 | 633 | 137.4 |
| B | 5 | 185 | 170244 | 1234.35 | 652 | 633 | 137.4 |
| B | 4 | 206 | 111326 | 805.58 | 652 | 633 | 137.4 |
| C | 4 | 5 | 452561 | 2590.39 | 637 | 629 | 174.5 |
| C | 13 | 3 | 360559 | 2063.05 | 637 | 629 | 174.5 |
| C | 15 | 174 | 335147 | 1917.39 | 637 | 629 | 174.5 |
| D | 11 | 245 | 340251 | 1940.03 | 640 | 619 | 175.1 |
| D | 15 | 122 | 296041 | 1687.49 | 640 | 619 | 175.1 |
| D | 2 | 249 | 174032 | 990.56 | 640 | 619 | 175.1 |
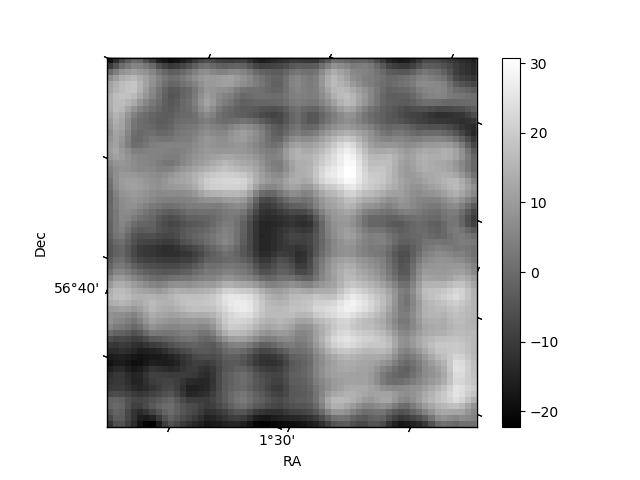
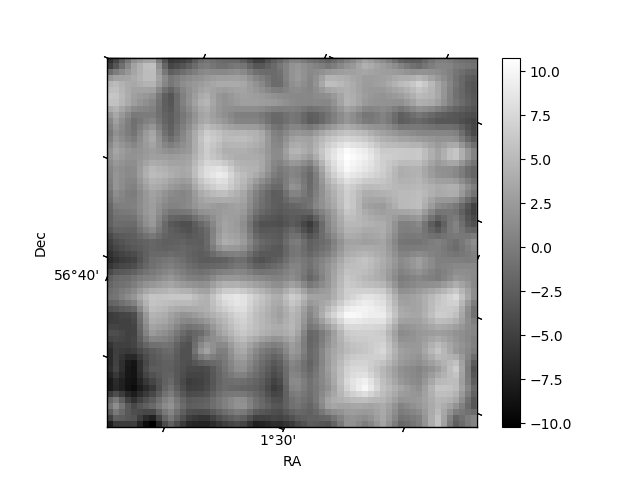
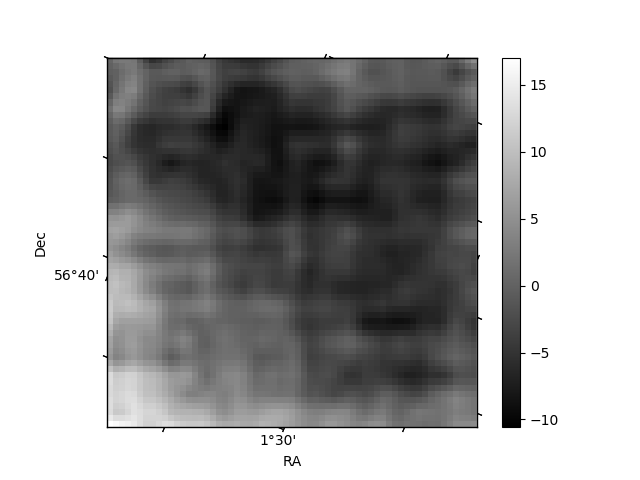
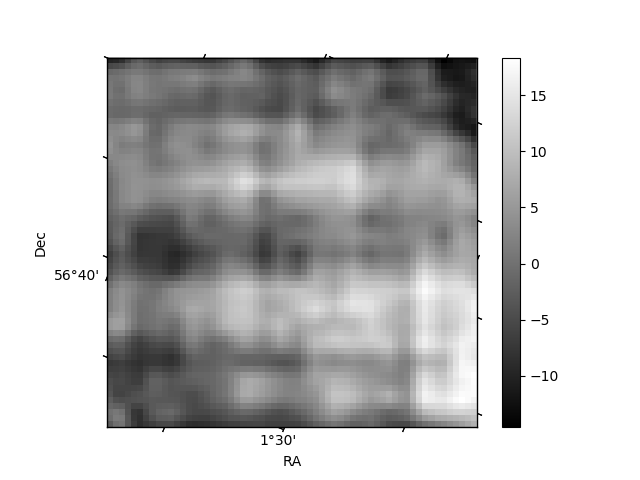
Histogram calculated using DETX and DETY for each event in the final _common_clean file
| Quadrant A | 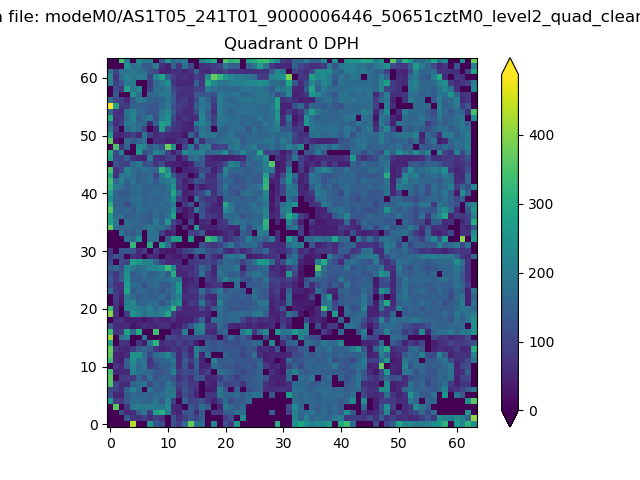 |
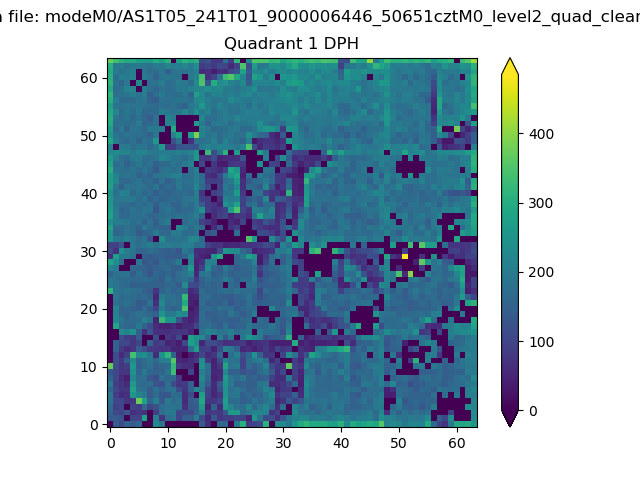 |
Quadrant B |
|---|---|---|---|
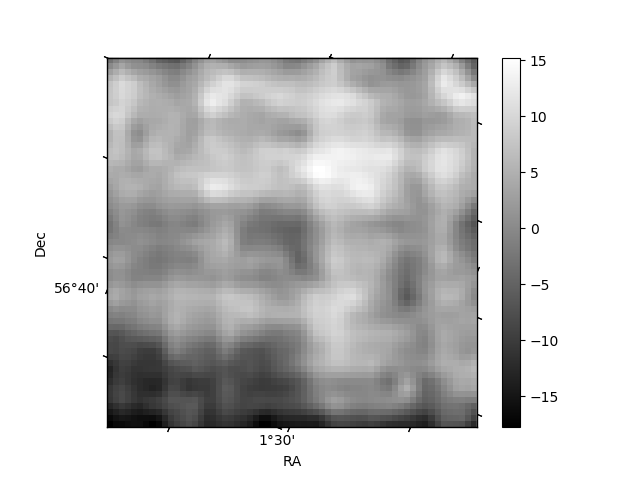
| Quadrant D | 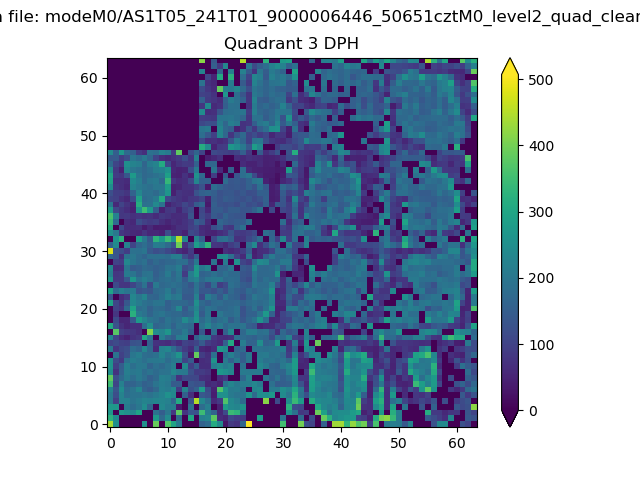 |
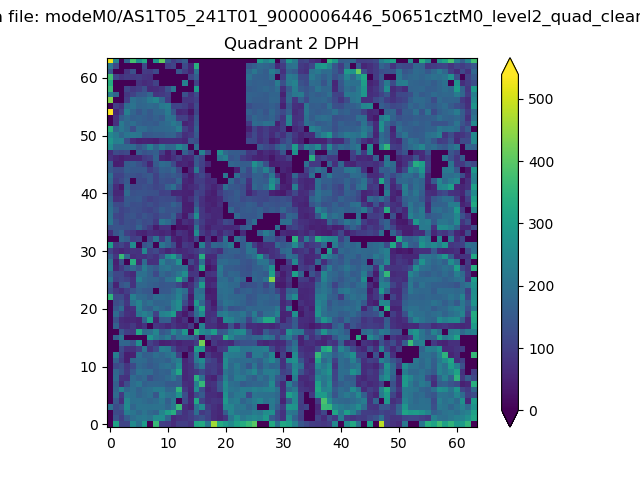 |
Quadrant C |
| Plot type | Count rate plots | Images |
|---|---|---|
| Comparison with Poisson distribution Blue bars denote a histogram of data divided into 1 sec bins. Red curve is a Poisson curve with rate = median count rate of data. |
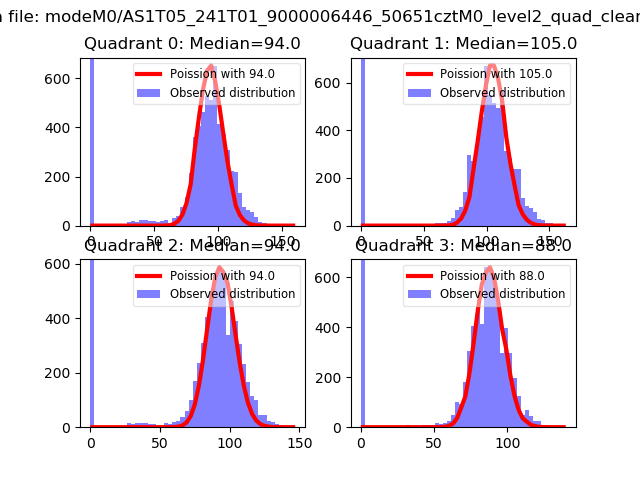 |
 |
| Quadrant-wise count rates Data is divided into 100 sec bins |
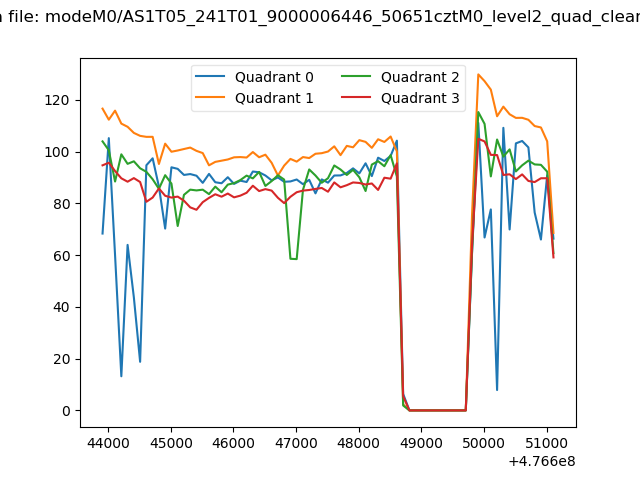 |
|
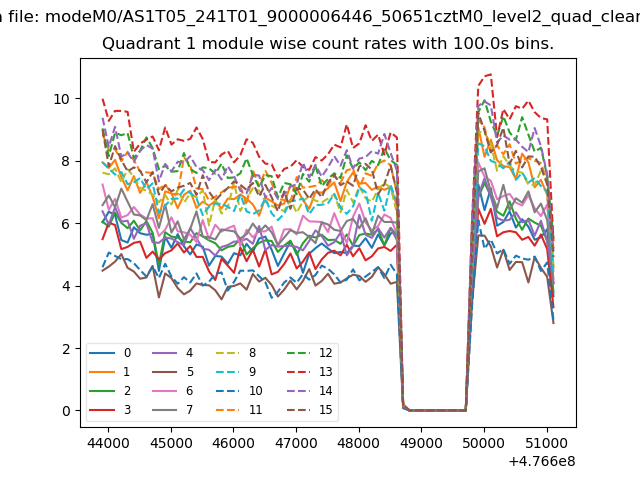
| Module-wise count rates for Quadrant A Data is divided into 100 sec bins |
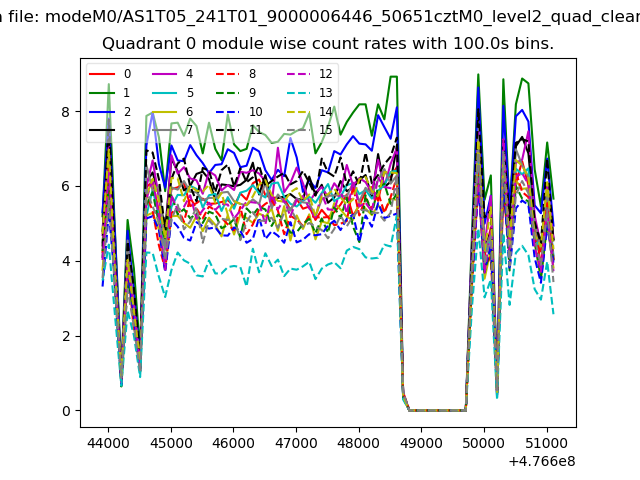 |
 |
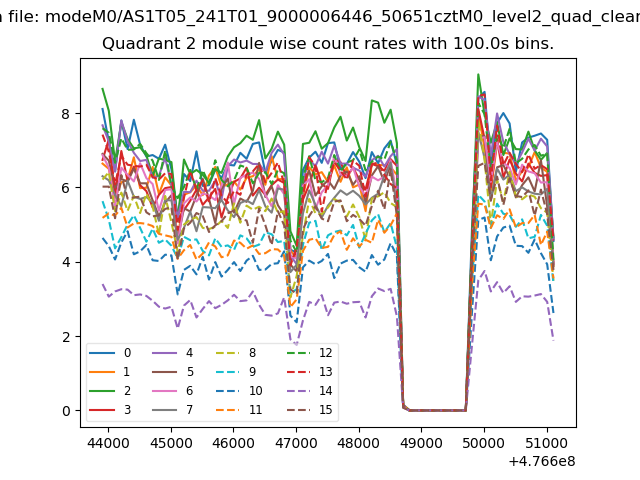
| Module-wise count rates for Quadrant B Data is divided into 100 sec bins |
 |
 |
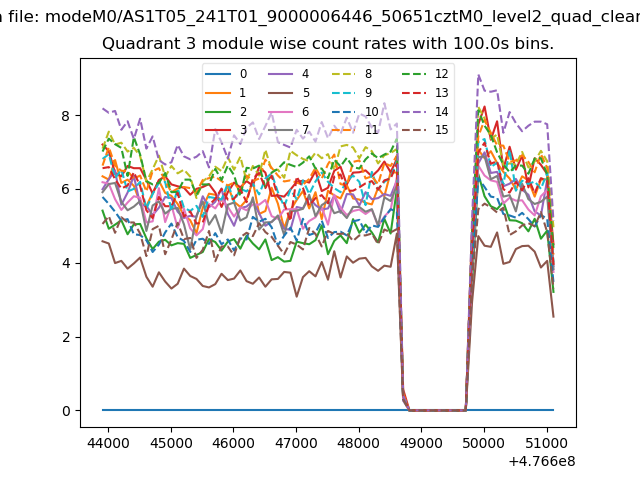
| Module-wise count rates for Quadrant C Data is divided into 100 sec bins |
 |
 |
| Module-wise count rates for Quadrant D Data is divided into 100 sec bins |
 |
 |
| Parameter | Plot |
|---|---|
| CZT HV Monitor | 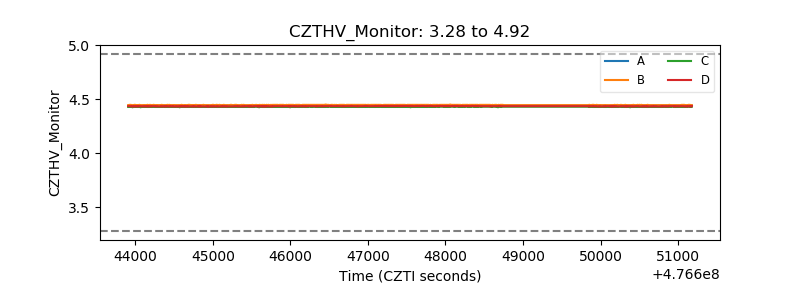 |
| D_VDD | 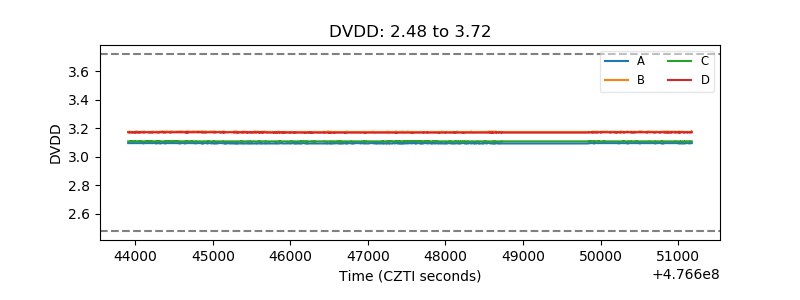 |
| Temperature 1 | 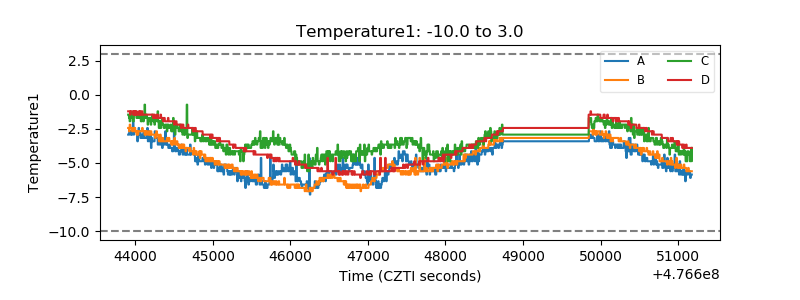 |
| Veto HV Monitor | 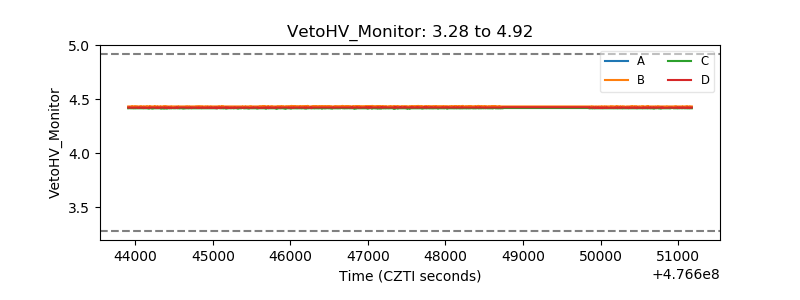 |
| Veto LLD | 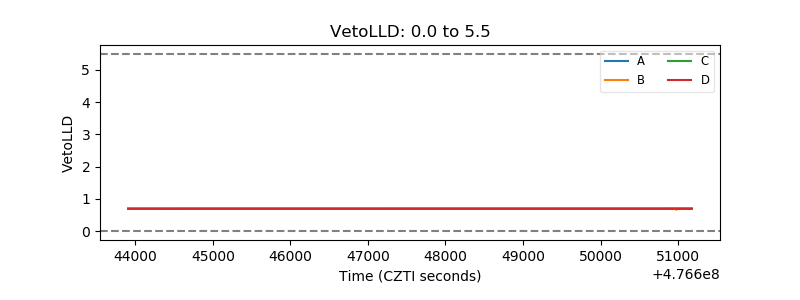 |
| Alpha Counter | 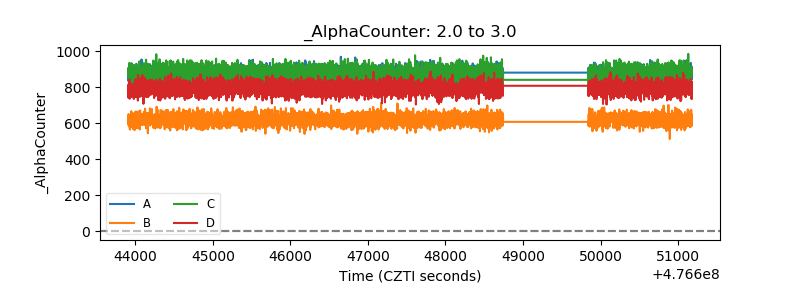 |
| _CPM_Rate | 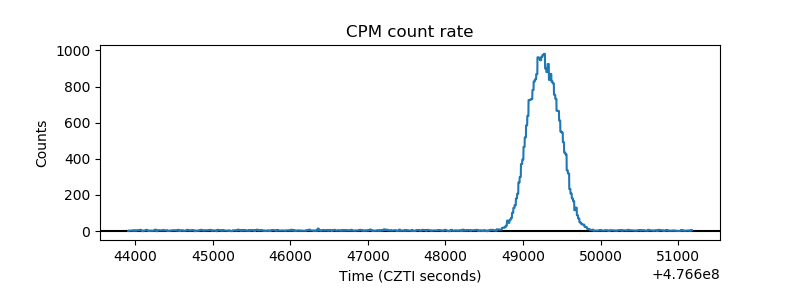 |
| CZT Counter | 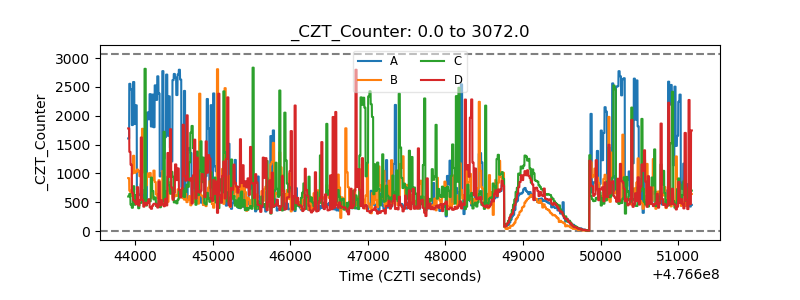 |
| +2.5 Volts monitor | 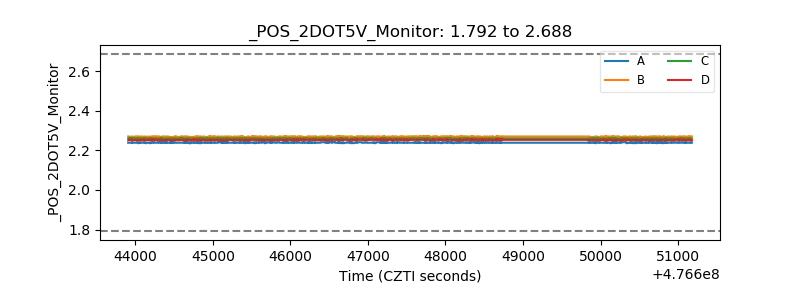 |
| +5 Volts monitor | 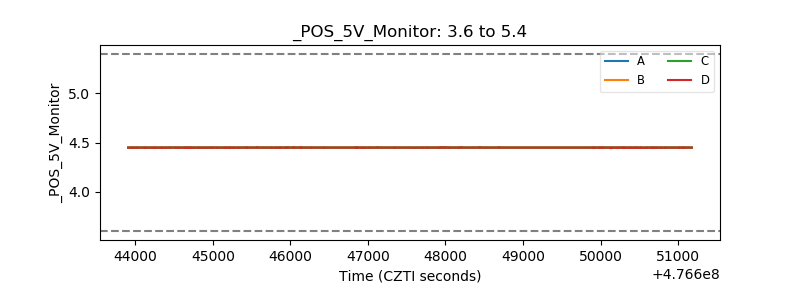 |
| _ROLL_ROT | 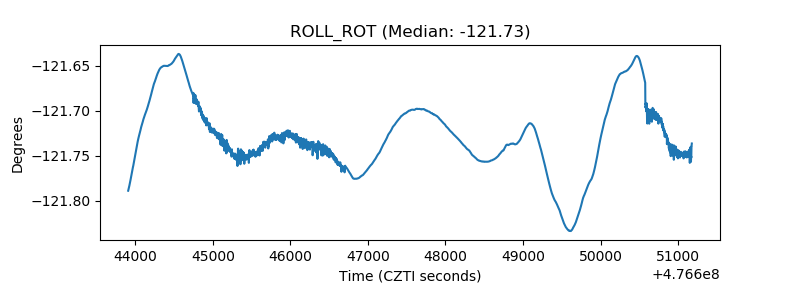 |
| _Roll_DEC | 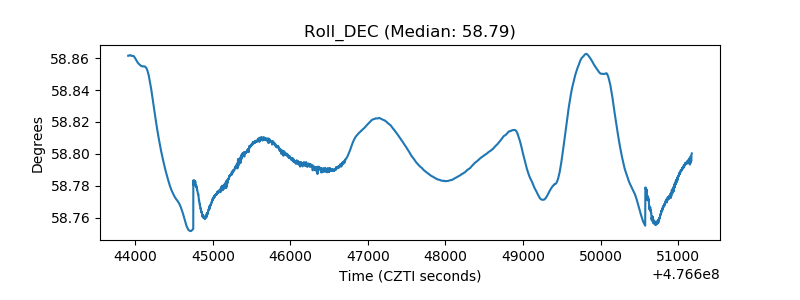 |
| _Roll_RA | 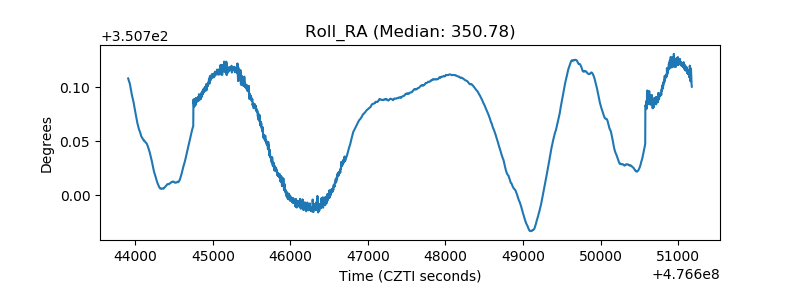 |
| Veto Counter | 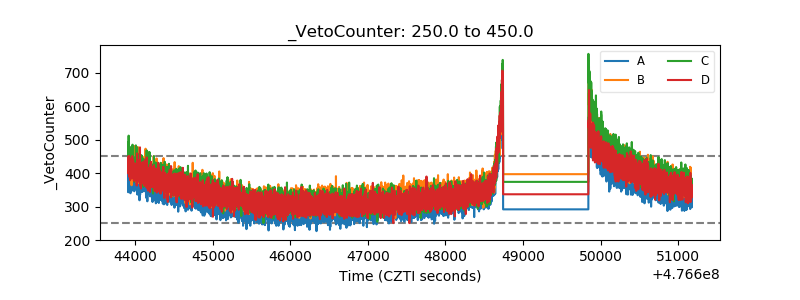 |