| Param | Original file | Final file |
|---|---|---|
| Filename | modeM0/AS1T05_241T01_9000006446_50653cztM0_level2.fits | modeM0/AS1T05_241T01_9000006446_50653cztM0_level2_quad_clean.evt |
| Size (bytes) | 527,624,640 | 92,903,040 |
| Size | 503.2 MB | 88.6 MB |
| Events in quadrant A | 4,710,576 | 605,161 |
| Events in quadrant B | 4,819,319 | 644,915 |
| Events in quadrant C | 5,696,302 | 584,008 |
| Events in quadrant D | 3,822,981 | 545,027 |
| Mode M9 | |||
|---|---|---|---|
| Quadrant | BADHDUFLAG | Total packets | Discarded packets |
| A | 0 | 14 | 0 |
| B | 0 | 15 | 0 |
| C | 0 | 15 | 0 |
| D | 0 | 15 | 0 |
| Mode M0 | |||
|---|---|---|---|
| Quadrant | BADHDUFLAG | Total packets | Discarded packets |
| A | 0 | 18181 | 2 |
| B | 0 | 18735 | 2 |
| C | 0 | 21288 | 3 |
| D | 0 | 15865 | 2 |
| Mode SS | |||
|---|---|---|---|
| Quadrant | BADHDUFLAG | Total packets | Discarded packets |
| A | 0 | 126 | 0 |
| B | 0 | 126 | 0 |
| C | 0 | 126 | 0 |
| D | 0 | 126 | 0 |
| Quadrant | Total seconds | Saturated seconds | Saturation percentage |
|---|---|---|---|
| A | 6219 | 193 | 3.103393% |
| B | 6219 | 439 | 7.059013% |
| C | 6218 | 327 | 5.258926% |
| D | 6218 | 247 | 3.972338% |
Noise dominated data is calculated using 1-second bins in cleaned event files. If a bin has >2000 counts, and if more than 50% of those come from <1% of pixels, then it is considered to be noise-dominated and hence unusable.
| Quadrant | # 1 sec bins | Bins with >0 counts | Bins with >2000 counts | High rate bins dominated by noise | Noise dominated (total time) | Noise dominated (detector-on time) | Marked lightcurve |
|---|---|---|---|---|---|---|---|
| A | 7444 | 6220 | 125 | 125 | 1.68% | 2.01% | 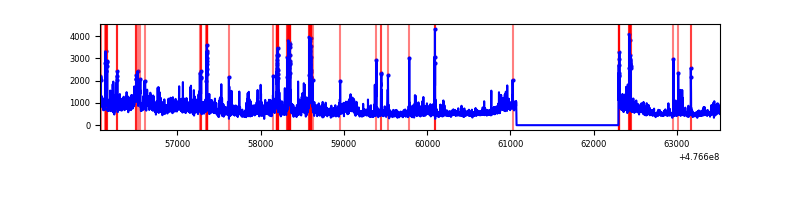 |
| B | 7444 | 6220 | 275 | 275 | 3.69% | 4.42% | 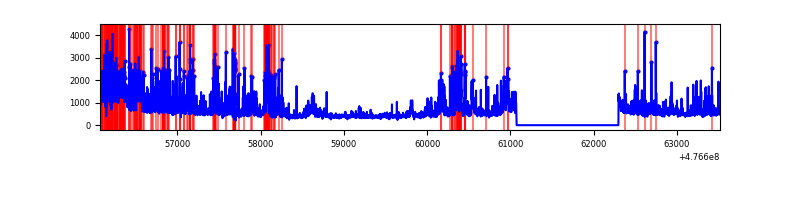 |
| C | 7443 | 6219 | 234 | 234 | 3.14% | 3.76% | 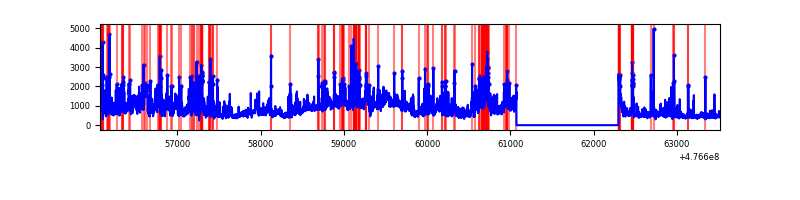 |
| D | 7443 | 6219 | 163 | 163 | 2.19% | 2.62% | 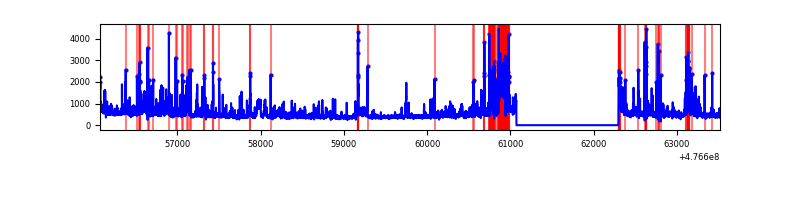 |
Top three noisy pixels from each quadrant. If the there are fewer than three noisy pixels in the level2.evt file, extra rows are filled as -1
| Pixel properties | Quadrant properties | ||||||
|---|---|---|---|---|---|---|---|
| Quadrant | DetID | PixID | Counts | Sigma | Mean | Median | Sigma |
| A | 4 | 4 | 979657 | 5934.16 | 665 | 647 | 165.0 |
| A | 6 | 161 | 271630 | 1642.53 | 665 | 647 | 165.0 |
| A | 4 | 3 | 143294 | 864.64 | 665 | 647 | 165.0 |
| B | 4 | 170 | 996067 | 7101.73 | 660 | 636 | 140.2 |
| B | 3 | 249 | 370023 | 2635.33 | 660 | 636 | 140.2 |
| B | 5 | 172 | 157419 | 1118.54 | 660 | 636 | 140.2 |
| C | 15 | 1 | 1457870 | 7922.47 | 658 | 653 | 183.9 |
| C | 15 | 174 | 421396 | 2287.46 | 658 | 653 | 183.9 |
| C | 13 | 3 | 320588 | 1739.4 | 658 | 653 | 183.9 |
| D | 7 | 110 | 217150 | 1209.62 | 646 | 622 | 179.0 |
| D | 8 | 246 | 159289 | 886.39 | 646 | 622 | 179.0 |
| D | 2 | 249 | 153445 | 853.74 | 646 | 622 | 179.0 |
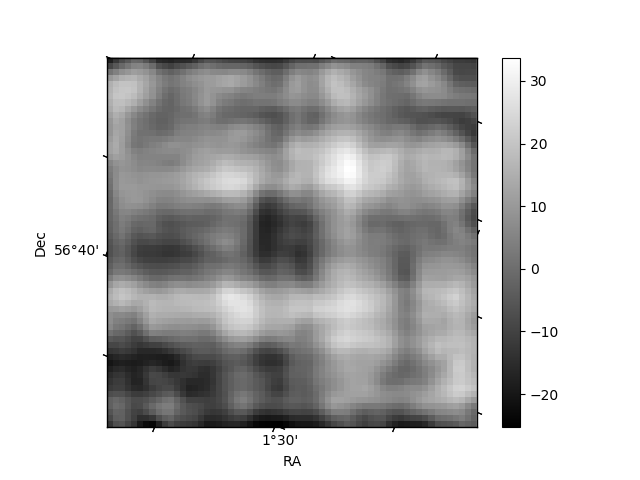
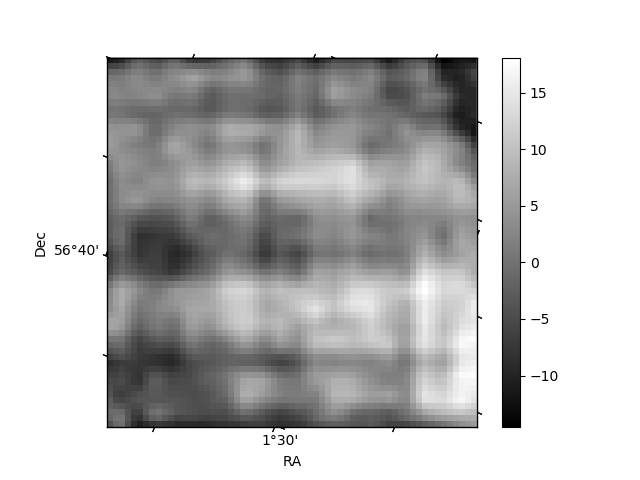
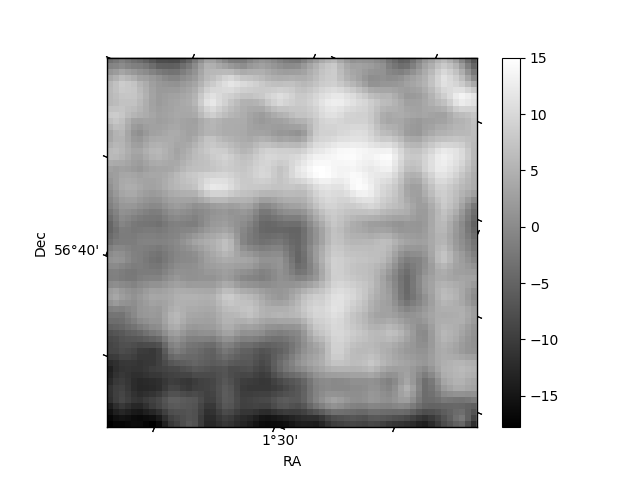
Histogram calculated using DETX and DETY for each event in the final _common_clean file
| Quadrant A | 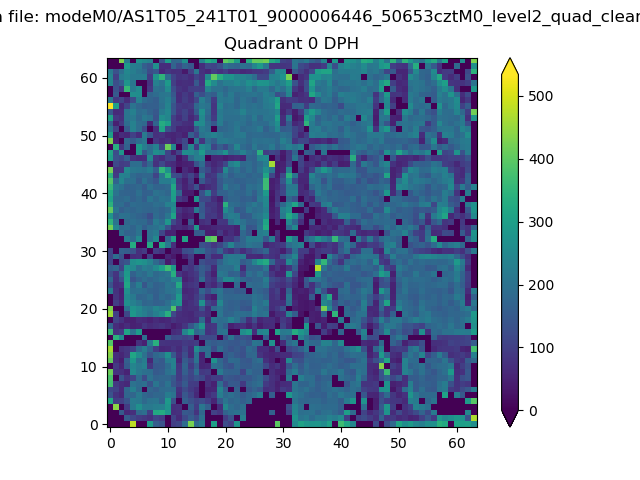 |
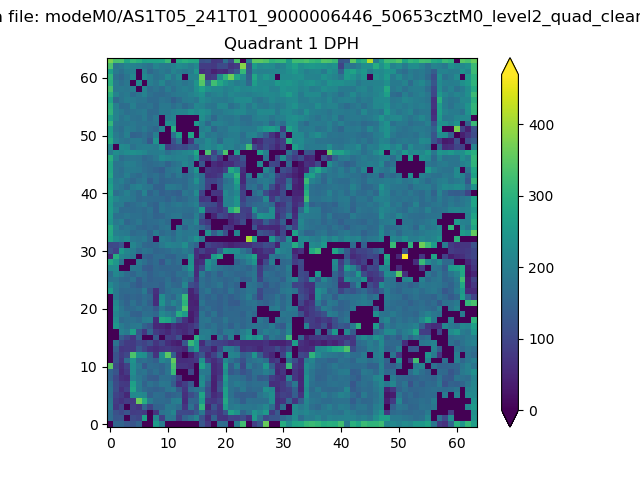 |
Quadrant B |
|---|---|---|---|
| Quadrant D | 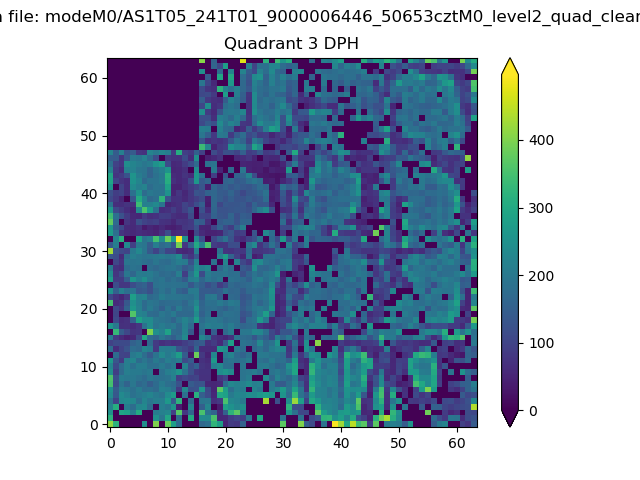 |
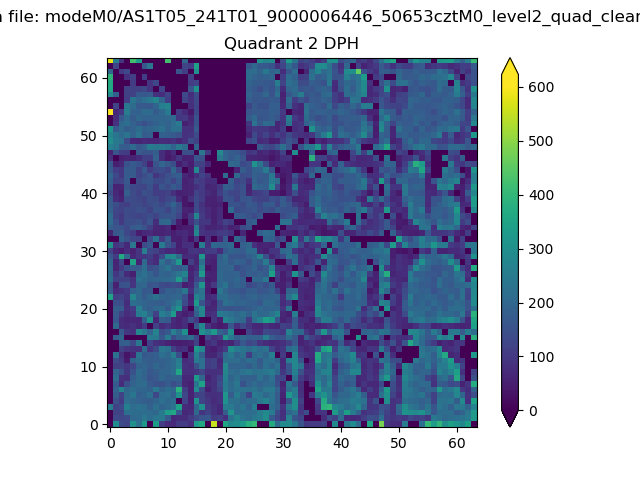 |
Quadrant C |
| Plot type | Count rate plots | Images |
|---|---|---|
| Comparison with Poisson distribution Blue bars denote a histogram of data divided into 1 sec bins. Red curve is a Poisson curve with rate = median count rate of data. |
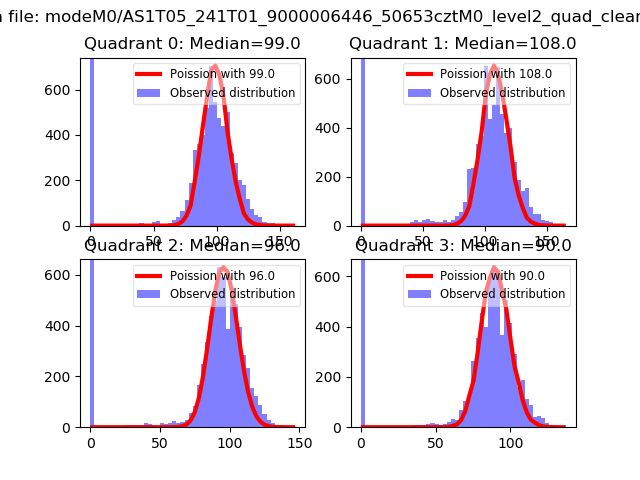 |
 |
| Quadrant-wise count rates Data is divided into 100 sec bins |
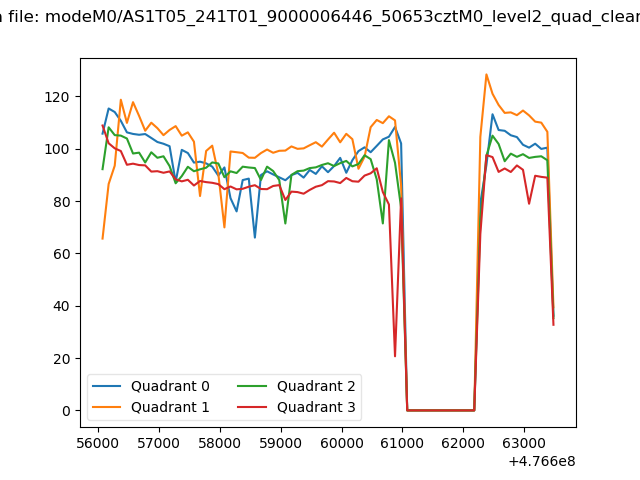 |
|
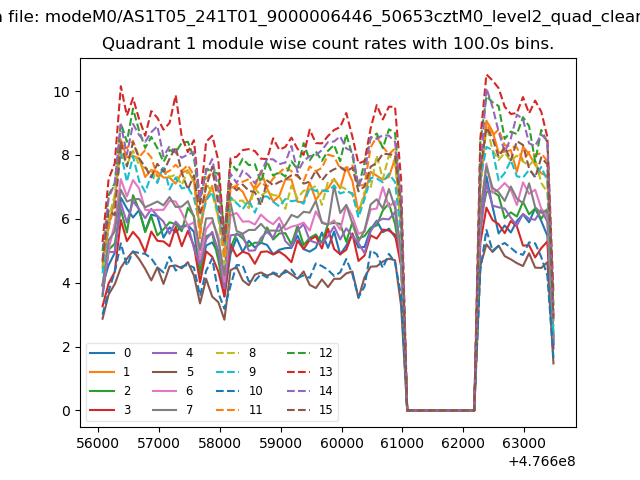
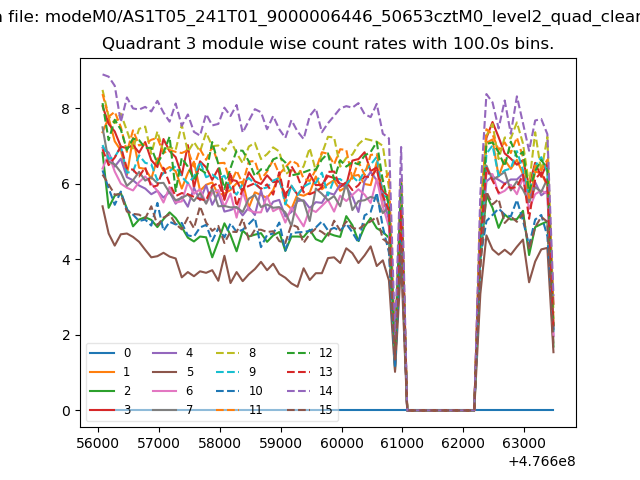
| Module-wise count rates for Quadrant A Data is divided into 100 sec bins |
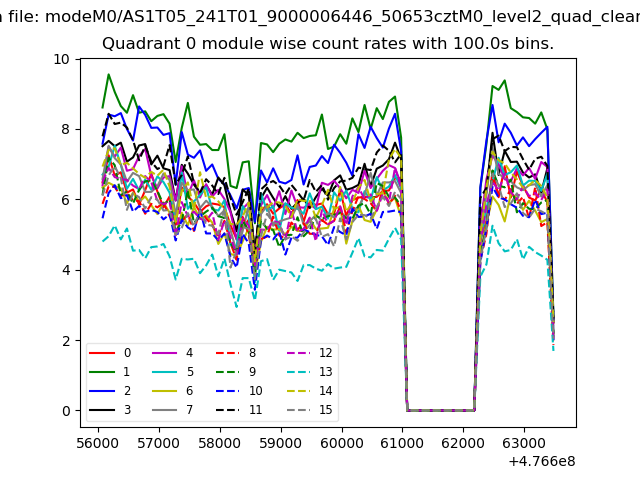 |
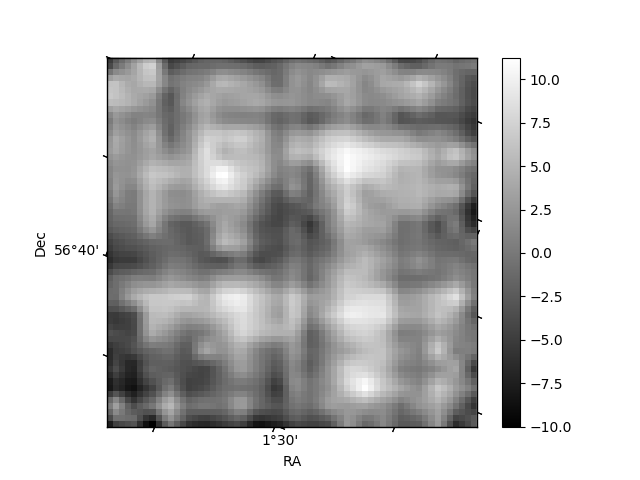 |
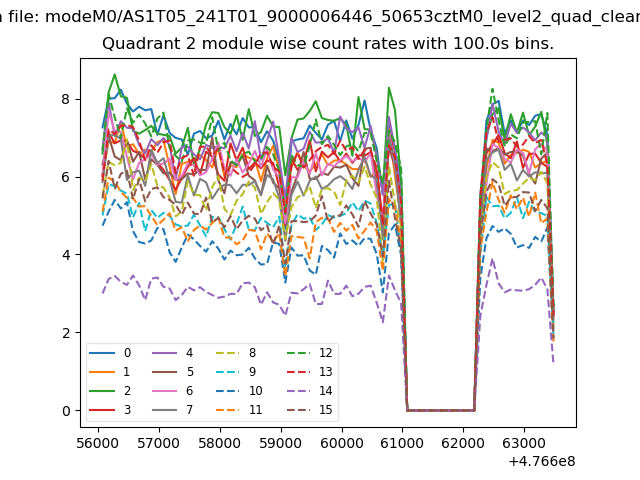
| Module-wise count rates for Quadrant B Data is divided into 100 sec bins |
 |
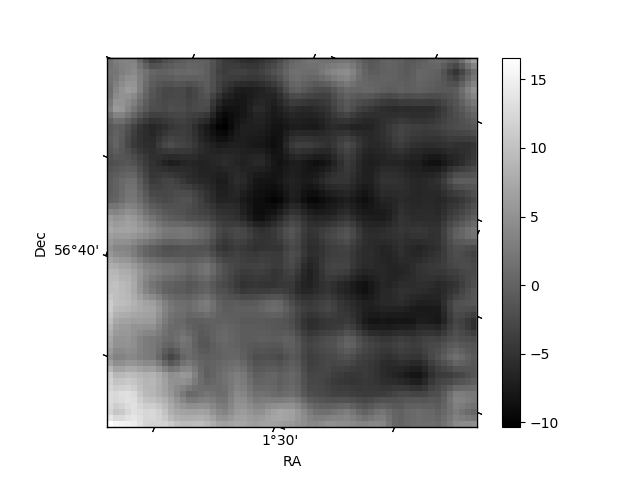 |
| Module-wise count rates for Quadrant C Data is divided into 100 sec bins |
 |
 |
| Module-wise count rates for Quadrant D Data is divided into 100 sec bins |
 |
 |
| Parameter | Plot |
|---|---|
| CZT HV Monitor | 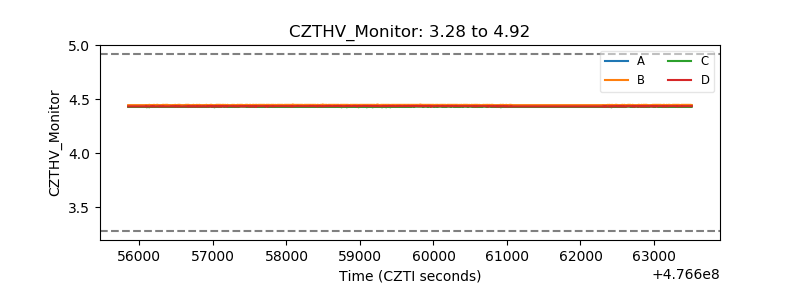 |
| D_VDD | 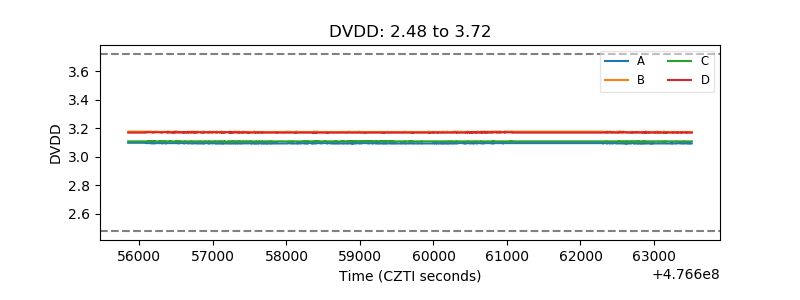 |
| Temperature 1 | 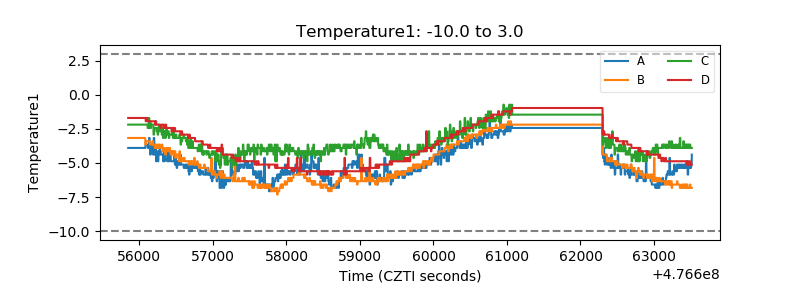 |
| Veto HV Monitor | 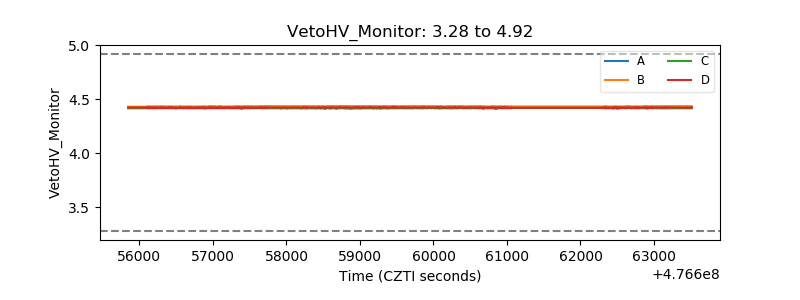 |
| Veto LLD | 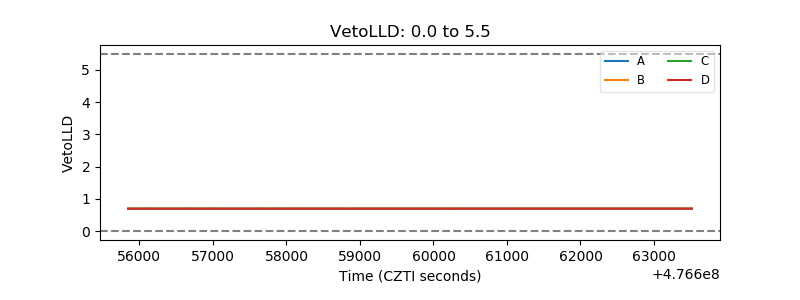 |
| Alpha Counter | 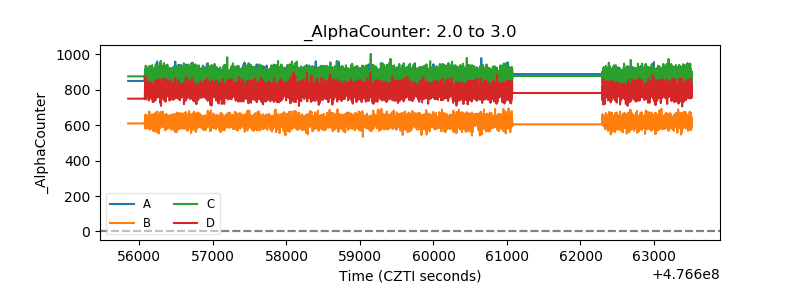 |
| _CPM_Rate | 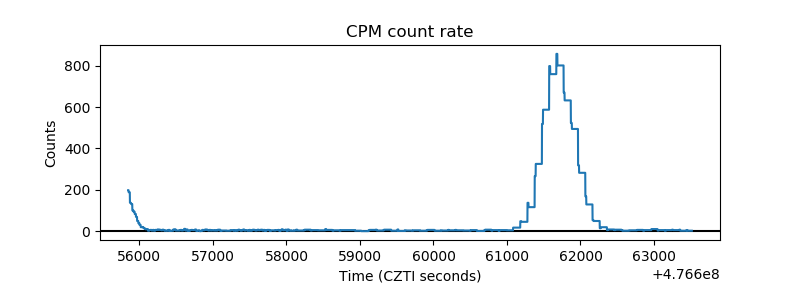 |
| CZT Counter | 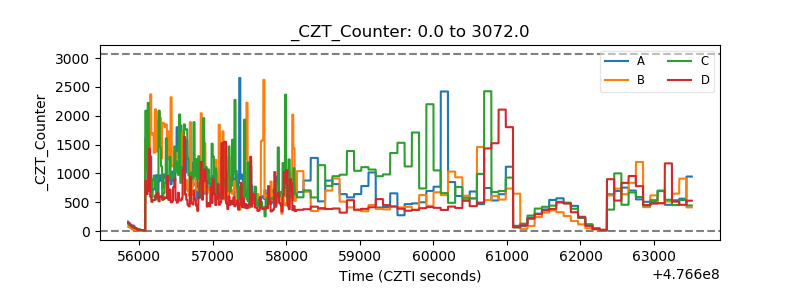 |
| +2.5 Volts monitor |  |
| +5 Volts monitor | 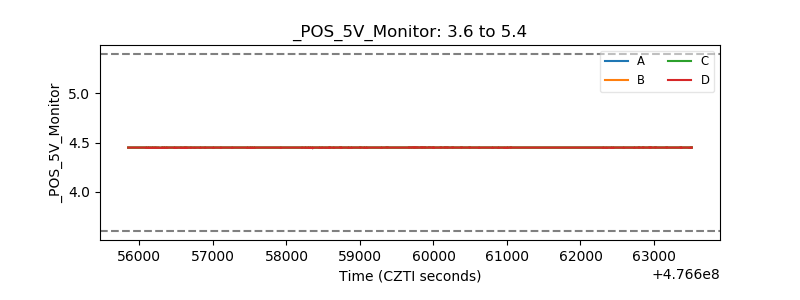 |
| _ROLL_ROT | 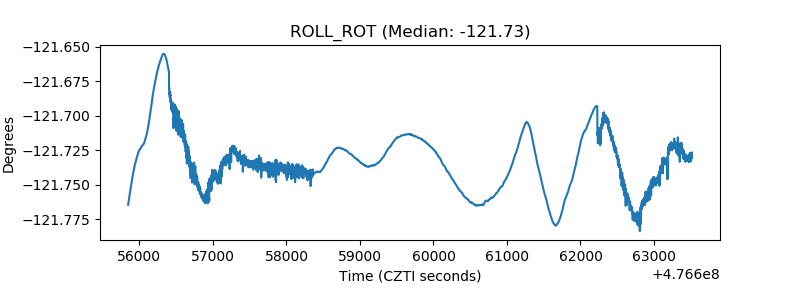 |
| _Roll_DEC | 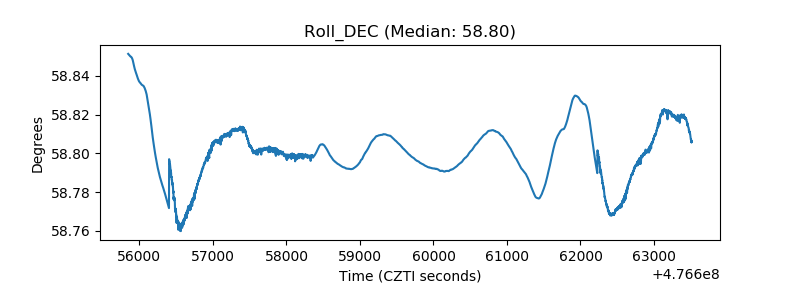 |
| _Roll_RA | 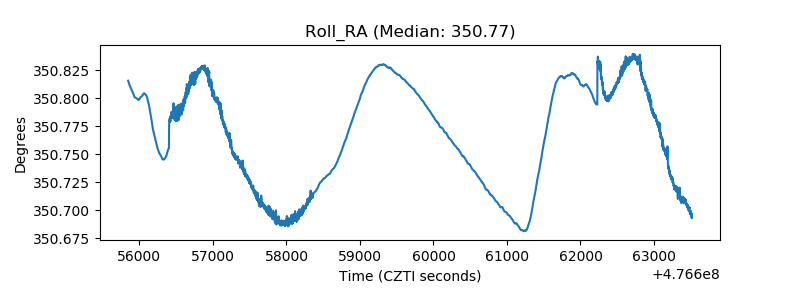 |
| Veto Counter | 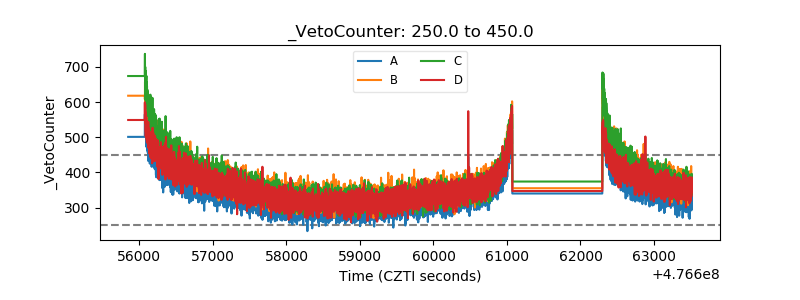 |