| Param | Original file | Final file |
|---|---|---|
| Filename | modeM0/AS1T05_241T01_9000006446_50654cztM0_level2.fits | modeM0/AS1T05_241T01_9000006446_50654cztM0_level2_quad_clean.evt |
| Size (bytes) | 547,344,000 | 97,585,920 |
| Size | 522.0 MB | 93.1 MB |
| Events in quadrant A | 4,654,913 | 636,687 |
| Events in quadrant B | 4,444,552 | 694,263 |
| Events in quadrant C | 5,972,900 | 592,389 |
| Events in quadrant D | 4,673,704 | 568,481 |
| Mode M9 | |||
|---|---|---|---|
| Quadrant | BADHDUFLAG | Total packets | Discarded packets |
| A | 0 | 18 | 0 |
| B | 0 | 19 | 0 |
| C | 0 | 19 | 0 |
| D | 0 | 19 | 0 |
| Mode M0 | |||
|---|---|---|---|
| Quadrant | BADHDUFLAG | Total packets | Discarded packets |
| A | 0 | 18409 | 2 |
| B | 0 | 17943 | 2 |
| C | 0 | 22370 | 2 |
| D | 0 | 18811 | 2 |
| Mode SS | |||
|---|---|---|---|
| Quadrant | BADHDUFLAG | Total packets | Discarded packets |
| A | 0 | 134 | 0 |
| B | 0 | 134 | 0 |
| C | 0 | 134 | 0 |
| D | 0 | 134 | 0 |
| Quadrant | Total seconds | Saturated seconds | Saturation percentage |
|---|---|---|---|
| A | 6644 | 180 | 2.709211% |
| B | 6644 | 218 | 3.281156% |
| C | 6644 | 604 | 9.090909% |
| D | 6644 | 389 | 5.854907% |
Noise dominated data is calculated using 1-second bins in cleaned event files. If a bin has >2000 counts, and if more than 50% of those come from <1% of pixels, then it is considered to be noise-dominated and hence unusable.
| Quadrant | # 1 sec bins | Bins with >0 counts | Bins with >2000 counts | High rate bins dominated by noise | Noise dominated (total time) | Noise dominated (detector-on time) | Marked lightcurve |
|---|---|---|---|---|---|---|---|
| A | 7819 | 6645 | 109 | 109 | 1.39% | 1.64% | 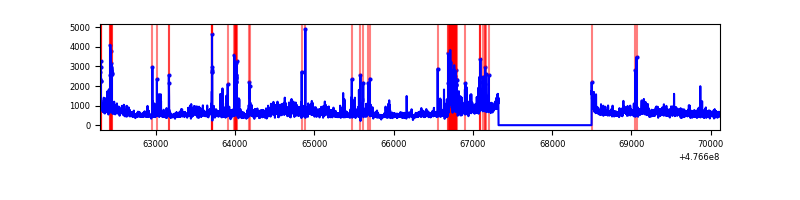 |
| B | 7819 | 6645 | 101 | 101 | 1.29% | 1.52% | 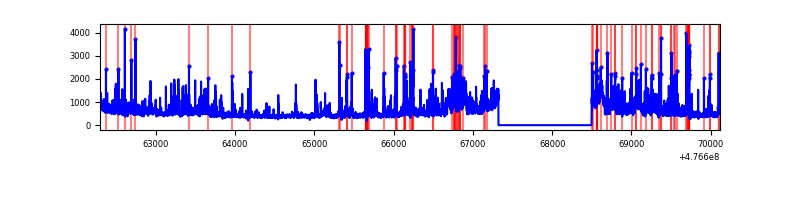 |
| C | 7819 | 6645 | 434 | 434 | 5.55% | 6.53% | 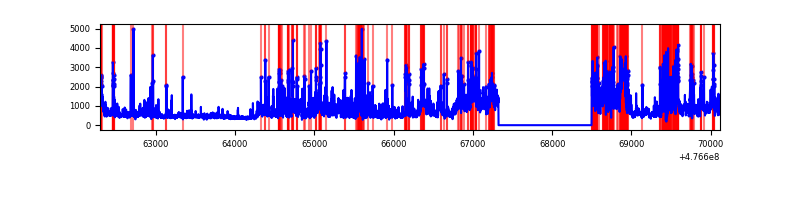 |
| D | 7819 | 6645 | 324 | 324 | 4.14% | 4.88% | 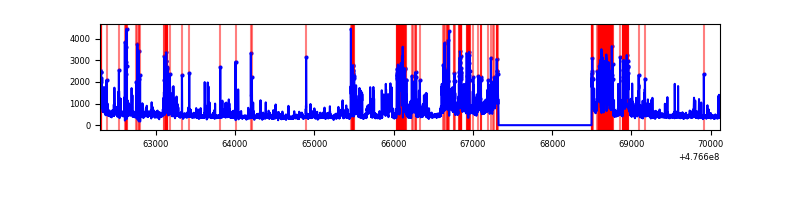 |
Top three noisy pixels from each quadrant. If the there are fewer than three noisy pixels in the level2.evt file, extra rows are filled as -1
| Pixel properties | Quadrant properties | ||||||
|---|---|---|---|---|---|---|---|
| Quadrant | DetID | PixID | Counts | Sigma | Mean | Median | Sigma |
| A | 4 | 4 | 989486 | 5684.2 | 703 | 685 | 174.0 |
| A | 3 | 130 | 235102 | 1347.56 | 703 | 685 | 174.0 |
| A | 4 | 3 | 178992 | 1025.01 | 703 | 685 | 174.0 |
| B | 3 | 249 | 329597 | 2201.0 | 705 | 681 | 149.4 |
| B | 4 | 206 | 214477 | 1430.66 | 705 | 681 | 149.4 |
| B | 8 | 128 | 153504 | 1022.64 | 705 | 681 | 149.4 |
| C | 4 | 5 | 1019187 | 5362.75 | 679 | 671 | 189.9 |
| C | 15 | 1 | 645800 | 3396.77 | 679 | 671 | 189.9 |
| C | 13 | 3 | 459199 | 2414.27 | 679 | 671 | 189.9 |
| D | 13 | 84 | 821462 | 4341.16 | 676 | 650 | 189.1 |
| D | 7 | 110 | 178131 | 938.67 | 676 | 650 | 189.1 |
| D | 2 | 249 | 127730 | 672.11 | 676 | 650 | 189.1 |
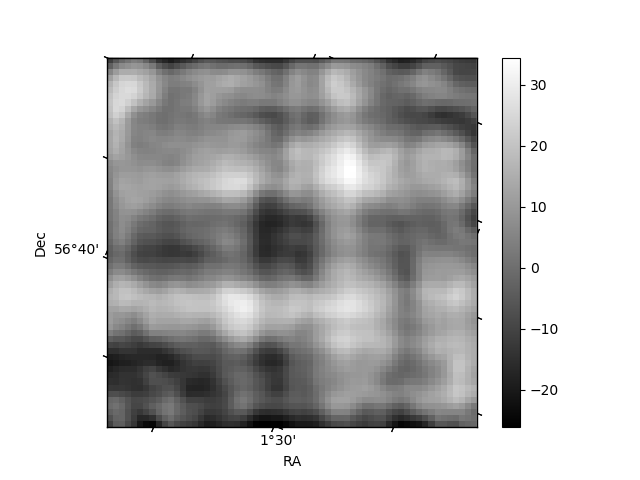
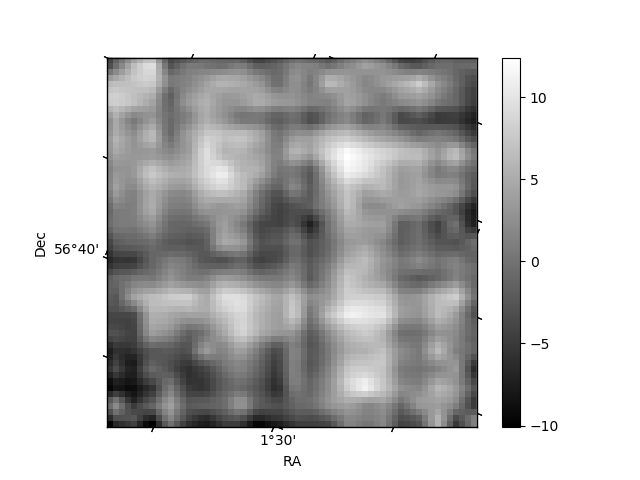
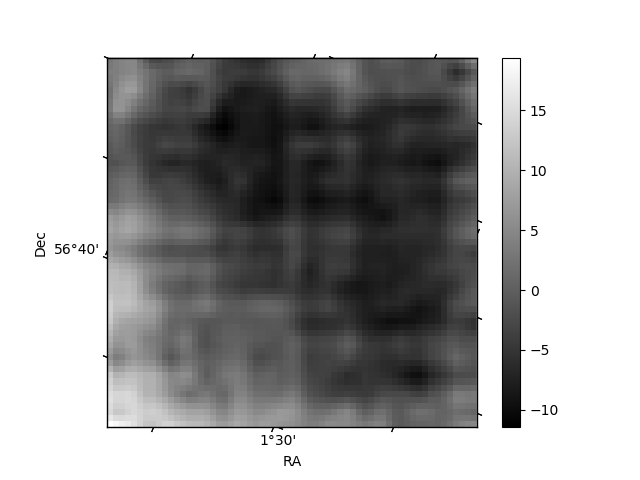
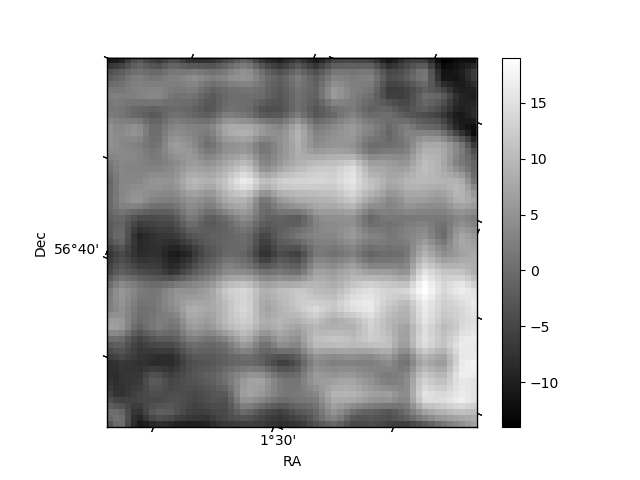
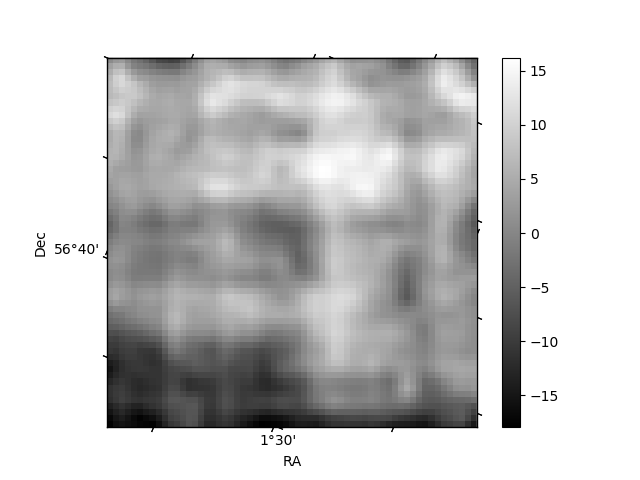
Histogram calculated using DETX and DETY for each event in the final _common_clean file
| Quadrant A |  |
 |
Quadrant B |
|---|---|---|---|
| Quadrant D |  |
 |
Quadrant C |
| Plot type | Count rate plots | Images |
|---|---|---|
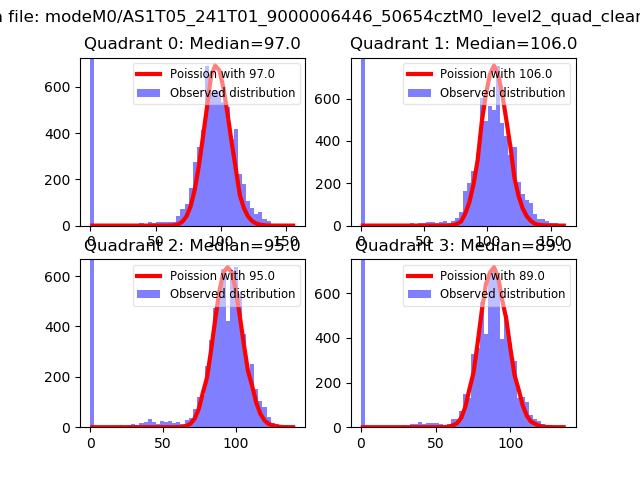
| Comparison with Poisson distribution Blue bars denote a histogram of data divided into 1 sec bins. Red curve is a Poisson curve with rate = median count rate of data. |
 |
 |
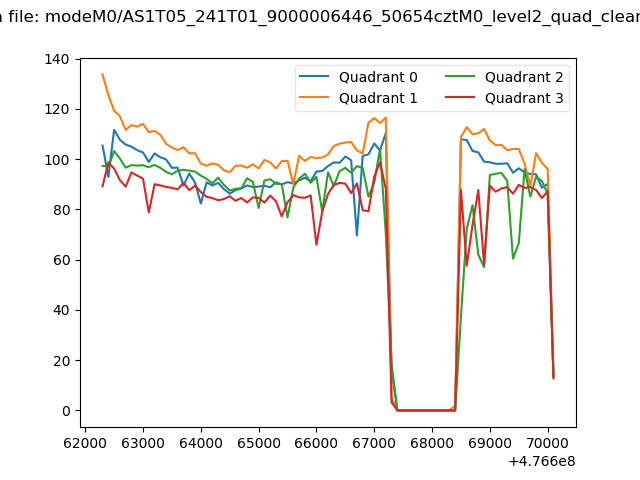
| Quadrant-wise count rates Data is divided into 100 sec bins |
 |
|
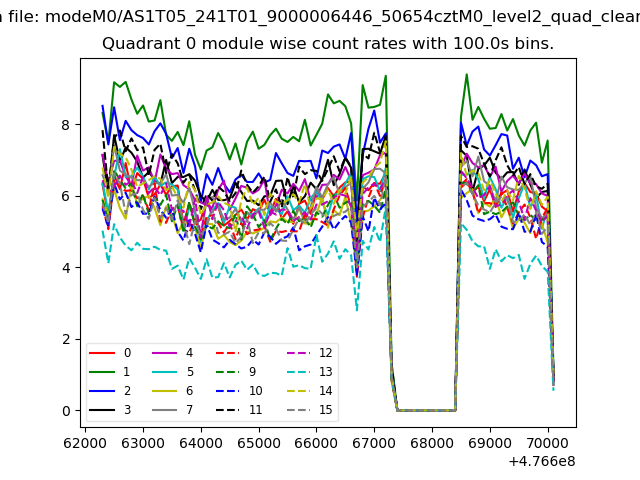
| Module-wise count rates for Quadrant A Data is divided into 100 sec bins |
 |
 |
| Module-wise count rates for Quadrant B Data is divided into 100 sec bins |
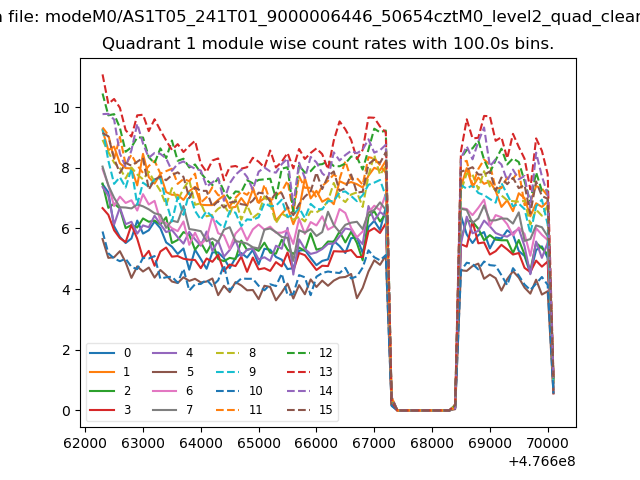 |
 |
| Module-wise count rates for Quadrant C Data is divided into 100 sec bins |
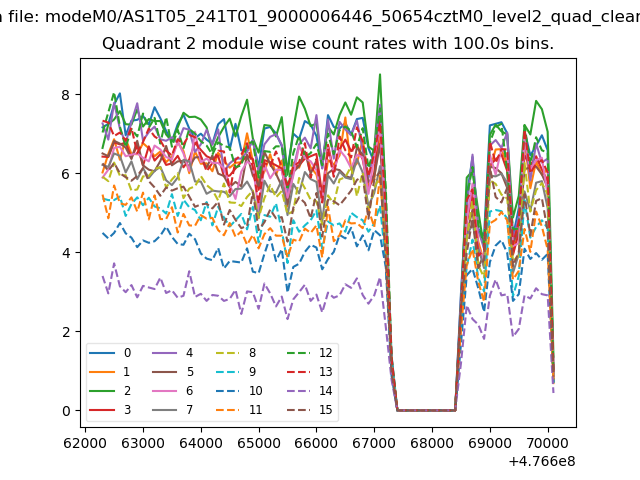 |
 |
| Module-wise count rates for Quadrant D Data is divided into 100 sec bins |
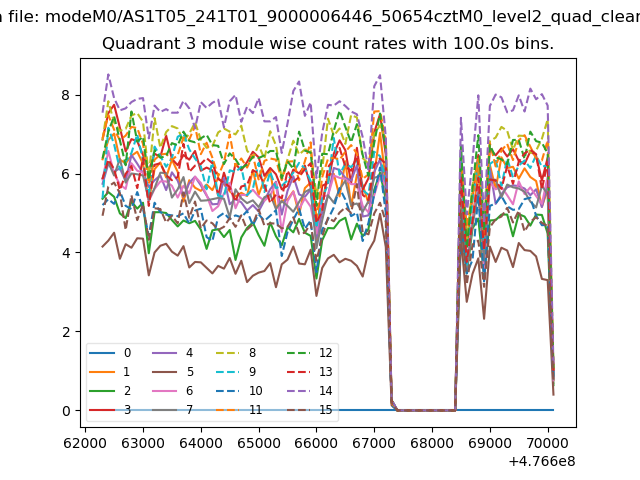 |
 |
| Parameter | Plot |
|---|---|
| CZT HV Monitor | 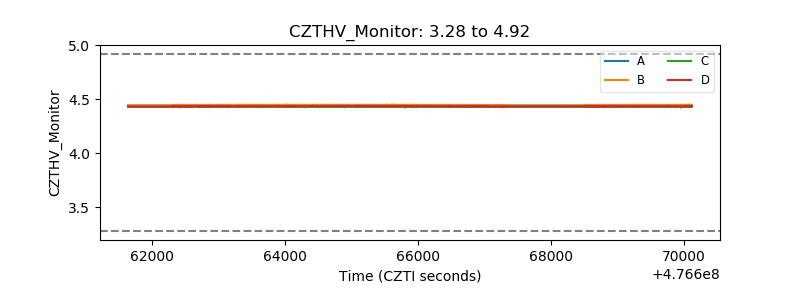 |
| D_VDD | 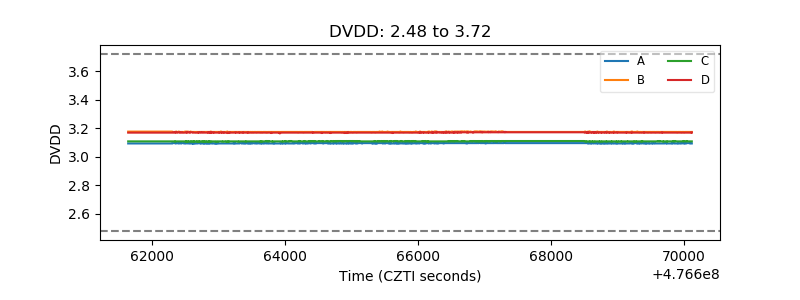 |
| Temperature 1 | 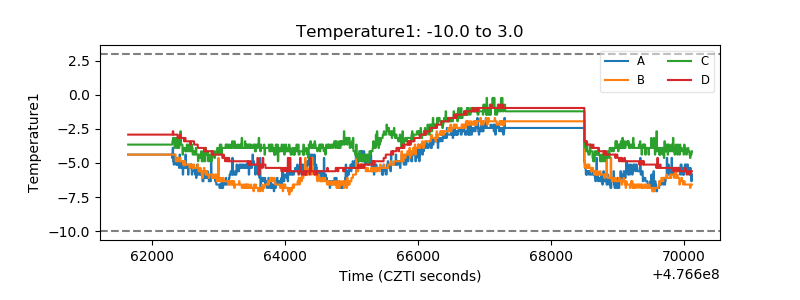 |
| Veto HV Monitor |  |
| Veto LLD | 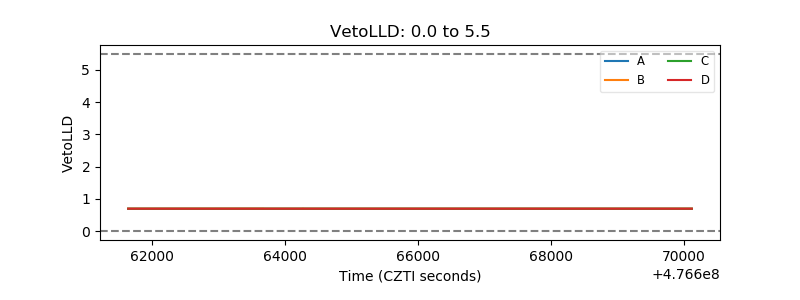 |
| Alpha Counter | 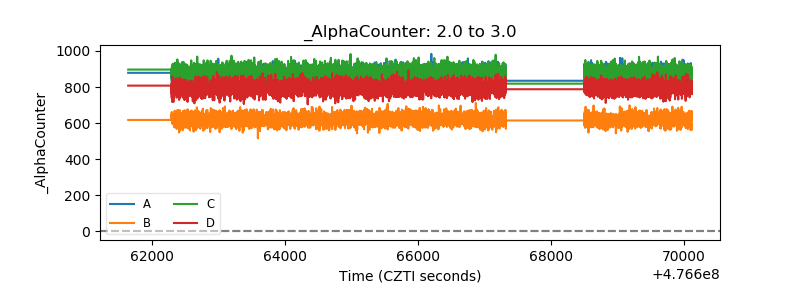 |
| _CPM_Rate | 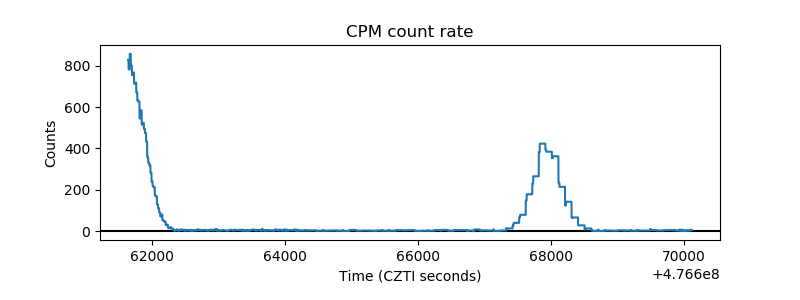 |
| CZT Counter |  |
| +2.5 Volts monitor |  |
| +5 Volts monitor |  |
| _ROLL_ROT | 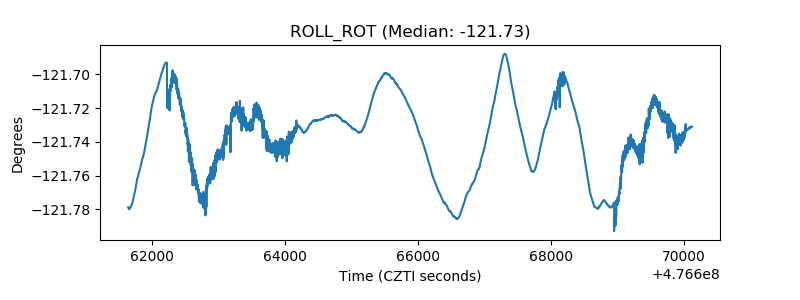 |
| _Roll_DEC | 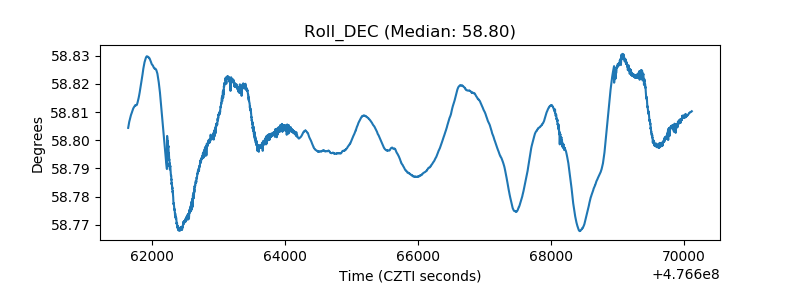 |
| _Roll_RA | 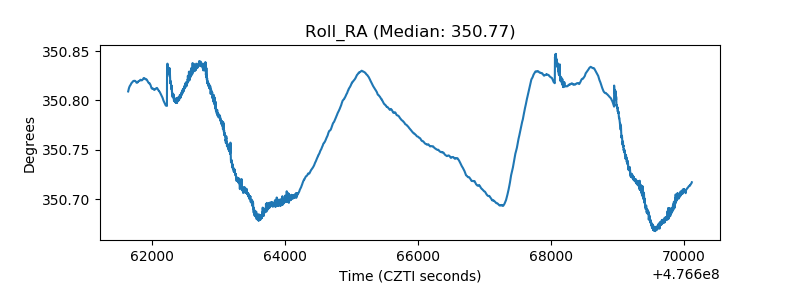 |
| Veto Counter | 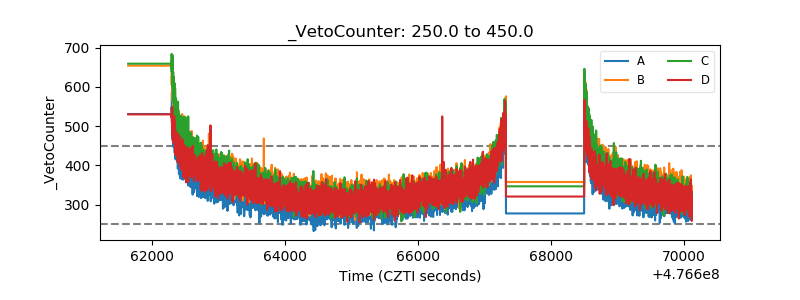 |