| Param | Original file | Final file |
|---|---|---|
| Filename | modeM0/AS1T05_241T01_9000006446_50655cztM0_level2.fits | modeM0/AS1T05_241T01_9000006446_50655cztM0_level2_quad_clean.evt |
| Size (bytes) | 656,095,680 | 96,183,360 |
| Size | 625.7 MB | 91.7 MB |
| Events in quadrant A | 5,352,238 | 622,022 |
| Events in quadrant B | 5,048,478 | 693,504 |
| Events in quadrant C | 8,655,745 | 535,723 |
| Events in quadrant D | 4,692,800 | 577,202 |
| Mode M9 | |||
|---|---|---|---|
| Quadrant | BADHDUFLAG | Total packets | Discarded packets |
| A | 0 | 17 | 0 |
| B | 0 | 17 | 0 |
| C | 0 | 17 | 0 |
| D | 0 | 18 | 0 |
| Mode M0 | |||
|---|---|---|---|
| Quadrant | BADHDUFLAG | Total packets | Discarded packets |
| A | 0 | 20797 | 2 |
| B | 0 | 20034 | 2 |
| C | 0 | 30539 | 2 |
| D | 0 | 19207 | 3 |
| Mode SS | |||
|---|---|---|---|
| Quadrant | BADHDUFLAG | Total packets | Discarded packets |
| A | 0 | 142 | 0 |
| B | 0 | 142 | 0 |
| C | 0 | 142 | 0 |
| D | 0 | 142 | 0 |
| Quadrant | Total seconds | Saturated seconds | Saturation percentage |
|---|---|---|---|
| A | 6941 | 437 | 6.295923% |
| B | 6941 | 342 | 4.927244% |
| C | 6941 | 1456 | 20.976804% |
| D | 6940 | 405 | 5.835735% |
Noise dominated data is calculated using 1-second bins in cleaned event files. If a bin has >2000 counts, and if more than 50% of those come from <1% of pixels, then it is considered to be noise-dominated and hence unusable.
| Quadrant | # 1 sec bins | Bins with >0 counts | Bins with >2000 counts | High rate bins dominated by noise | Noise dominated (total time) | Noise dominated (detector-on time) | Marked lightcurve |
|---|---|---|---|---|---|---|---|
| A | 7891 | 6942 | 257 | 257 | 3.26% | 3.70% | 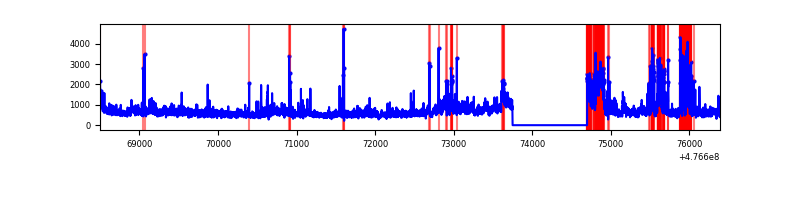 |
| B | 7891 | 6942 | 125 | 125 | 1.58% | 1.80% | 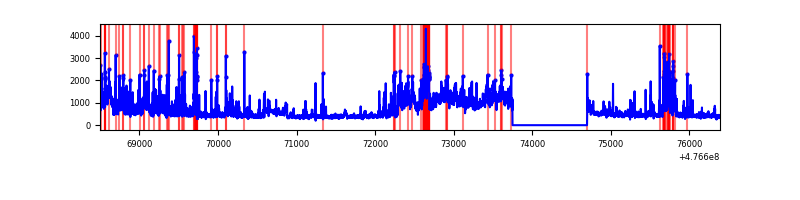 |
| C | 7891 | 6942 | 1116 | 1116 | 14.14% | 16.08% | 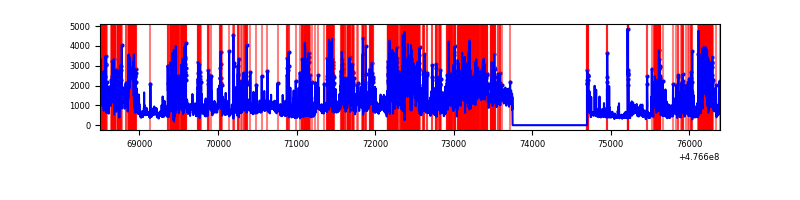 |
| D | 7890 | 6941 | 292 | 292 | 3.70% | 4.21% | 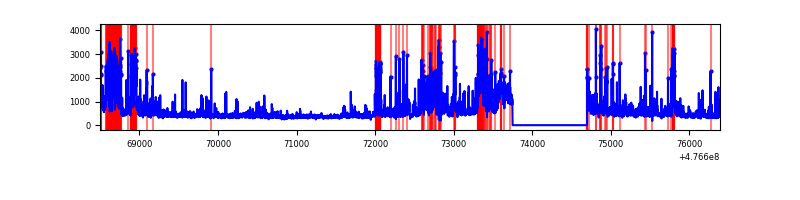 |
Top three noisy pixels from each quadrant. If the there are fewer than three noisy pixels in the level2.evt file, extra rows are filled as -1
| Pixel properties | Quadrant properties | ||||||
|---|---|---|---|---|---|---|---|
| Quadrant | DetID | PixID | Counts | Sigma | Mean | Median | Sigma |
| A | 4 | 4 | 1034710 | 5763.99 | 724 | 705 | 179.4 |
| A | 12 | 80 | 295928 | 1645.7 | 724 | 705 | 179.4 |
| A | 8 | 38 | 240585 | 1337.19 | 724 | 705 | 179.4 |
| B | 5 | 172 | 1033429 | 6704.8 | 726 | 702 | 154.0 |
| B | 10 | 247 | 195660 | 1265.73 | 726 | 702 | 154.0 |
| B | 5 | 185 | 144517 | 933.69 | 726 | 702 | 154.0 |
| C | 4 | 5 | 2908017 | 15870.76 | 666 | 660 | 183.2 |
| C | 15 | 1 | 1074362 | 5861.15 | 666 | 660 | 183.2 |
| C | 15 | 127 | 507536 | 2766.95 | 666 | 660 | 183.2 |
| D | 13 | 84 | 404319 | 2079.61 | 701 | 677 | 194.1 |
| D | 7 | 110 | 220385 | 1131.96 | 701 | 677 | 194.1 |
| D | 2 | 249 | 153790 | 788.86 | 701 | 677 | 194.1 |
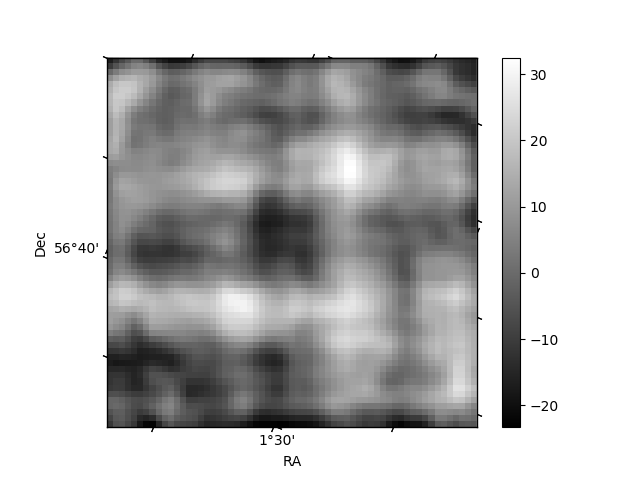
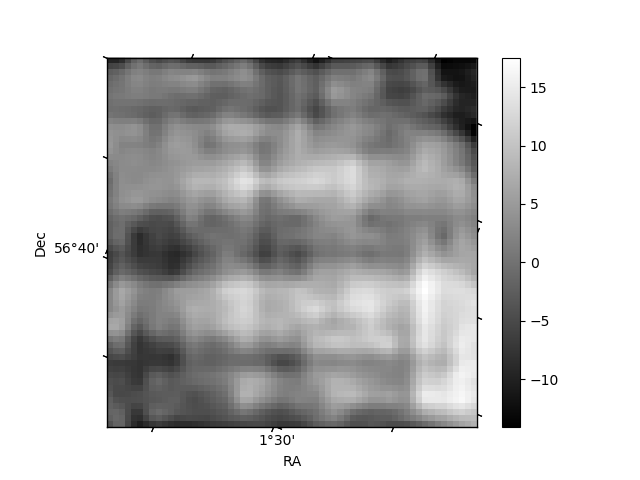
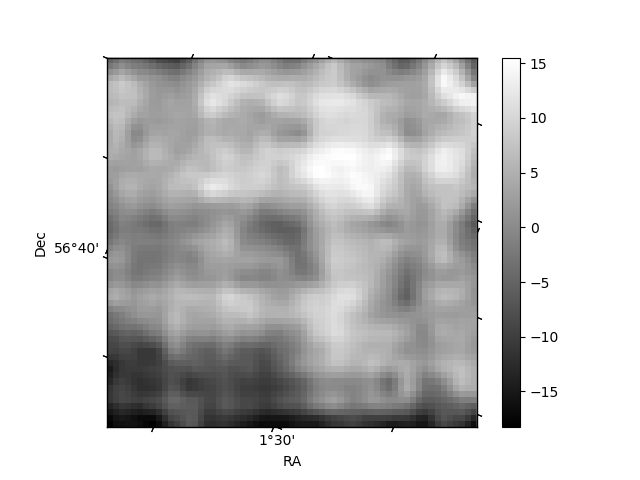
Histogram calculated using DETX and DETY for each event in the final _common_clean file
| Quadrant A | 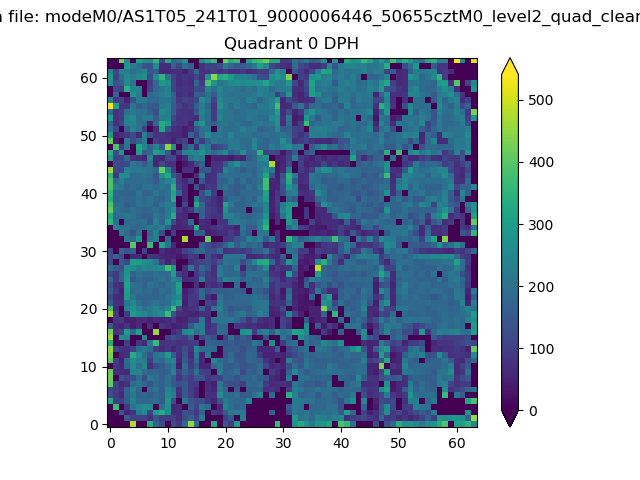 |
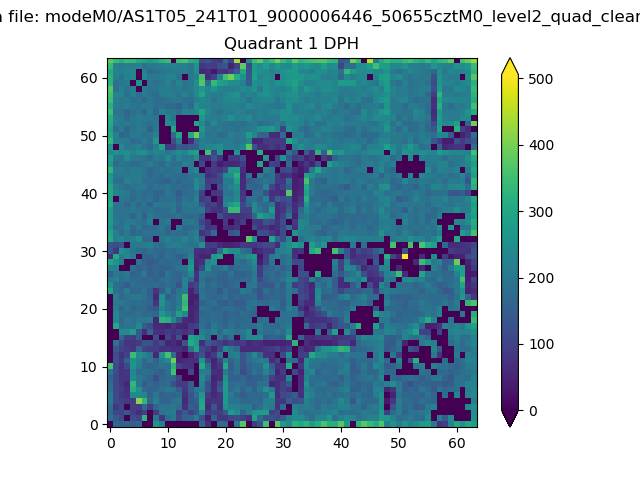 |
Quadrant B |
|---|---|---|---|
| Quadrant D | 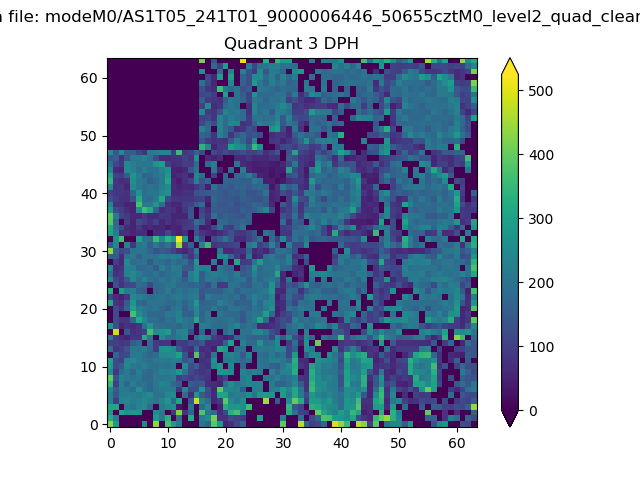 |
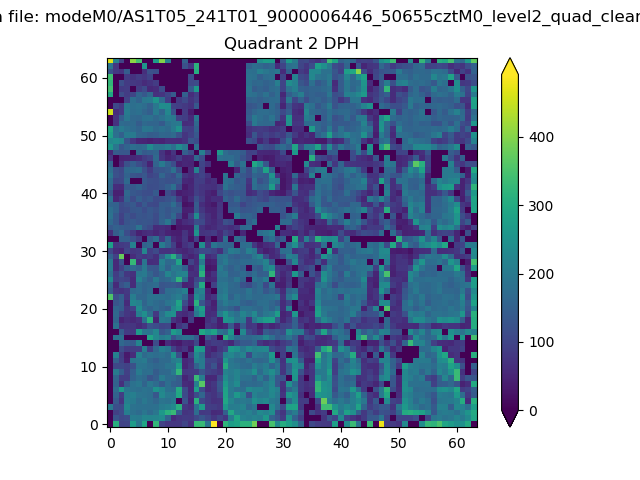 |
Quadrant C |
| Plot type | Count rate plots | Images |
|---|---|---|
| Comparison with Poisson distribution Blue bars denote a histogram of data divided into 1 sec bins. Red curve is a Poisson curve with rate = median count rate of data. |
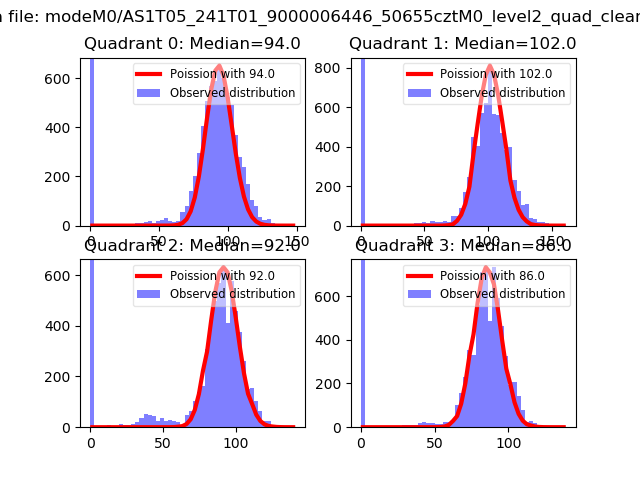 |
 |
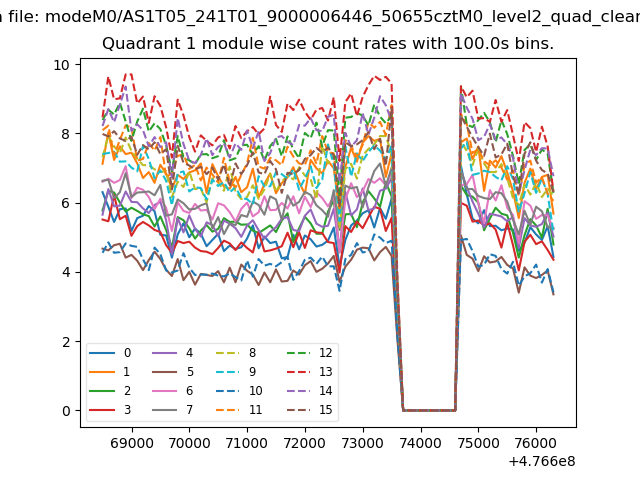
| Quadrant-wise count rates Data is divided into 100 sec bins |
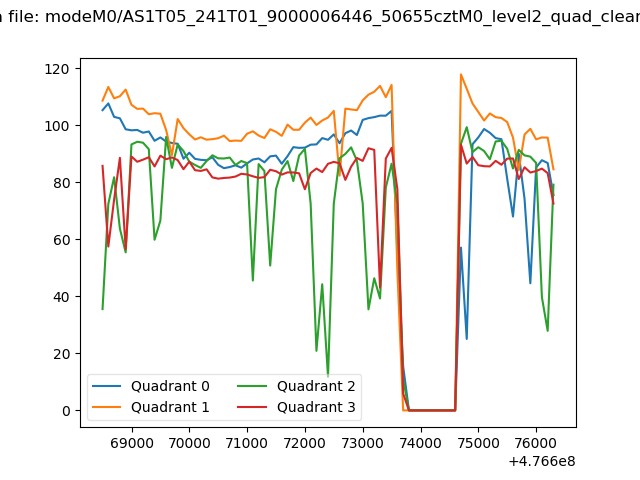 |
|
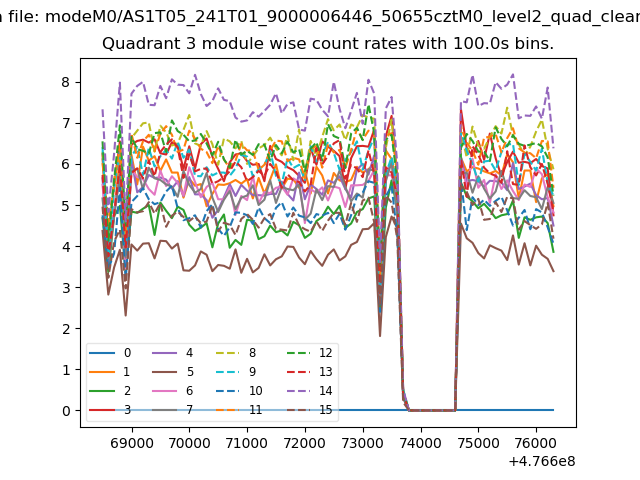
| Module-wise count rates for Quadrant A Data is divided into 100 sec bins |
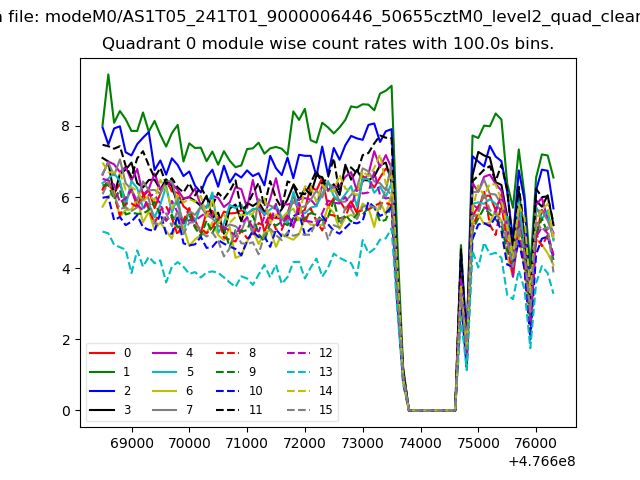 |
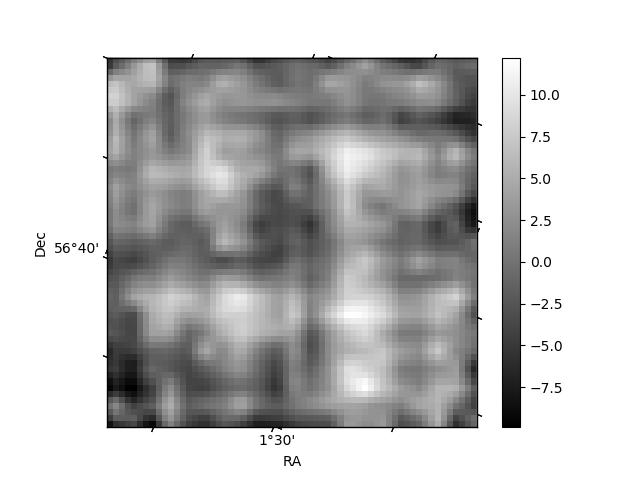 |
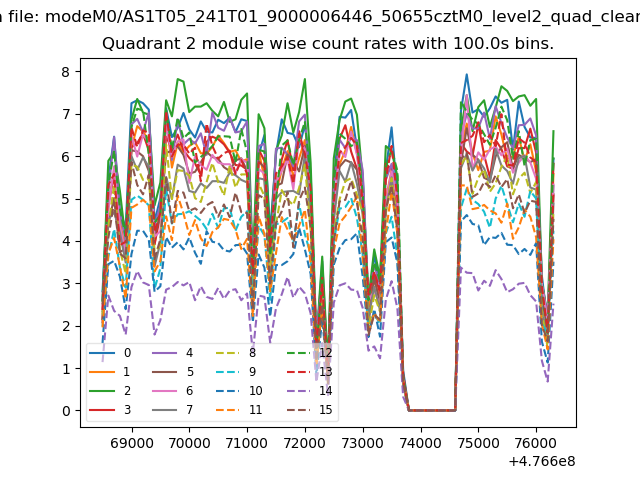
| Module-wise count rates for Quadrant B Data is divided into 100 sec bins |
 |
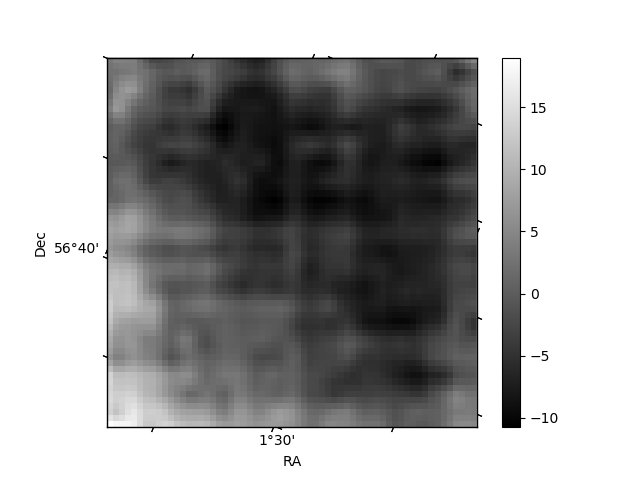 |
| Module-wise count rates for Quadrant C Data is divided into 100 sec bins |
 |
 |
| Module-wise count rates for Quadrant D Data is divided into 100 sec bins |
 |
 |
| Parameter | Plot |
|---|---|
| CZT HV Monitor | 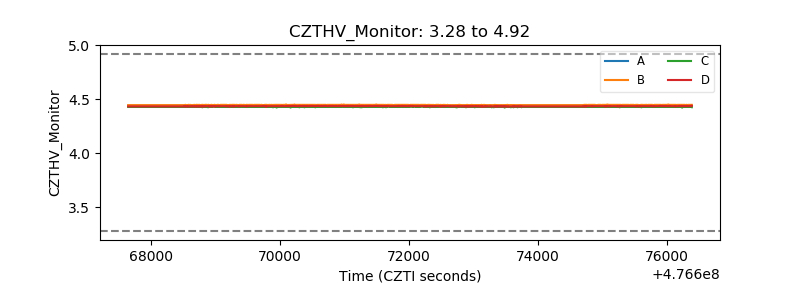 |
| D_VDD | 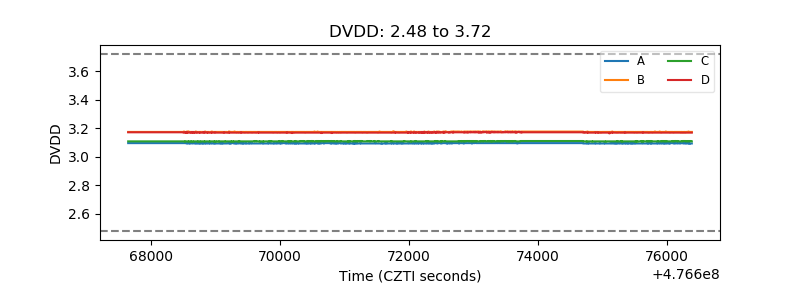 |
| Temperature 1 | 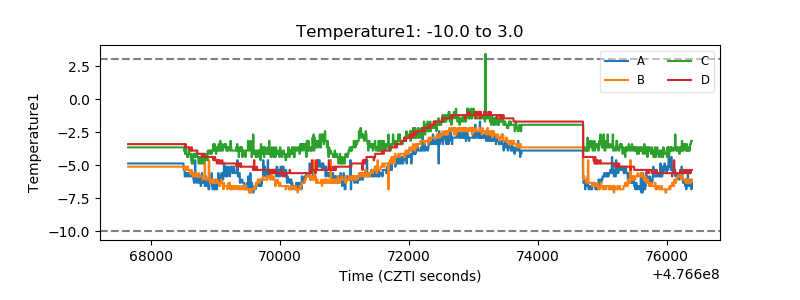 |
| Veto HV Monitor | 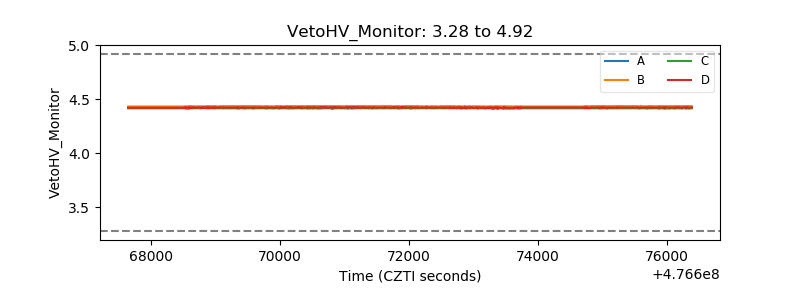 |
| Veto LLD | 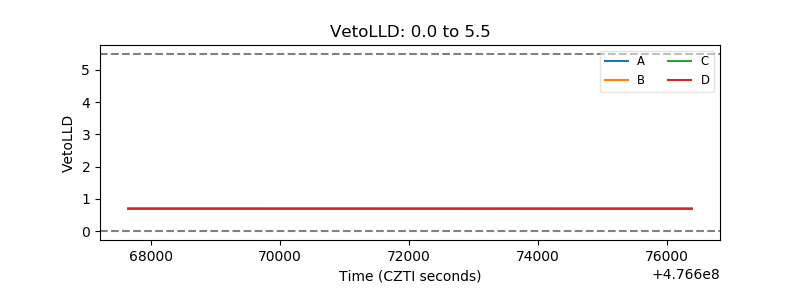 |
| Alpha Counter | 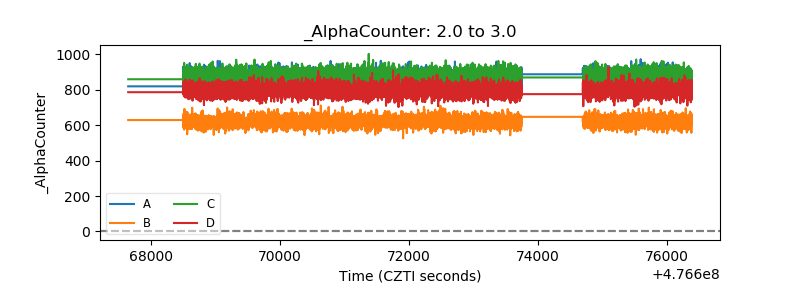 |
| _CPM_Rate | 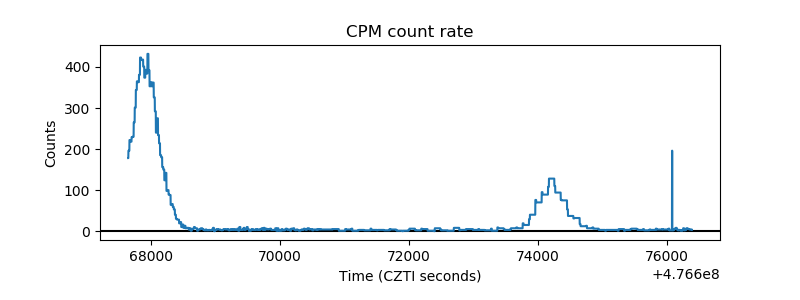 |
| CZT Counter | 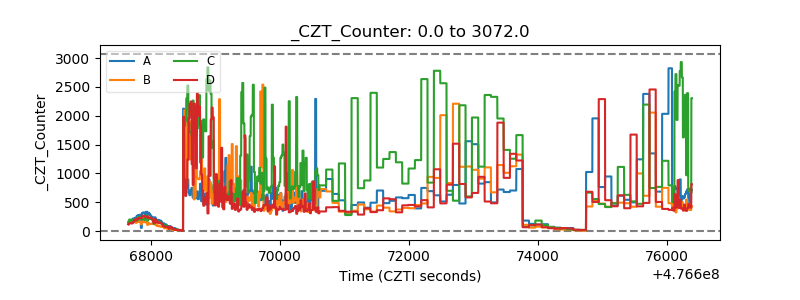 |
| +2.5 Volts monitor | 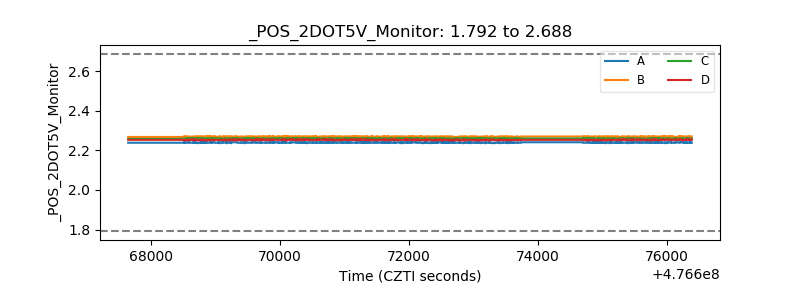 |
| +5 Volts monitor |  |
| _ROLL_ROT | 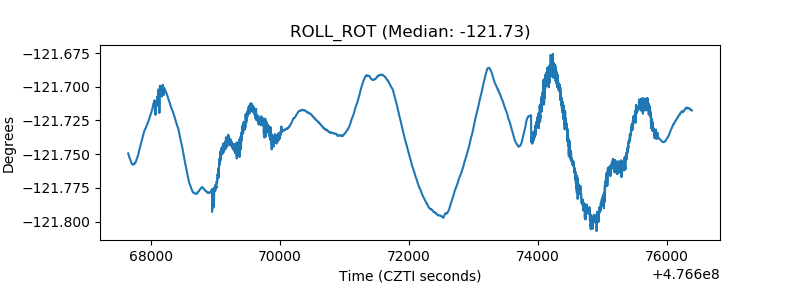 |
| _Roll_DEC | 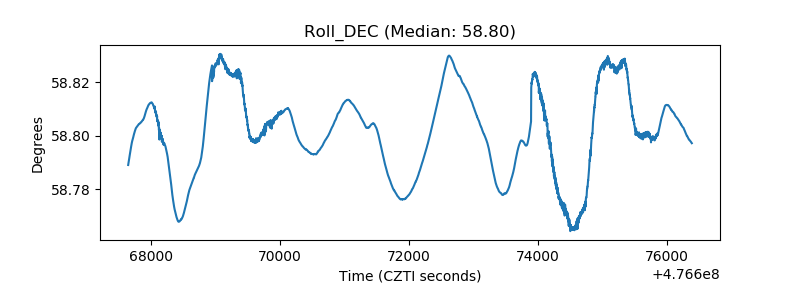 |
| _Roll_RA | 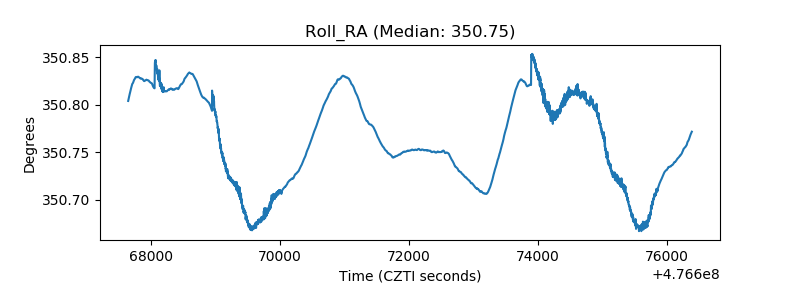 |
| Veto Counter | 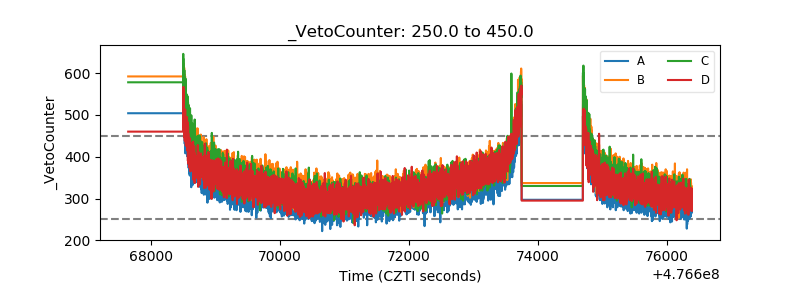 |