| Param | Original file | Final file |
|---|---|---|
| Filename | modeM0/AS1T05_241T01_9000006446_50656cztM0_level2.fits | modeM0/AS1T05_241T01_9000006446_50656cztM0_level2_quad_clean.evt |
| Size (bytes) | 562,055,040 | 103,371,840 |
| Size | 536.0 MB | 98.6 MB |
| Events in quadrant A | 5,779,971 | 647,329 |
| Events in quadrant B | 3,998,807 | 730,920 |
| Events in quadrant C | 6,158,378 | 634,519 |
| Events in quadrant D | 4,305,270 | 611,761 |
| Mode M9 | |||
|---|---|---|---|
| Quadrant | BADHDUFLAG | Total packets | Discarded packets |
| A | 0 | 5 | 0 |
| B | 0 | 5 | 0 |
| C | 0 | 5 | 0 |
| D | 0 | 5 | 0 |
| Mode M0 | |||
|---|---|---|---|
| Quadrant | BADHDUFLAG | Total packets | Discarded packets |
| A | 0 | 22298 | 1 |
| B | 0 | 17097 | 1 |
| C | 0 | 23418 | 1 |
| D | 0 | 18222 | 2 |
| Mode SS | |||
|---|---|---|---|
| Quadrant | BADHDUFLAG | Total packets | Discarded packets |
| A | 0 | 146 | 0 |
| B | 0 | 146 | 0 |
| C | 0 | 146 | 0 |
| D | 0 | 146 | 0 |
| Quadrant | Total seconds | Saturated seconds | Saturation percentage |
|---|---|---|---|
| A | 7261 | 384 | 5.288528% |
| B | 7261 | 137 | 1.886792% |
| C | 7262 | 487 | 6.706142% |
| D | 7261 | 143 | 1.969426% |
Noise dominated data is calculated using 1-second bins in cleaned event files. If a bin has >2000 counts, and if more than 50% of those come from <1% of pixels, then it is considered to be noise-dominated and hence unusable.
| Quadrant | # 1 sec bins | Bins with >0 counts | Bins with >2000 counts | High rate bins dominated by noise | Noise dominated (total time) | Noise dominated (detector-on time) | Marked lightcurve |
|---|---|---|---|---|---|---|---|
| A | 7786 | 7262 | 304 | 304 | 3.90% | 4.19% | 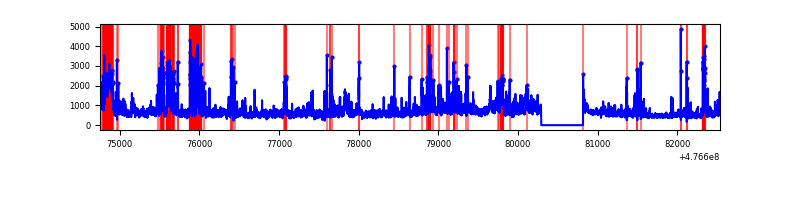 |
| B | 7786 | 7262 | 56 | 56 | 0.72% | 0.77% | 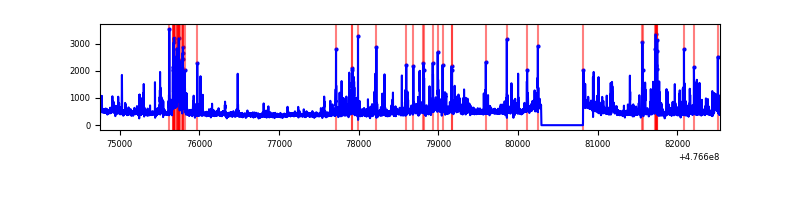 |
| C | 7787 | 7263 | 361 | 361 | 4.64% | 4.97% | 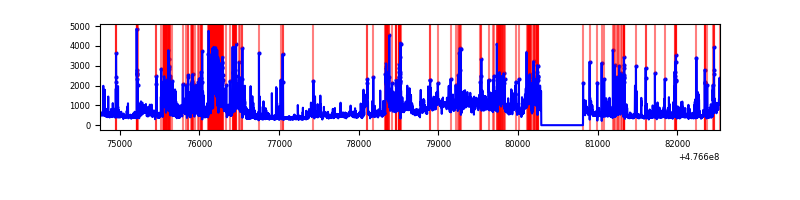 |
| D | 7786 | 7262 | 120 | 120 | 1.54% | 1.65% | 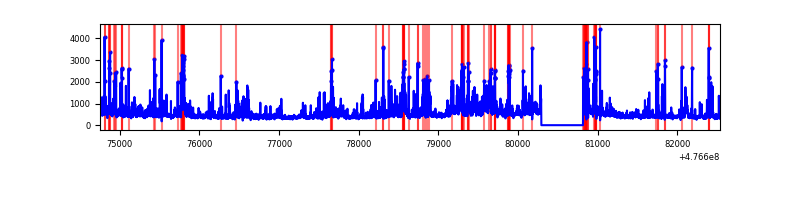 |
Top three noisy pixels from each quadrant. If the there are fewer than three noisy pixels in the level2.evt file, extra rows are filled as -1
| Pixel properties | Quadrant properties | ||||||
|---|---|---|---|---|---|---|---|
| Quadrant | DetID | PixID | Counts | Sigma | Mean | Median | Sigma |
| A | 4 | 4 | 968713 | 5255.56 | 748 | 730 | 184.2 |
| A | 12 | 80 | 398400 | 2159.11 | 748 | 730 | 184.2 |
| A | 6 | 161 | 297308 | 1610.24 | 748 | 730 | 184.2 |
| B | 10 | 247 | 220069 | 1373.74 | 757 | 731 | 159.7 |
| B | 5 | 185 | 140130 | 873.07 | 757 | 731 | 159.7 |
| B | 4 | 206 | 100903 | 627.39 | 757 | 731 | 159.7 |
| C | 4 | 5 | 830654 | 4109.39 | 732 | 728 | 202.0 |
| C | 15 | 1 | 666530 | 3296.72 | 732 | 728 | 202.0 |
| C | 15 | 174 | 565504 | 2796.49 | 732 | 728 | 202.0 |
| D | 9 | 49 | 237056 | 1158.01 | 733 | 706 | 204.1 |
| D | 15 | 108 | 202329 | 987.87 | 733 | 706 | 204.1 |
| D | 7 | 60 | 118438 | 576.84 | 733 | 706 | 204.1 |
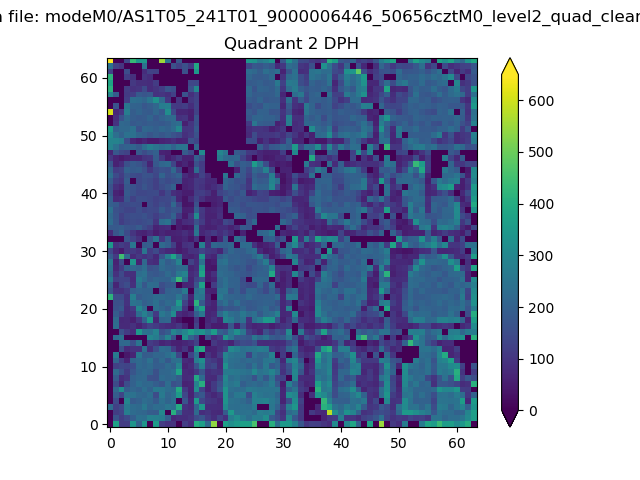
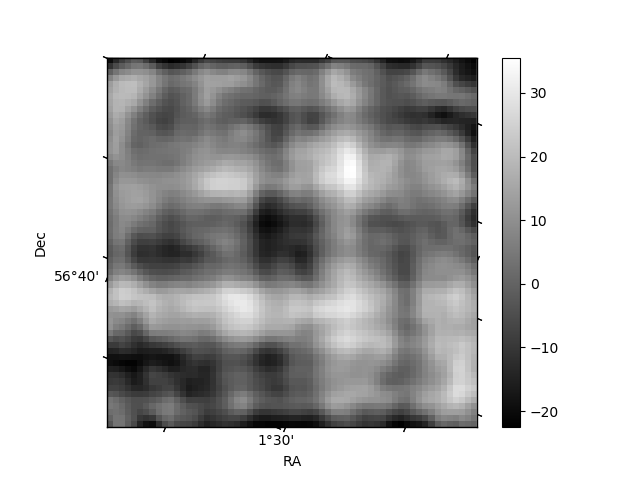
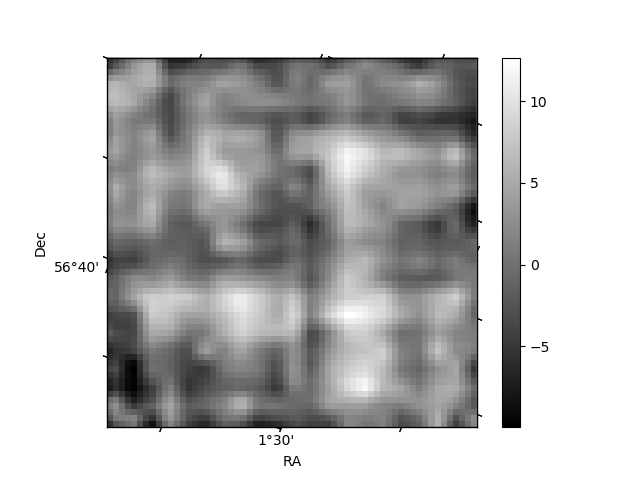
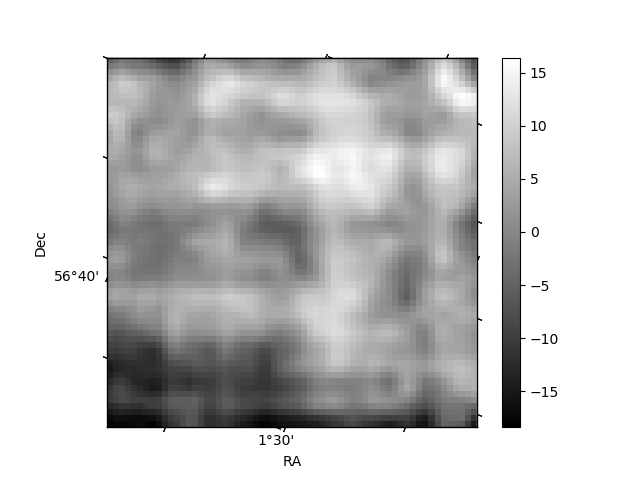
Histogram calculated using DETX and DETY for each event in the final _common_clean file
| Quadrant A | 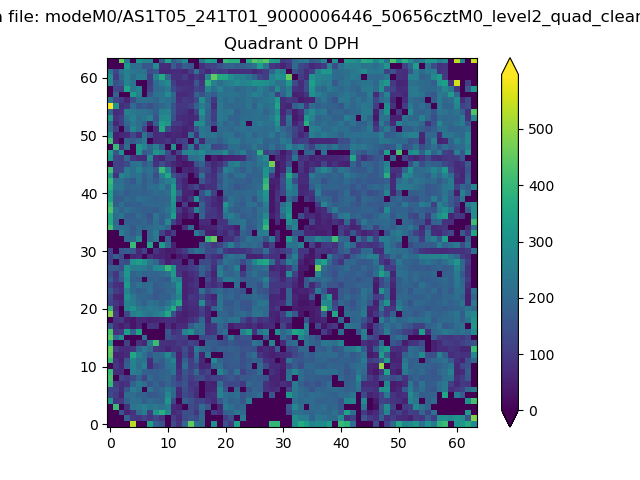 |
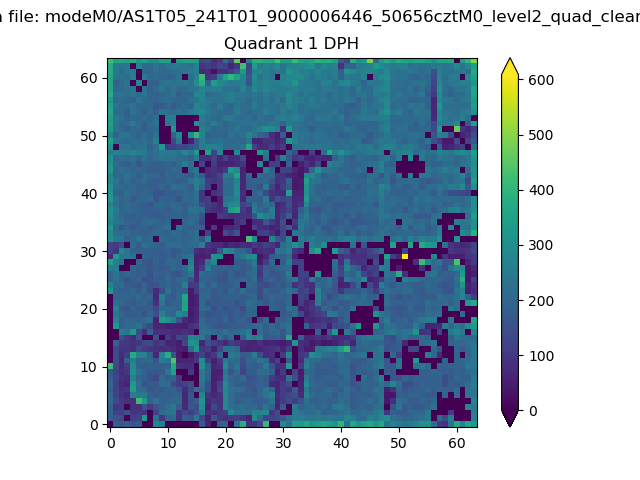 |
Quadrant B |
|---|---|---|---|
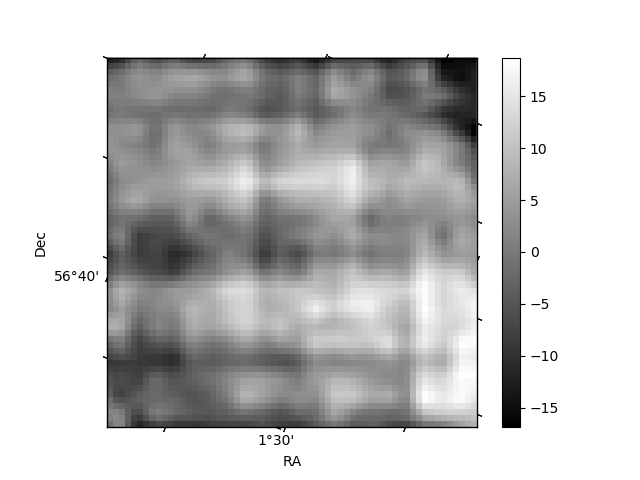
| Quadrant D | 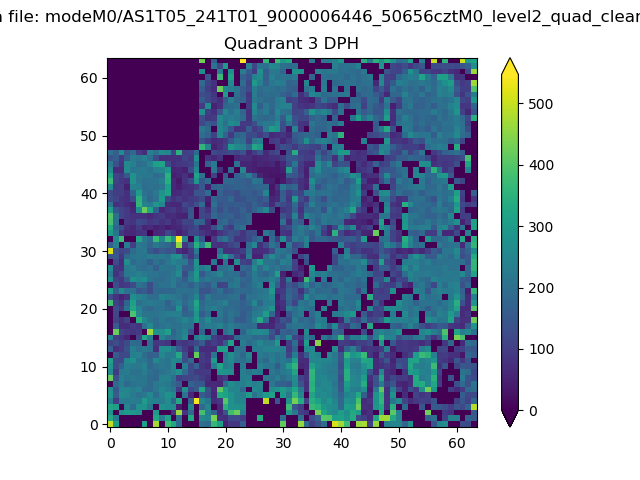 |
 |
Quadrant C |
| Plot type | Count rate plots | Images |
|---|---|---|
| Comparison with Poisson distribution Blue bars denote a histogram of data divided into 1 sec bins. Red curve is a Poisson curve with rate = median count rate of data. |
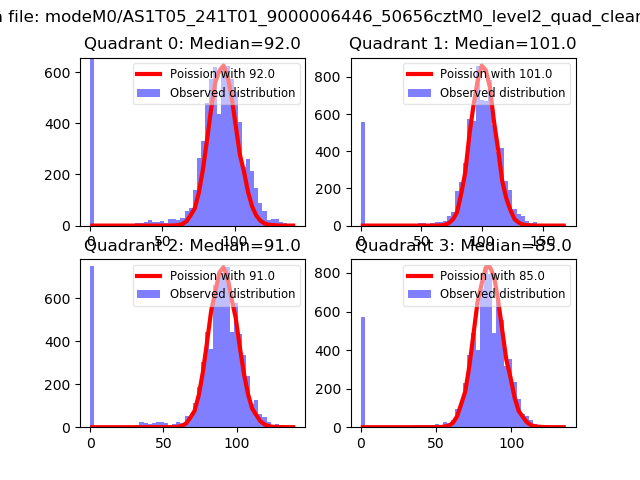 |
 |
| Quadrant-wise count rates Data is divided into 100 sec bins |
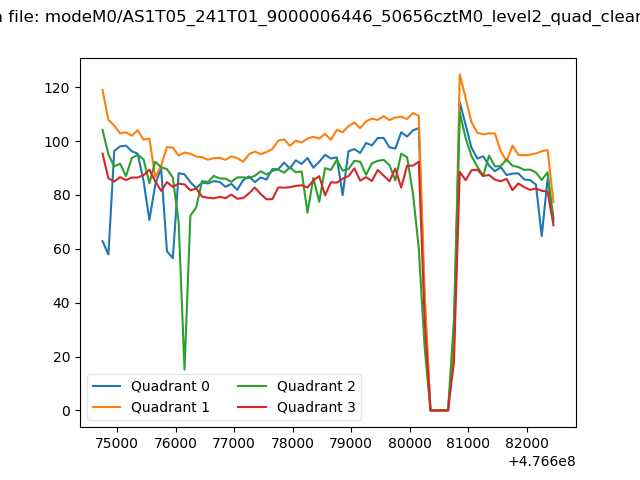 |
|
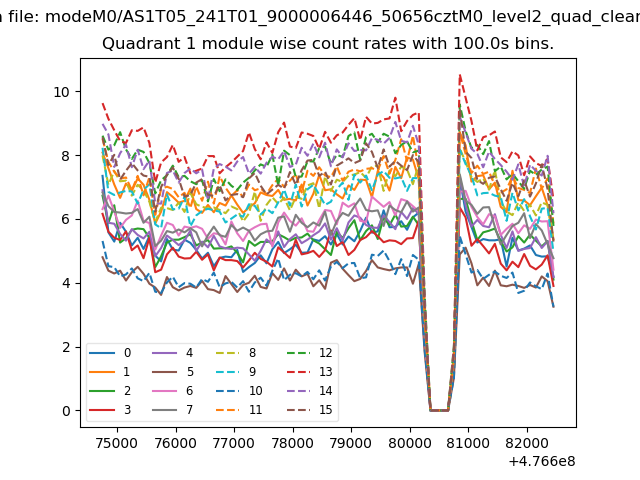
| Module-wise count rates for Quadrant A Data is divided into 100 sec bins |
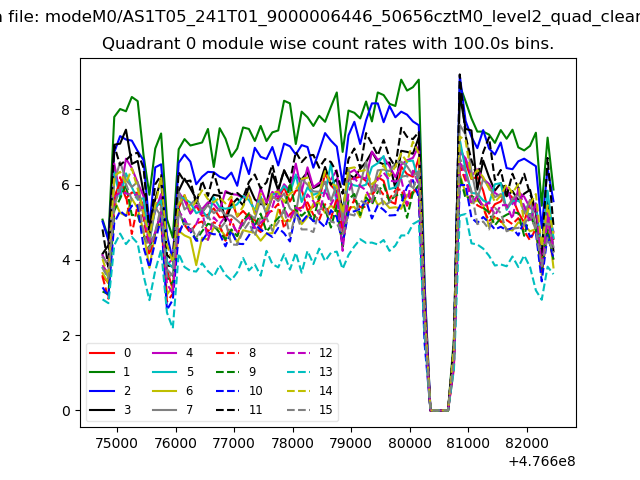 |
 |
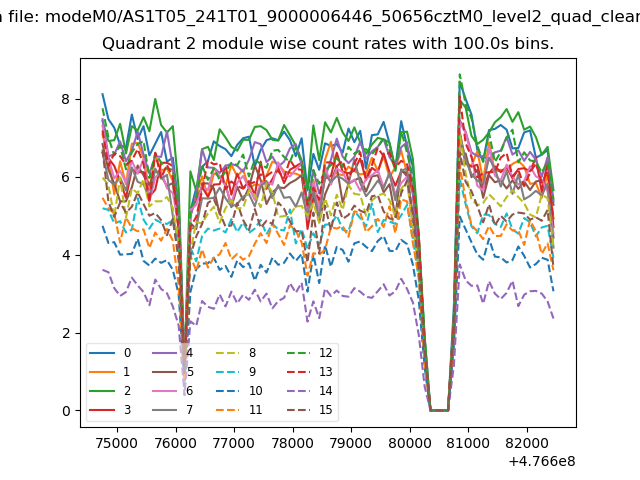
| Module-wise count rates for Quadrant B Data is divided into 100 sec bins |
 |
 |
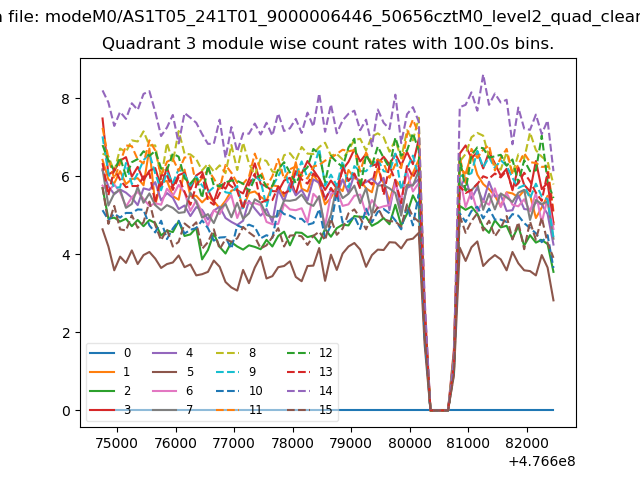
| Module-wise count rates for Quadrant C Data is divided into 100 sec bins |
 |
 |
| Module-wise count rates for Quadrant D Data is divided into 100 sec bins |
 |
 |
| Parameter | Plot |
|---|---|
| CZT HV Monitor | 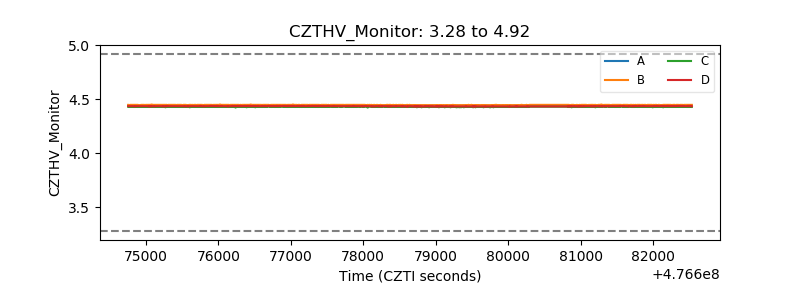 |
| D_VDD | 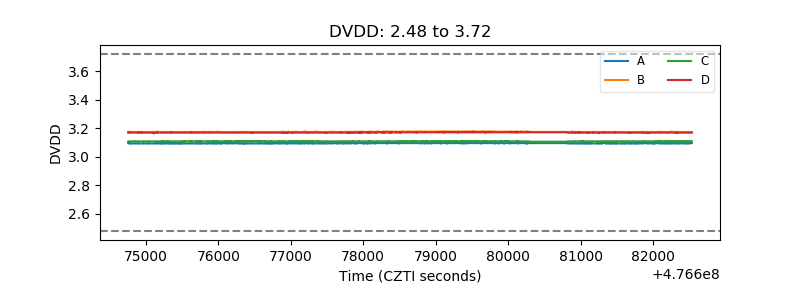 |
| Temperature 1 | 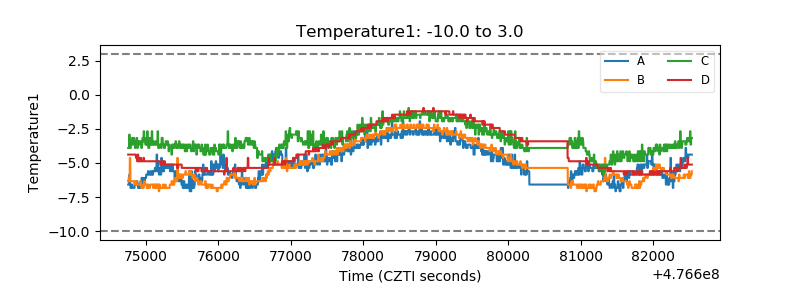 |
| Veto HV Monitor | 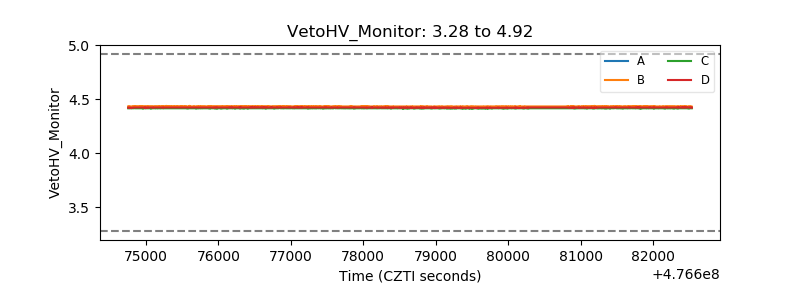 |
| Veto LLD | 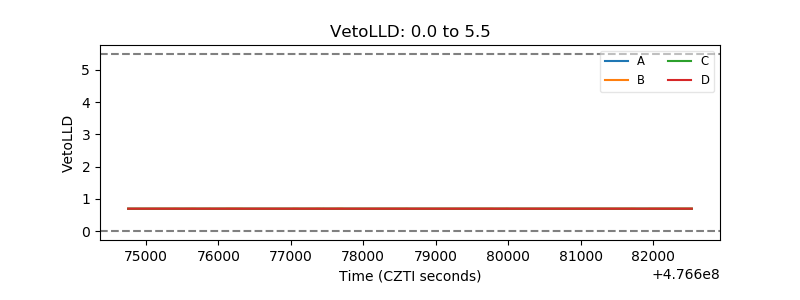 |
| Alpha Counter | 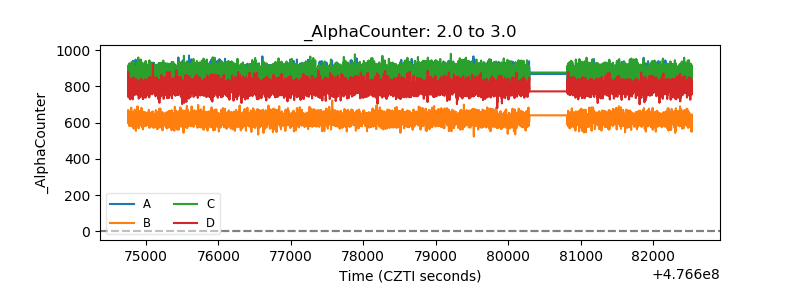 |
| _CPM_Rate | 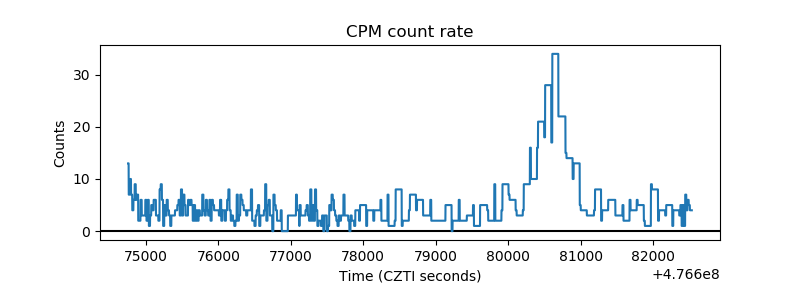 |
| CZT Counter | 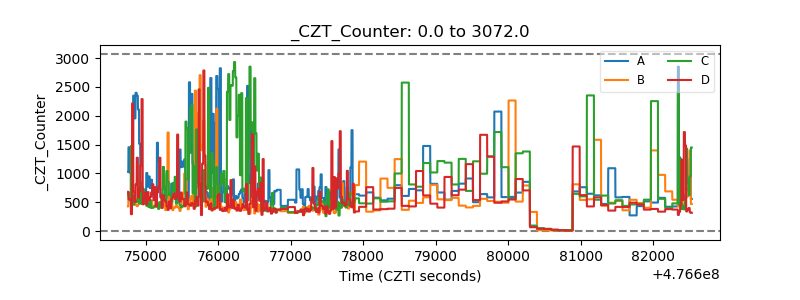 |
| +2.5 Volts monitor | 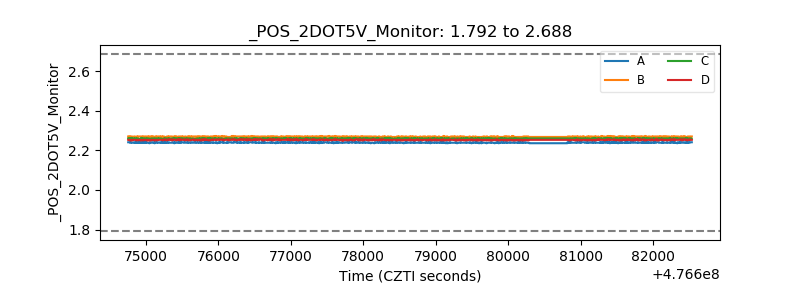 |
| +5 Volts monitor | 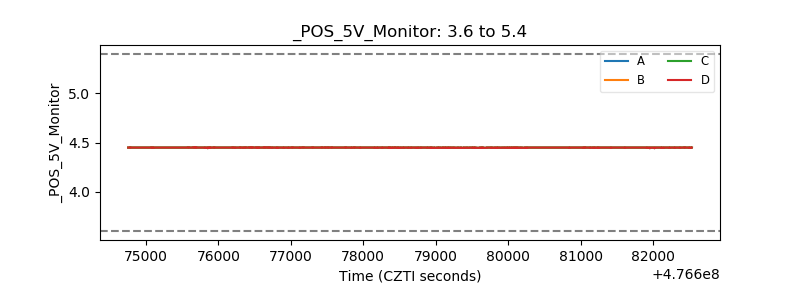 |
| _ROLL_ROT | 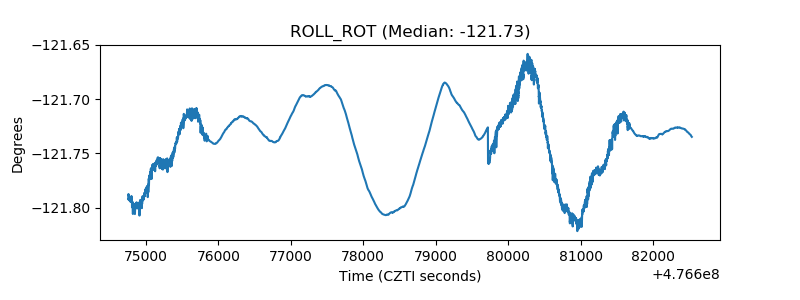 |
| _Roll_DEC | 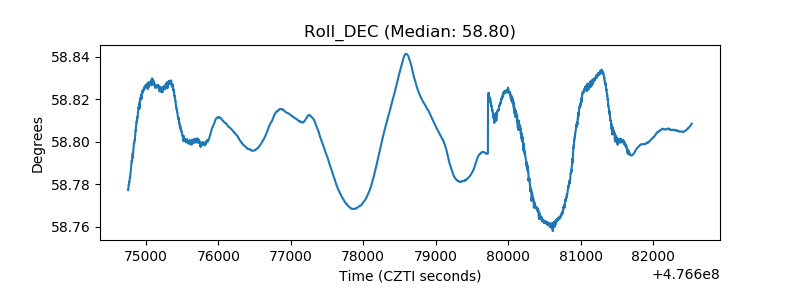 |
| _Roll_RA | 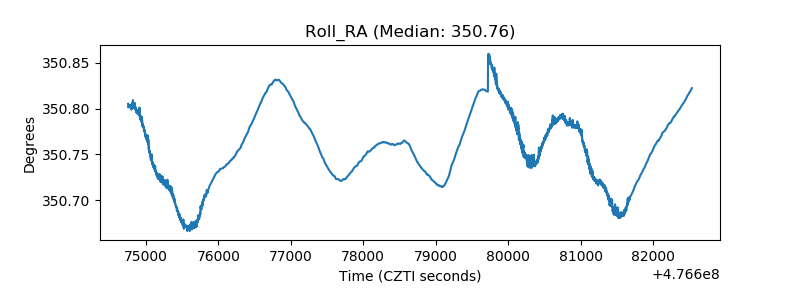 |
| Veto Counter | 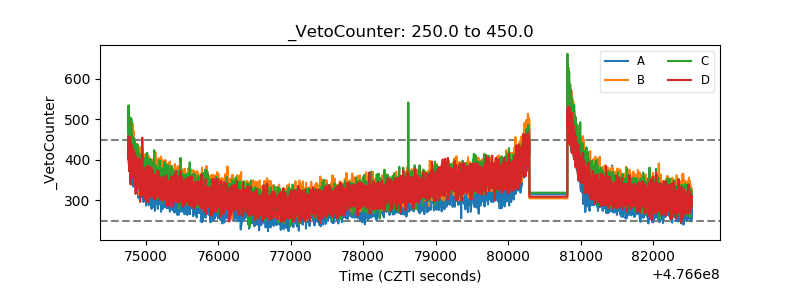 |