| Param | Original file | Final file |
|---|---|---|
| Filename | modeM0/AS1T05_241T01_9000006446_50657cztM0_level2.fits | modeM0/AS1T05_241T01_9000006446_50657cztM0_level2_quad_clean.evt |
| Size (bytes) | 695,436,480 | 113,587,200 |
| Size | 663.2 MB | 108.3 MB |
| Events in quadrant A | 5,259,783 | 736,110 |
| Events in quadrant B | 5,866,071 | 809,596 |
| Events in quadrant C | 8,847,809 | 672,171 |
| Events in quadrant D | 5,146,640 | 661,643 |
| Mode M9 | |||
|---|---|---|---|
| Quadrant | BADHDUFLAG | Total packets | Discarded packets |
| A | 0 | 5 | 0 |
| B | 0 | 5 | 0 |
| C | 0 | 5 | 0 |
| D | 0 | 5 | 0 |
| Mode M0 | |||
|---|---|---|---|
| Quadrant | BADHDUFLAG | Total packets | Discarded packets |
| A | 0 | 21228 | 1 |
| B | 0 | 23131 | 1 |
| C | 0 | 31897 | 1 |
| D | 0 | 21287 | 1 |
| Mode SS | |||
|---|---|---|---|
| Quadrant | BADHDUFLAG | Total packets | Discarded packets |
| A | 0 | 164 | 0 |
| B | 0 | 164 | 0 |
| C | 0 | 164 | 0 |
| D | 0 | 164 | 0 |
| Quadrant | Total seconds | Saturated seconds | Saturation percentage |
|---|---|---|---|
| A | 8047 | 172 | 2.137443% |
| B | 8047 | 273 | 3.392569% |
| C | 8047 | 963 | 11.967193% |
| D | 8047 | 329 | 4.088480% |
Noise dominated data is calculated using 1-second bins in cleaned event files. If a bin has >2000 counts, and if more than 50% of those come from <1% of pixels, then it is considered to be noise-dominated and hence unusable.
| Quadrant | # 1 sec bins | Bins with >0 counts | Bins with >2000 counts | High rate bins dominated by noise | Noise dominated (total time) | Noise dominated (detector-on time) | Marked lightcurve |
|---|---|---|---|---|---|---|---|
| A | 8572 | 8048 | 98 | 98 | 1.14% | 1.22% | 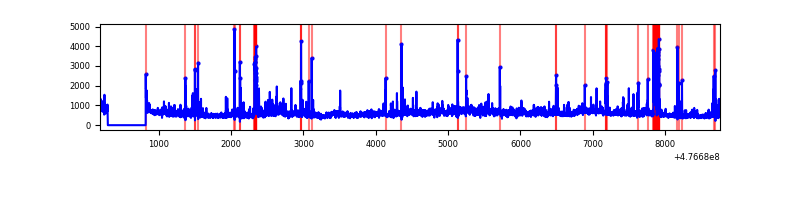 |
| B | 8572 | 8048 | 121 | 121 | 1.41% | 1.50% | 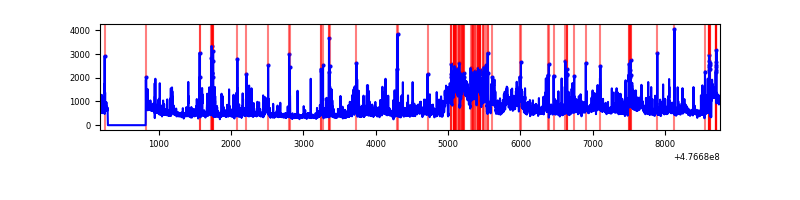 |
| C | 8572 | 8048 | 813 | 813 | 9.48% | 10.10% | 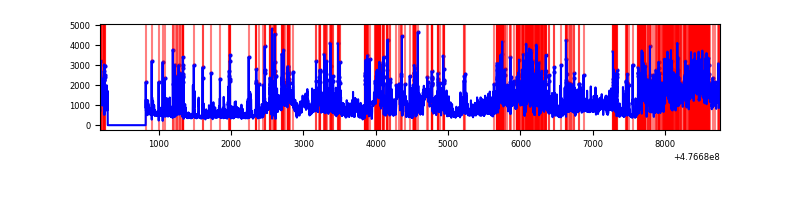 |
| D | 8572 | 8048 | 268 | 268 | 3.13% | 3.33% | 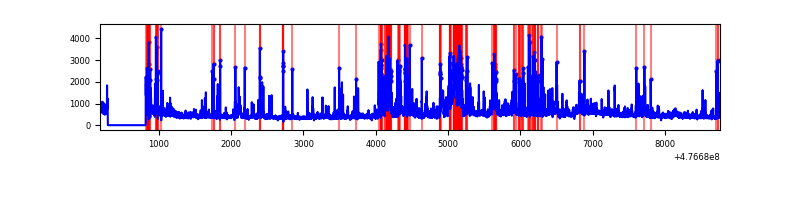 |
Top three noisy pixels from each quadrant. If the there are fewer than three noisy pixels in the level2.evt file, extra rows are filled as -1
| Pixel properties | Quadrant properties | ||||||
|---|---|---|---|---|---|---|---|
| Quadrant | DetID | PixID | Counts | Sigma | Mean | Median | Sigma |
| A | 4 | 4 | 926513 | 4393.47 | 852 | 828 | 210.7 |
| A | 8 | 246 | 184912 | 873.7 | 852 | 828 | 210.7 |
| A | 4 | 3 | 153591 | 725.04 | 852 | 828 | 210.7 |
| B | 5 | 172 | 1290290 | 7181.24 | 850 | 819 | 179.6 |
| B | 5 | 185 | 257202 | 1427.83 | 850 | 819 | 179.6 |
| B | 4 | 206 | 218152 | 1210.36 | 850 | 819 | 179.6 |
| C | 15 | 174 | 1614425 | 7183.47 | 808 | 803 | 224.6 |
| C | 15 | 1 | 1494174 | 6648.14 | 808 | 803 | 224.6 |
| C | 4 | 5 | 641202 | 2850.91 | 808 | 803 | 224.6 |
| D | 7 | 110 | 284661 | 1255.38 | 818 | 787 | 226.1 |
| D | 2 | 153 | 264672 | 1166.98 | 818 | 787 | 226.1 |
| D | 10 | 102 | 233394 | 1028.66 | 818 | 787 | 226.1 |
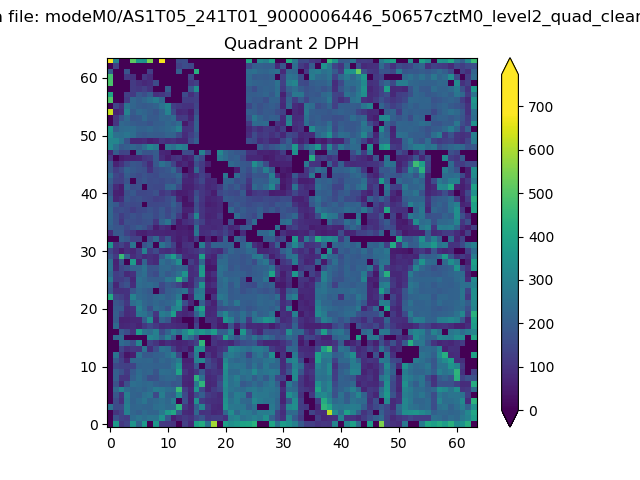
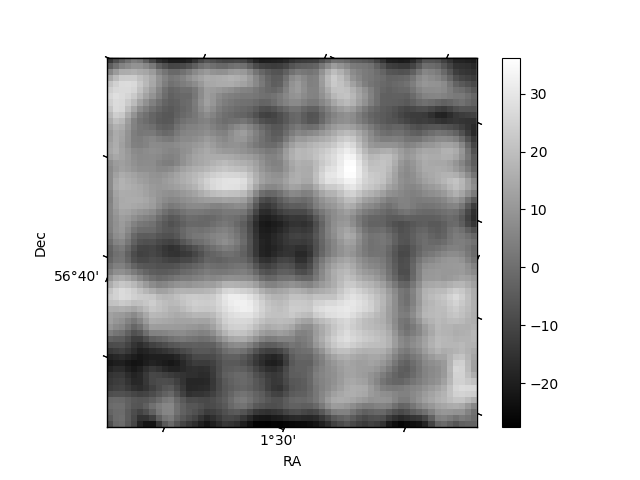
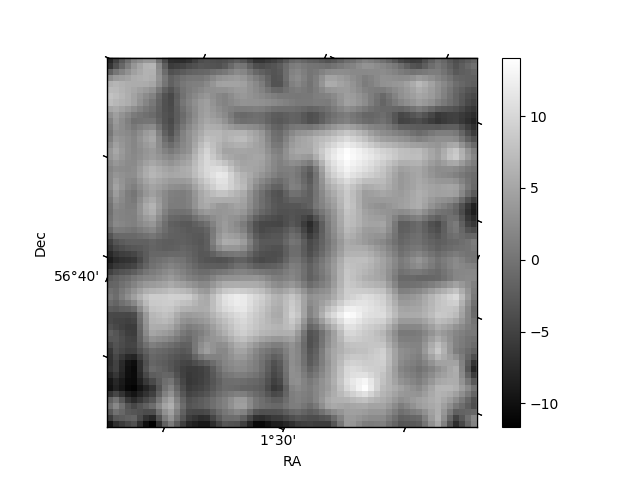
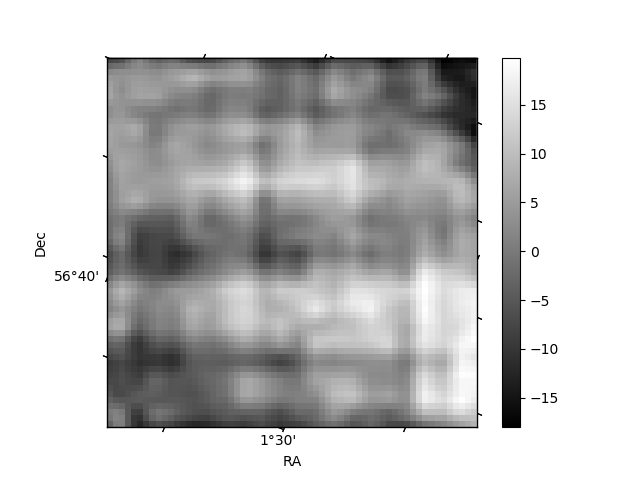
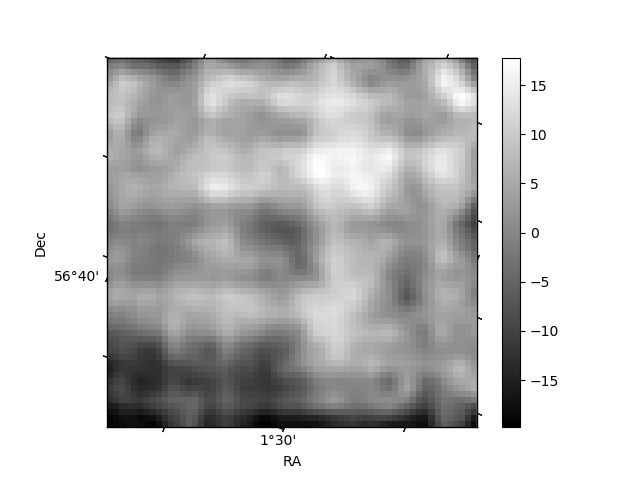
Histogram calculated using DETX and DETY for each event in the final _common_clean file
| Quadrant A | 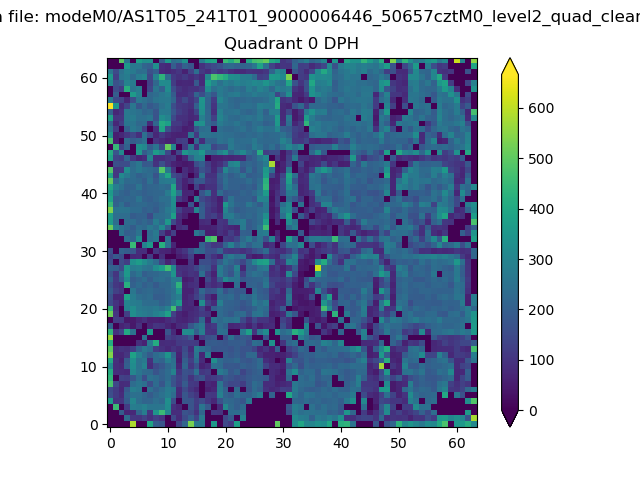 |
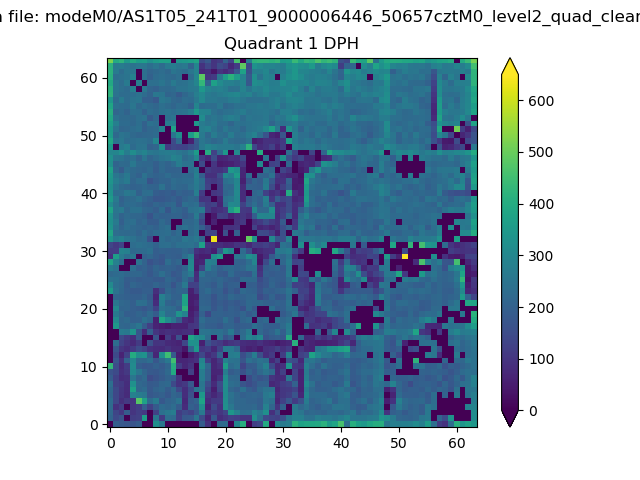 |
Quadrant B |
|---|---|---|---|
| Quadrant D | 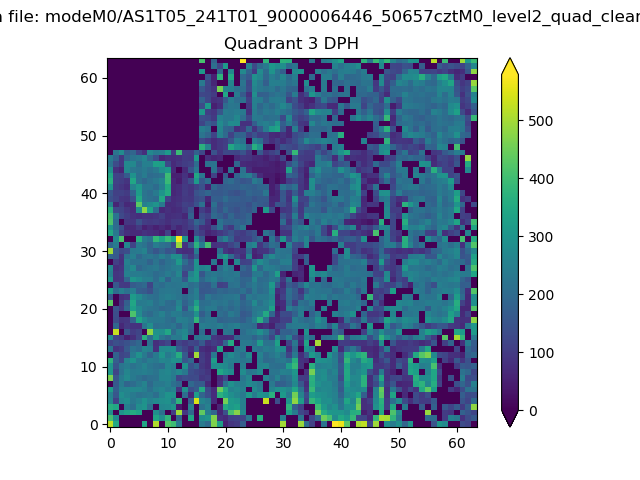 |
 |
Quadrant C |
| Plot type | Count rate plots | Images |
|---|---|---|
| Comparison with Poisson distribution Blue bars denote a histogram of data divided into 1 sec bins. Red curve is a Poisson curve with rate = median count rate of data. |
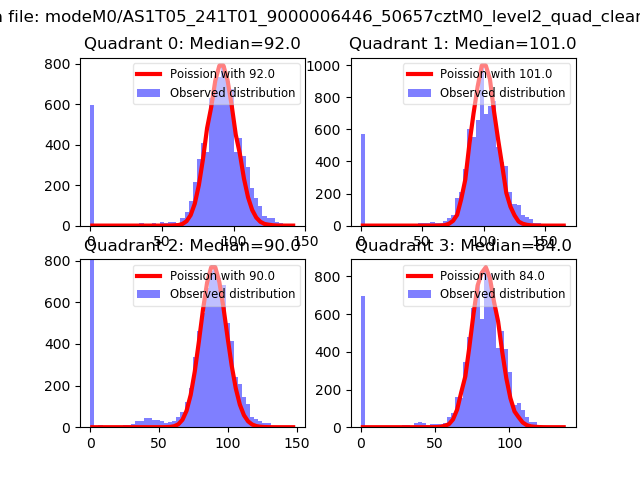 |
 |
| Quadrant-wise count rates Data is divided into 100 sec bins |
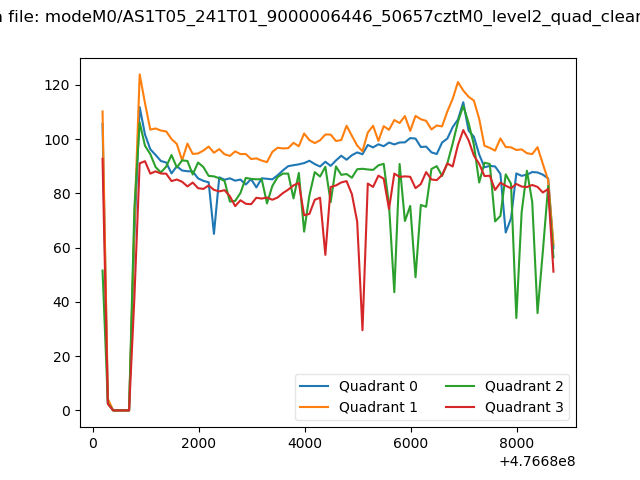 |
|
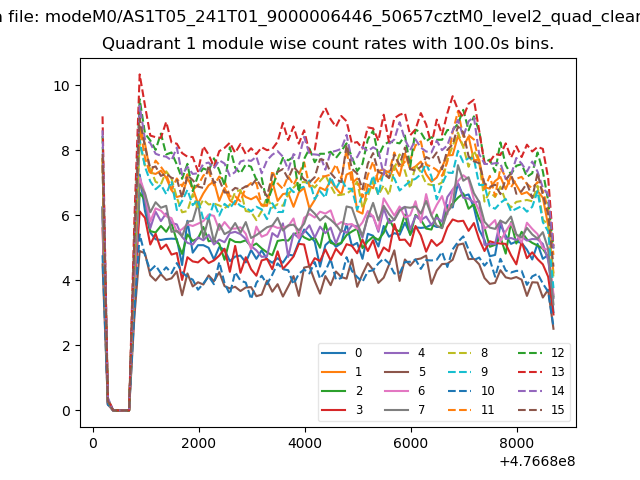
| Module-wise count rates for Quadrant A Data is divided into 100 sec bins |
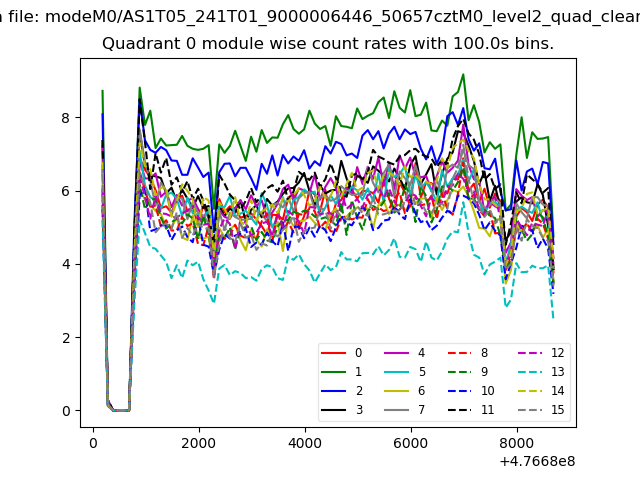 |
 |
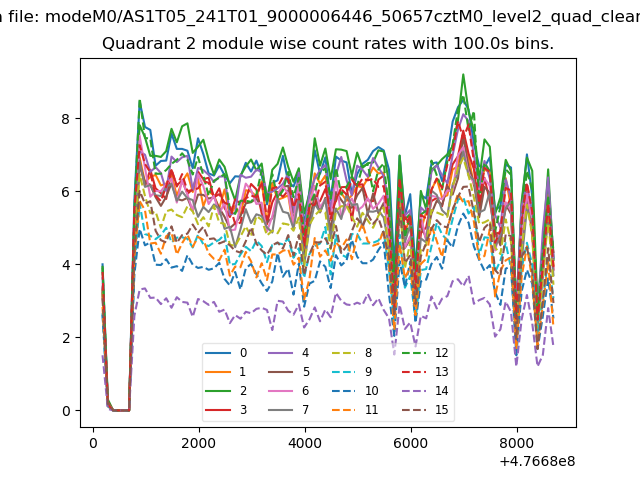
| Module-wise count rates for Quadrant B Data is divided into 100 sec bins |
 |
 |
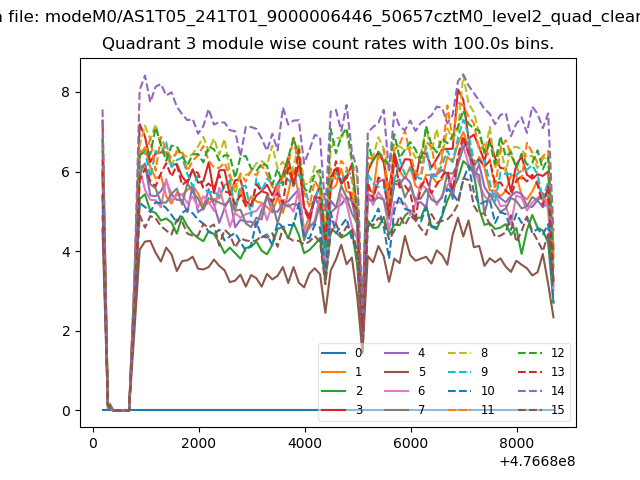
| Module-wise count rates for Quadrant C Data is divided into 100 sec bins |
 |
 |
| Module-wise count rates for Quadrant D Data is divided into 100 sec bins |
 |
 |
| Parameter | Plot |
|---|---|
| CZT HV Monitor | 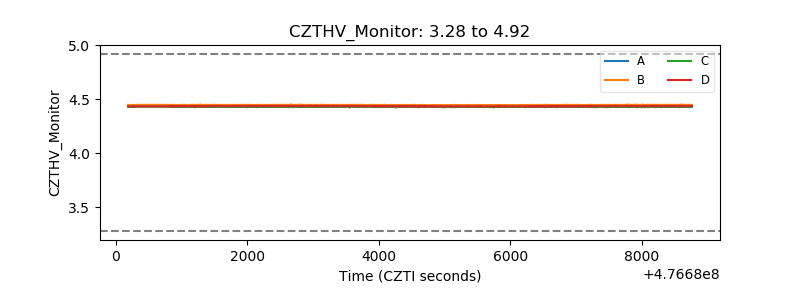 |
| D_VDD | 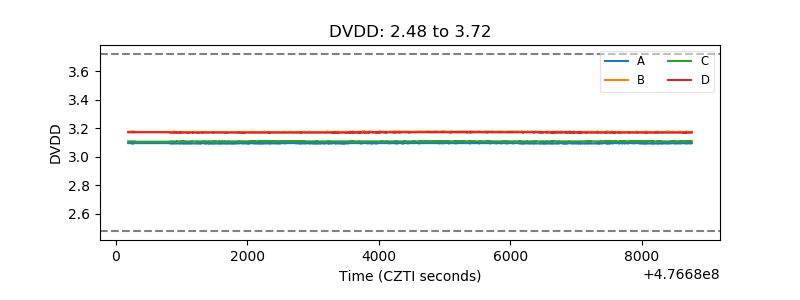 |
| Temperature 1 | 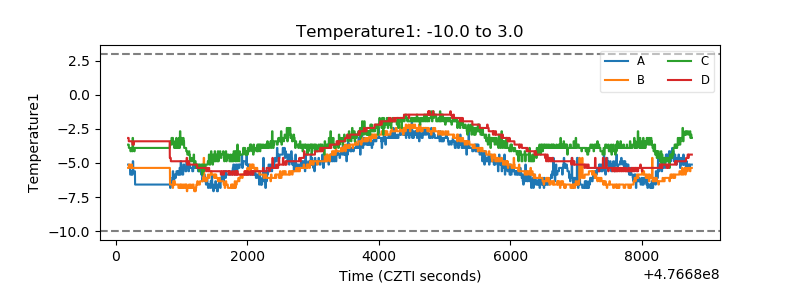 |
| Veto HV Monitor | 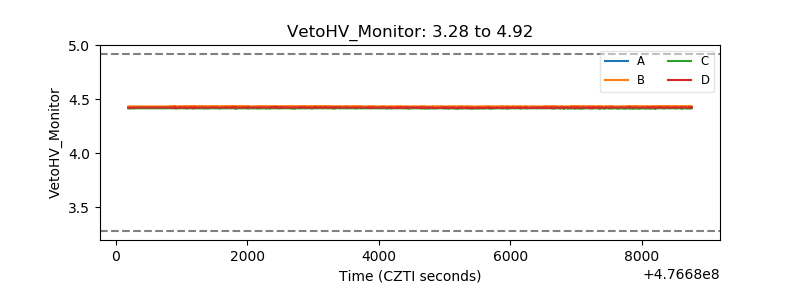 |
| Veto LLD | 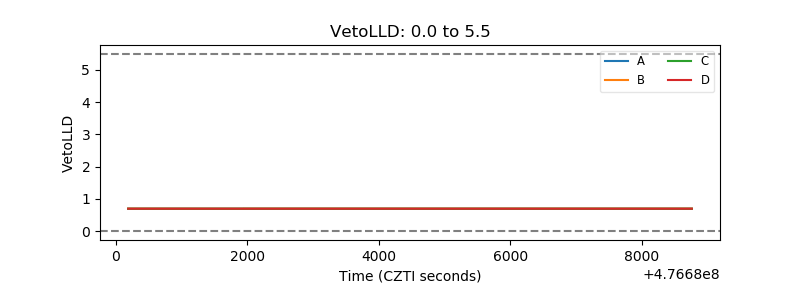 |
| Alpha Counter | 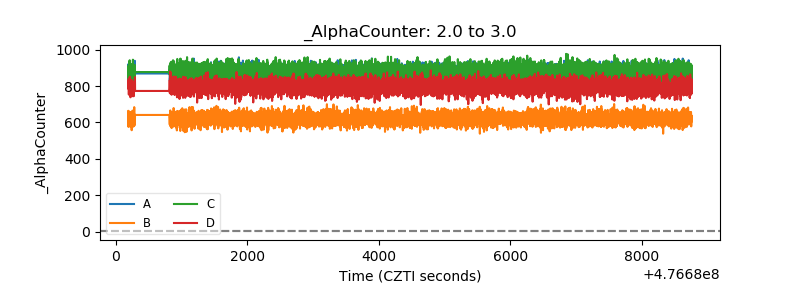 |
| _CPM_Rate | 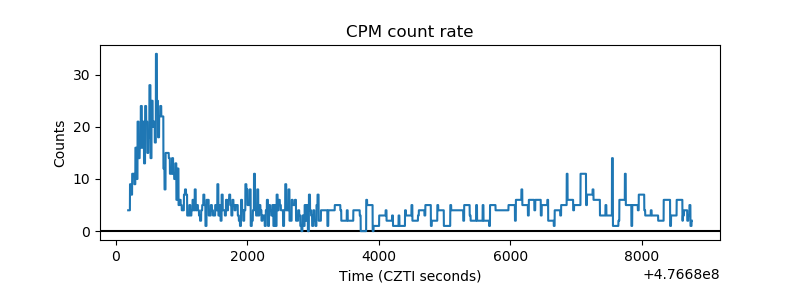 |
| CZT Counter | 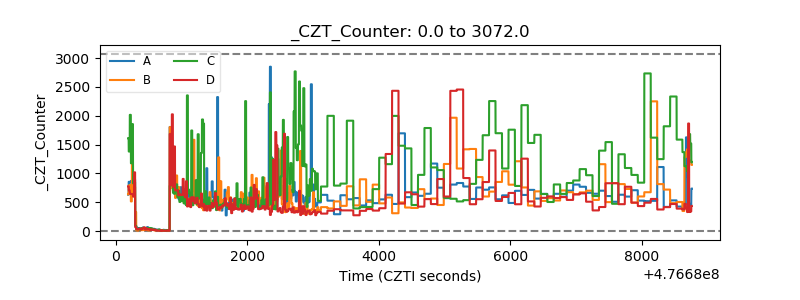 |
| +2.5 Volts monitor | 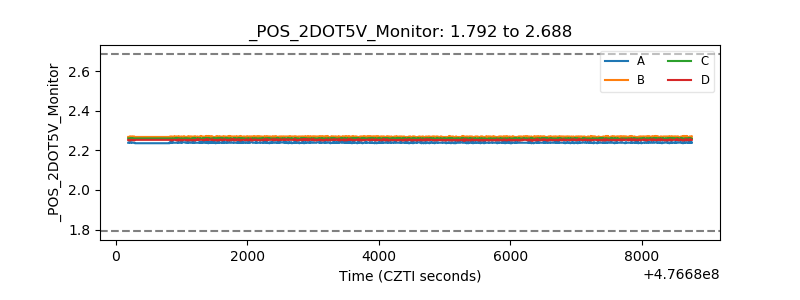 |
| +5 Volts monitor | 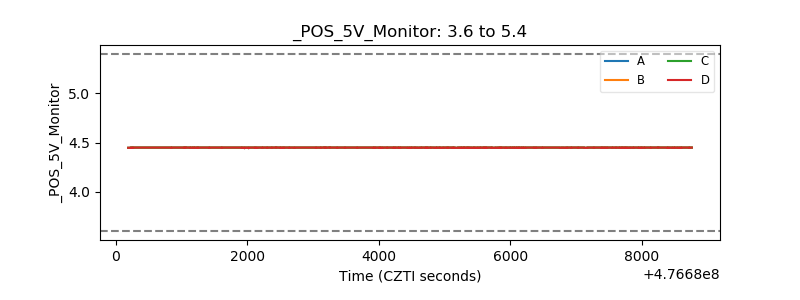 |
| _ROLL_ROT | 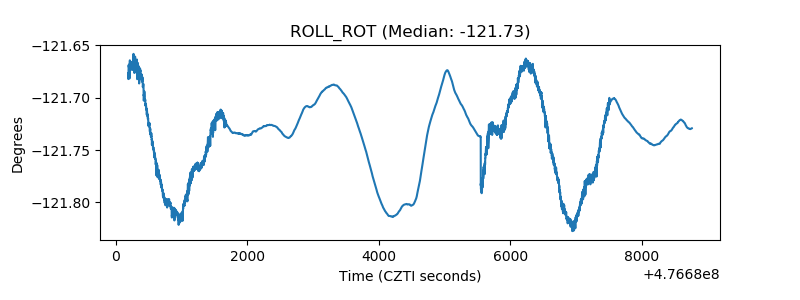 |
| _Roll_DEC | 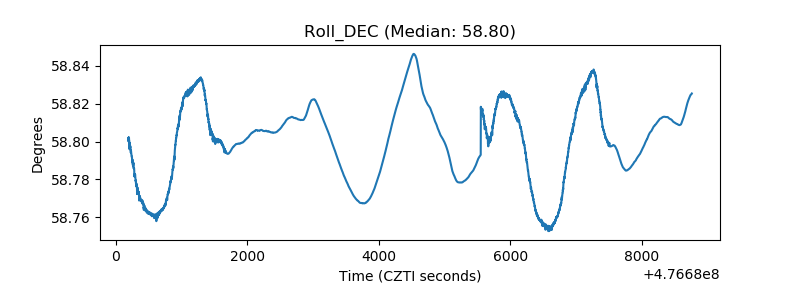 |
| _Roll_RA | 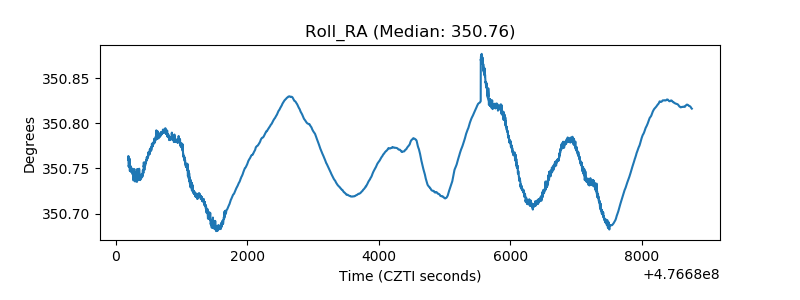 |
| Veto Counter | 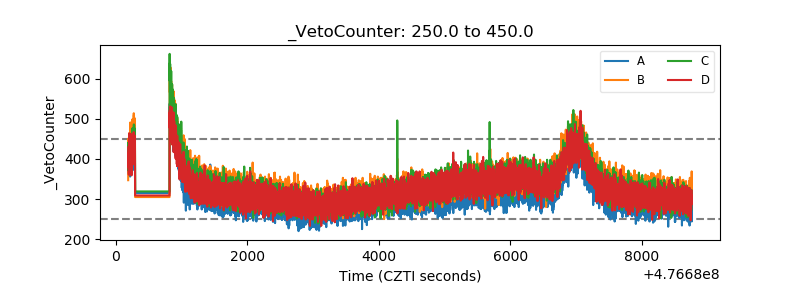 |