| Param | Original file | Final file |
|---|---|---|
| Filename | modeM0/AS1T05_241T01_9000006446_50662cztM0_level2.fits | modeM0/AS1T05_241T01_9000006446_50662cztM0_level2_quad_clean.evt |
| Size (bytes) | 797,328,000 | 106,807,680 |
| Size | 760.4 MB | 101.9 MB |
| Events in quadrant A | 10,786,877 | 619,761 |
| Events in quadrant B | 6,657,731 | 751,445 |
| Events in quadrant C | 6,701,352 | 660,784 |
| Events in quadrant D | 4,762,782 | 656,041 |
| Mode M9 | |||
|---|---|---|---|
| Quadrant | BADHDUFLAG | Total packets | Discarded packets |
| A | 0 | 12 | 0 |
| B | 0 | 12 | 0 |
| C | 0 | 12 | 0 |
| D | 0 | 12 | 0 |
| Mode M0 | |||
|---|---|---|---|
| Quadrant | BADHDUFLAG | Total packets | Discarded packets |
| A | 0 | 37302 | 4 |
| B | 0 | 25194 | 2 |
| C | 0 | 25318 | 2 |
| D | 0 | 19587 | 2 |
| Mode SS | |||
|---|---|---|---|
| Quadrant | BADHDUFLAG | Total packets | Discarded packets |
| A | 0 | 162 | 0 |
| B | 0 | 162 | 0 |
| C | 0 | 162 | 0 |
| D | 0 | 162 | 0 |
| Quadrant | Total seconds | Saturated seconds | Saturation percentage |
|---|---|---|---|
| A | 7840 | 1563 | 19.936224% |
| B | 7840 | 754 | 9.617347% |
| C | 7840 | 672 | 8.571429% |
| D | 7840 | 240 | 3.061224% |
Noise dominated data is calculated using 1-second bins in cleaned event files. If a bin has >2000 counts, and if more than 50% of those come from <1% of pixels, then it is considered to be noise-dominated and hence unusable.
| Quadrant | # 1 sec bins | Bins with >0 counts | Bins with >2000 counts | High rate bins dominated by noise | Noise dominated (total time) | Noise dominated (detector-on time) | Marked lightcurve |
|---|---|---|---|---|---|---|---|
| A | 9085 | 7842 | 1285 | 1285 | 14.14% | 16.39% | 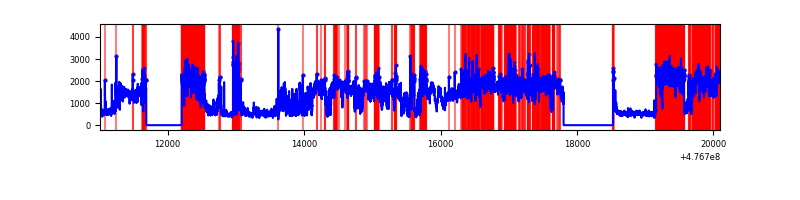 |
| B | 9085 | 7842 | 433 | 433 | 4.77% | 5.52% | 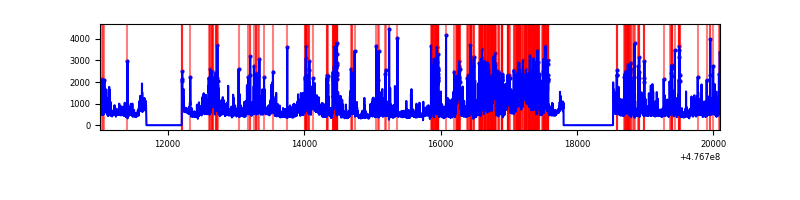 |
| C | 9085 | 7842 | 506 | 506 | 5.57% | 6.45% | 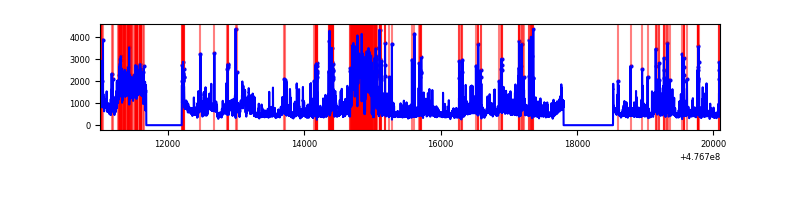 |
| D | 9085 | 7842 | 168 | 168 | 1.85% | 2.14% | 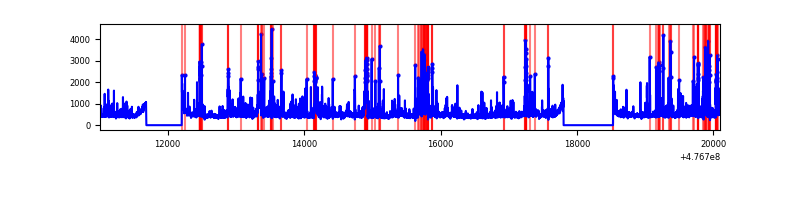 |
Top three noisy pixels from each quadrant. If the there are fewer than three noisy pixels in the level2.evt file, extra rows are filled as -1
| Pixel properties | Quadrant properties | ||||||
|---|---|---|---|---|---|---|---|
| Quadrant | DetID | PixID | Counts | Sigma | Mean | Median | Sigma |
| A | 12 | 80 | 6350154 | 31736.75 | 811 | 789 | 200.1 |
| A | 9 | 191 | 220543 | 1098.42 | 811 | 789 | 200.1 |
| A | 12 | 250 | 216632 | 1078.87 | 811 | 789 | 200.1 |
| B | 3 | 249 | 666207 | 3784.76 | 826 | 797 | 175.8 |
| B | 0 | 229 | 611038 | 3470.97 | 826 | 797 | 175.8 |
| B | 4 | 206 | 538831 | 3060.27 | 826 | 797 | 175.8 |
| C | 15 | 1 | 1295354 | 5714.52 | 814 | 807 | 226.5 |
| C | 0 | 224 | 671530 | 2960.77 | 814 | 807 | 226.5 |
| C | 15 | 174 | 338165 | 1489.2 | 814 | 807 | 226.5 |
| D | 2 | 153 | 367625 | 1625.63 | 824 | 798 | 225.7 |
| D | 2 | 249 | 196639 | 867.89 | 824 | 798 | 225.7 |
| D | 7 | 110 | 160576 | 708.07 | 824 | 798 | 225.7 |
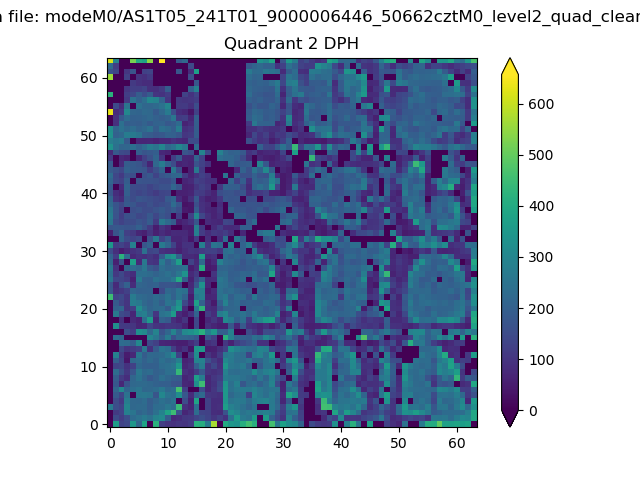
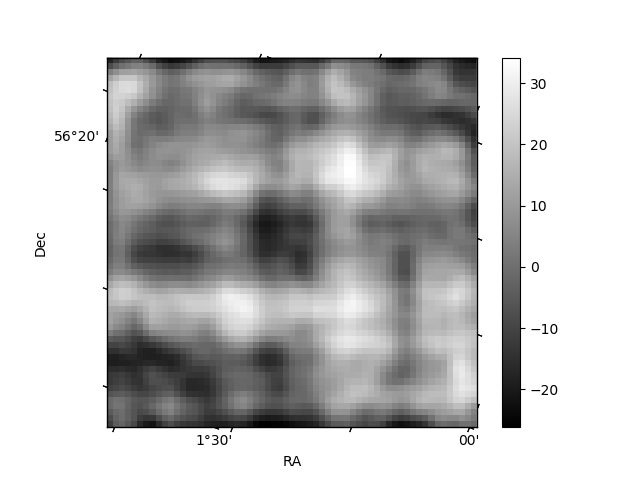
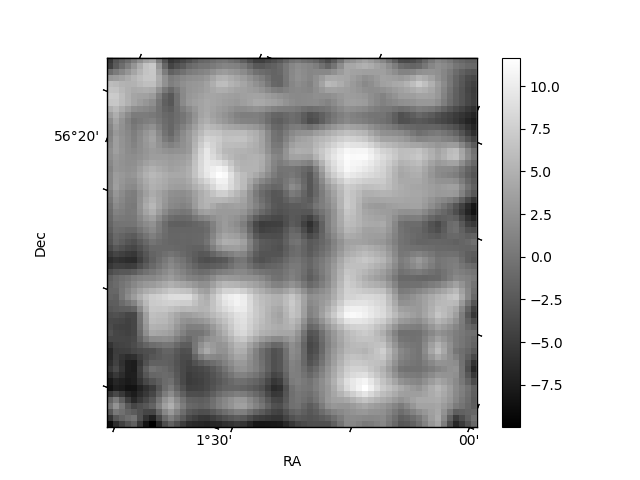
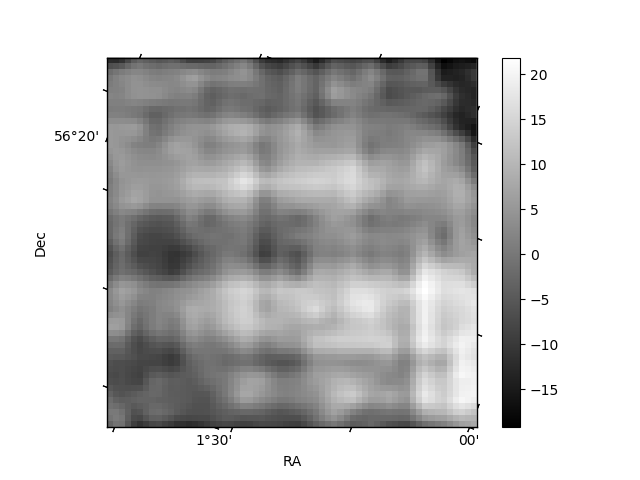
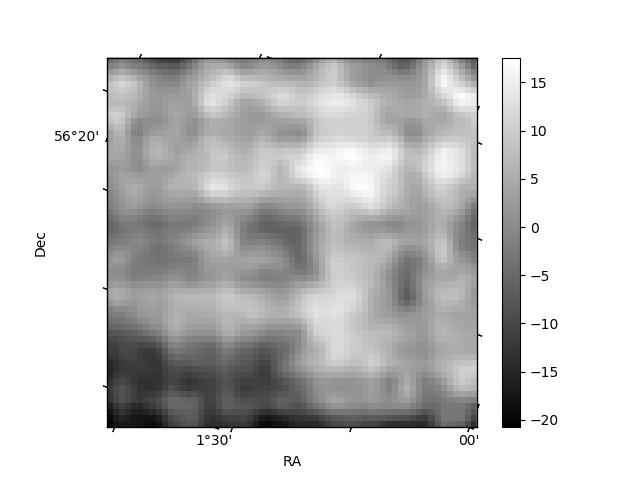
Histogram calculated using DETX and DETY for each event in the final _common_clean file
| Quadrant A | 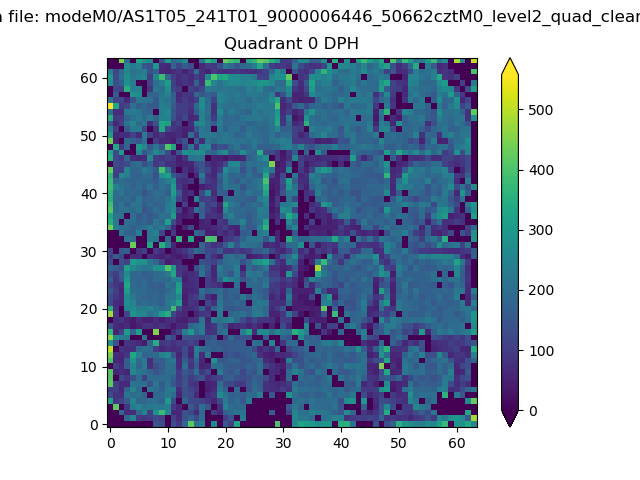 |
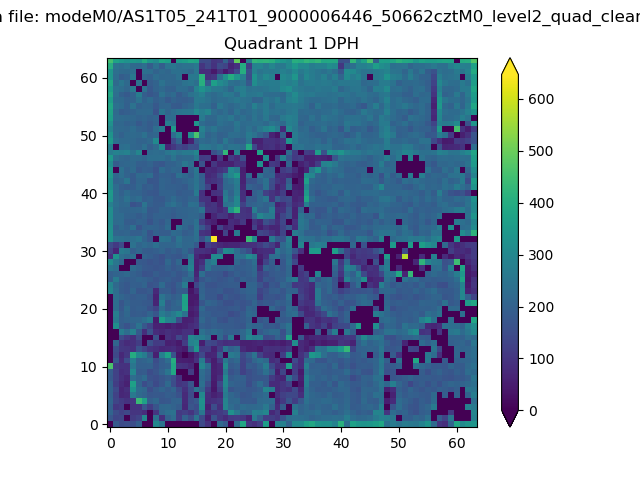 |
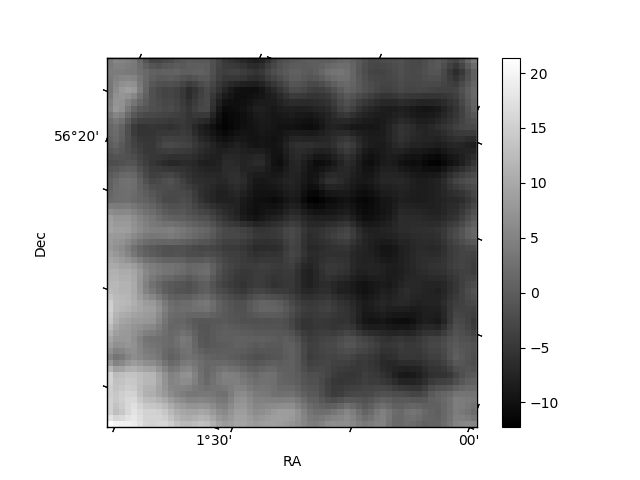
Quadrant B |
|---|---|---|---|
| Quadrant D | 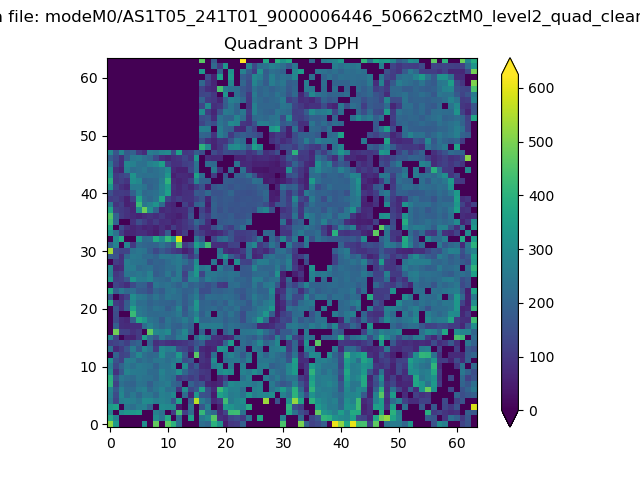 |
 |
Quadrant C |
| Plot type | Count rate plots | Images |
|---|---|---|
| Comparison with Poisson distribution Blue bars denote a histogram of data divided into 1 sec bins. Red curve is a Poisson curve with rate = median count rate of data. |
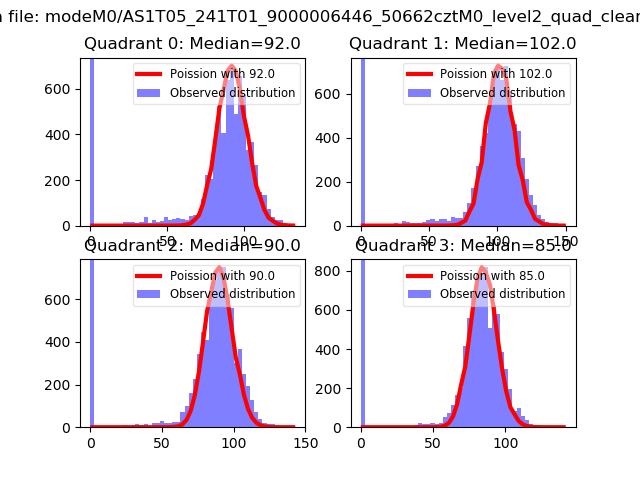 |
 |
| Quadrant-wise count rates Data is divided into 100 sec bins |
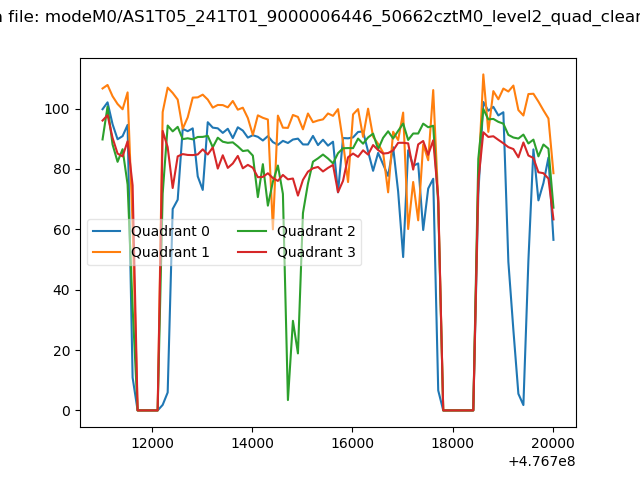 |
|
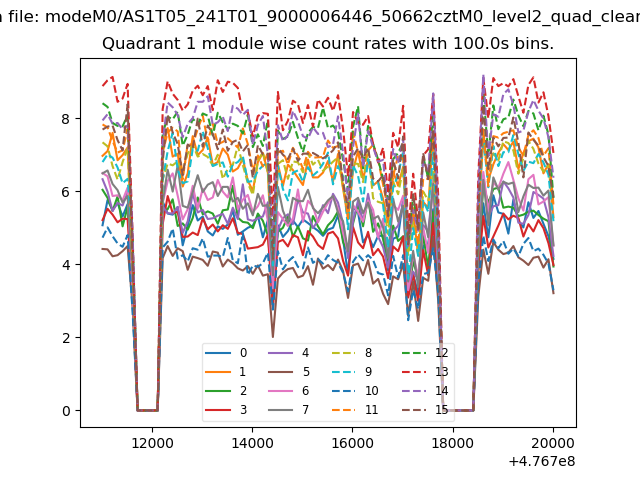
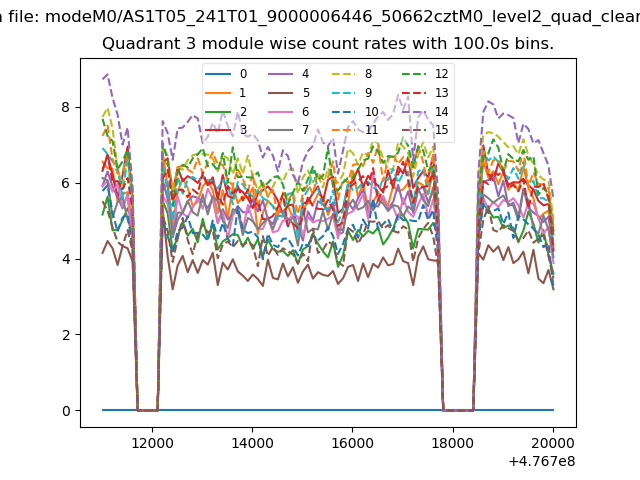
| Module-wise count rates for Quadrant A Data is divided into 100 sec bins |
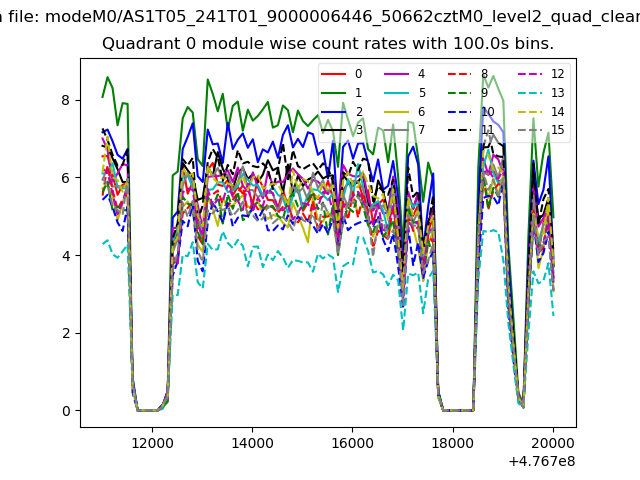 |
 |
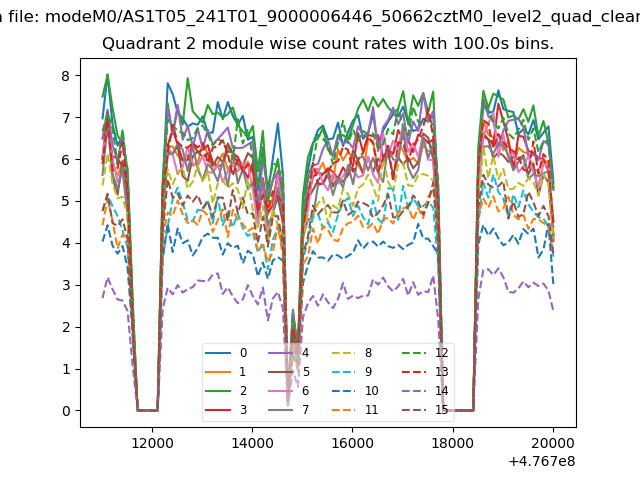
| Module-wise count rates for Quadrant B Data is divided into 100 sec bins |
 |
 |
| Module-wise count rates for Quadrant C Data is divided into 100 sec bins |
 |
 |
| Module-wise count rates for Quadrant D Data is divided into 100 sec bins |
 |
 |
| Parameter | Plot |
|---|---|
| CZT HV Monitor | 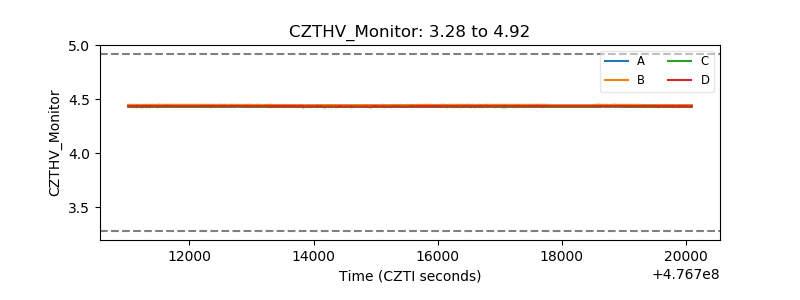 |
| D_VDD | 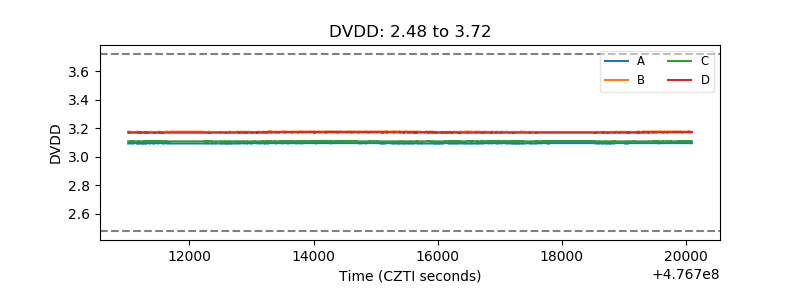 |
| Temperature 1 | 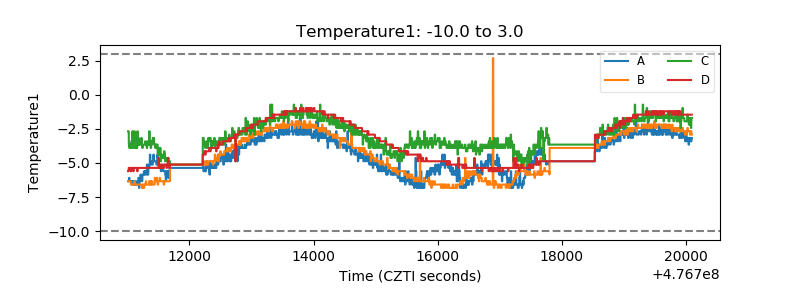 |
| Veto HV Monitor |  |
| Veto LLD | 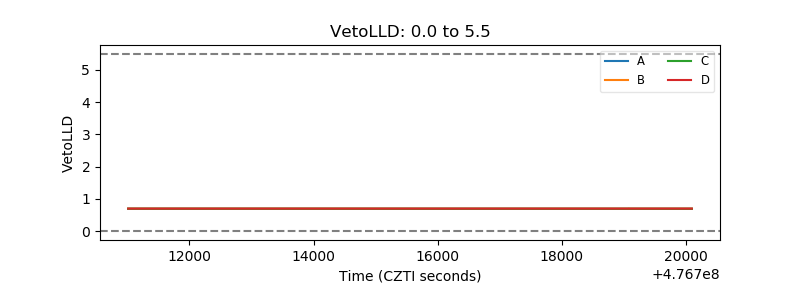 |
| Alpha Counter | 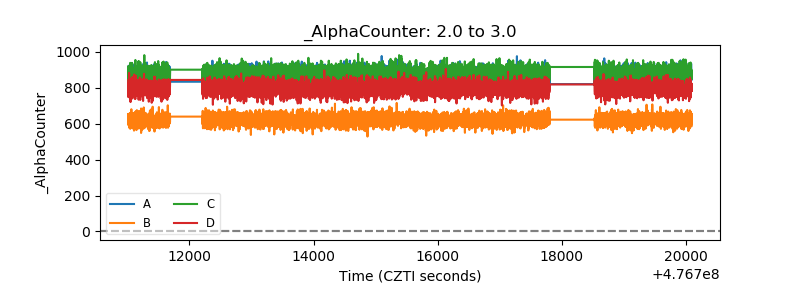 |
| _CPM_Rate | 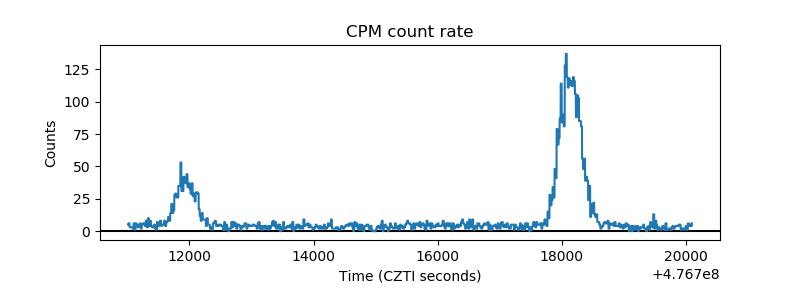 |
| CZT Counter | 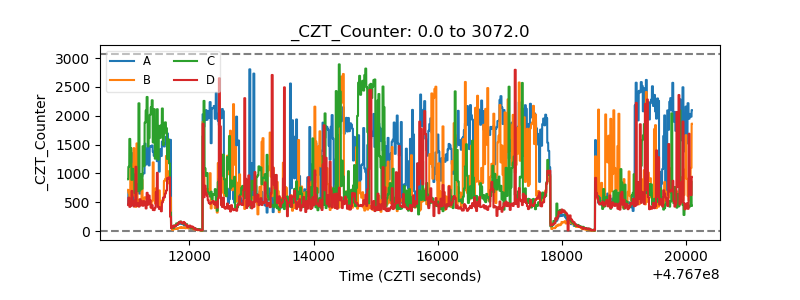 |
| +2.5 Volts monitor | 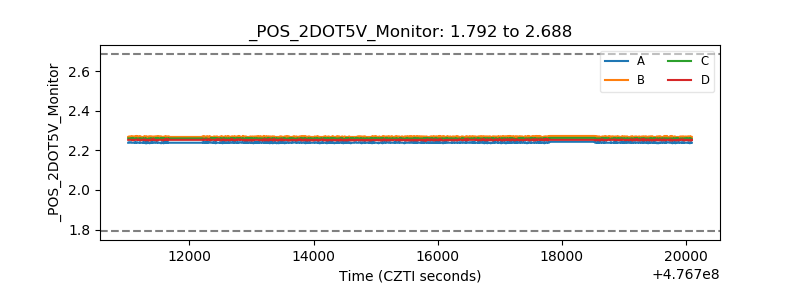 |
| +5 Volts monitor | 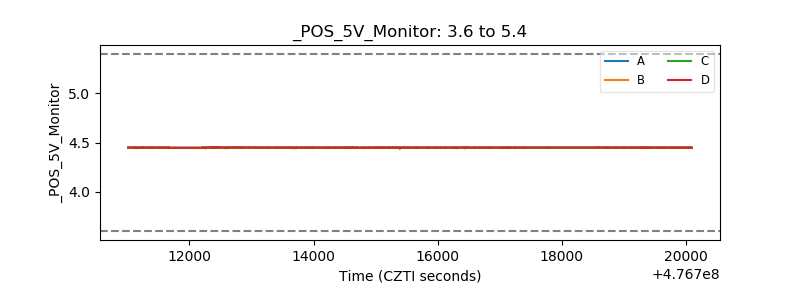 |
| _ROLL_ROT | 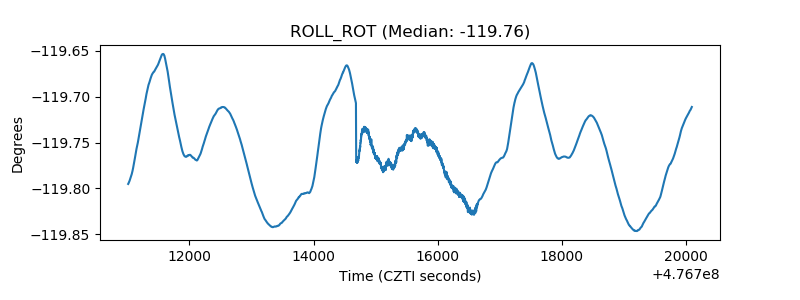 |
| _Roll_DEC | 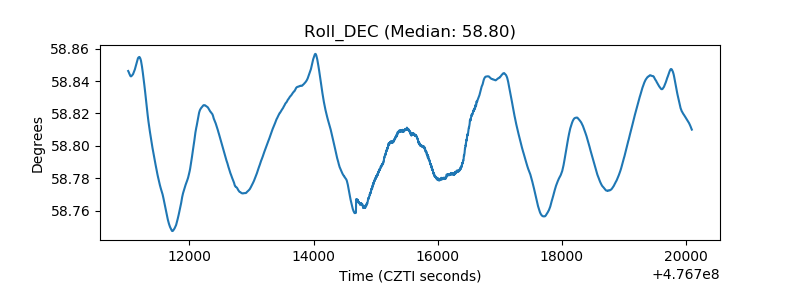 |
| _Roll_RA | 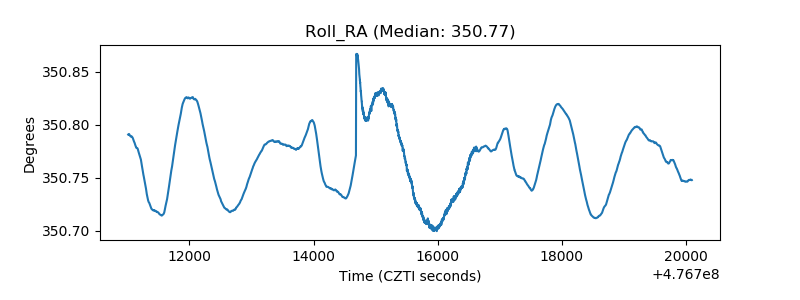 |
| Veto Counter | 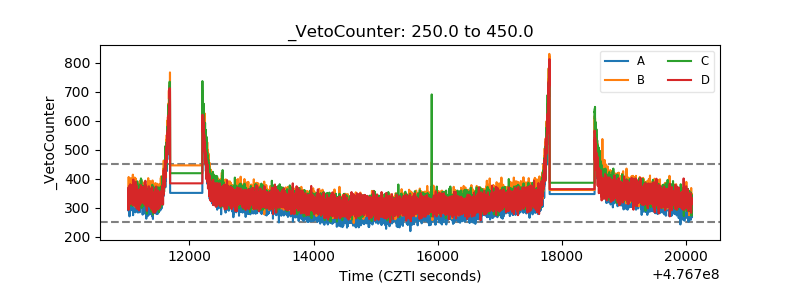 |