| Param | Original file | Final file |
|---|---|---|
| Filename | modeM0/AS1T05_241T01_9000006446_50663cztM0_level2.fits | modeM0/AS1T05_241T01_9000006446_50663cztM0_level2_quad_clean.evt |
| Size (bytes) | 521,441,280 | 88,136,640 |
| Size | 497.3 MB | 84.1 MB |
| Events in quadrant A | 6,335,250 | 524,730 |
| Events in quadrant B | 3,882,885 | 633,354 |
| Events in quadrant C | 4,854,546 | 545,074 |
| Events in quadrant D | 3,741,902 | 526,836 |
| Mode M9 | |||
|---|---|---|---|
| Quadrant | BADHDUFLAG | Total packets | Discarded packets |
| A | 0 | 9 | 0 |
| B | 0 | 9 | 0 |
| C | 0 | 9 | 0 |
| D | 0 | 9 | 0 |
| Mode M0 | |||
|---|---|---|---|
| Quadrant | BADHDUFLAG | Total packets | Discarded packets |
| A | 0 | 23149 | 1 |
| B | 0 | 15838 | 1 |
| C | 0 | 18726 | 1 |
| D | 0 | 15580 | 1 |
| Mode SS | |||
|---|---|---|---|
| Quadrant | BADHDUFLAG | Total packets | Discarded packets |
| A | 0 | 128 | 0 |
| B | 0 | 128 | 0 |
| C | 0 | 128 | 0 |
| D | 0 | 128 | 0 |
| Quadrant | Total seconds | Saturated seconds | Saturation percentage |
|---|---|---|---|
| A | 6281 | 878 | 13.978666% |
| B | 6282 | 171 | 2.722063% |
| C | 6282 | 356 | 5.666985% |
| D | 6281 | 170 | 2.706575% |
Noise dominated data is calculated using 1-second bins in cleaned event files. If a bin has >2000 counts, and if more than 50% of those come from <1% of pixels, then it is considered to be noise-dominated and hence unusable.
| Quadrant | # 1 sec bins | Bins with >0 counts | Bins with >2000 counts | High rate bins dominated by noise | Noise dominated (total time) | Noise dominated (detector-on time) | Marked lightcurve |
|---|---|---|---|---|---|---|---|
| A | 7166 | 6281 | 859 | 859 | 11.99% | 13.68% | 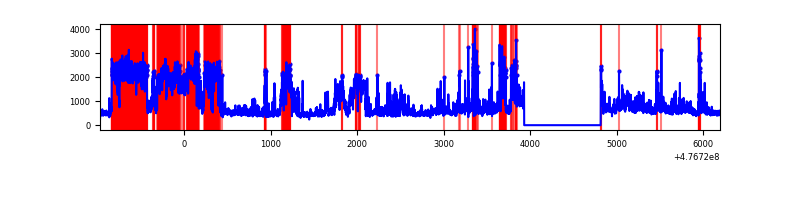 |
| B | 7167 | 6283 | 79 | 79 | 1.10% | 1.26% | 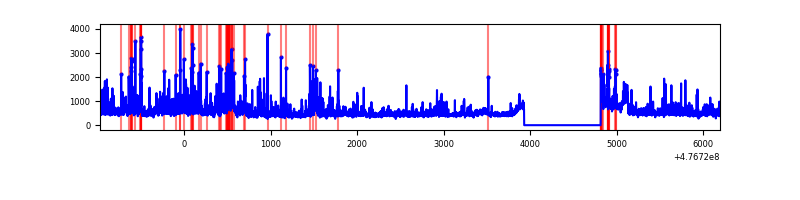 |
| C | 7167 | 6282 | 287 | 287 | 4.00% | 4.57% | 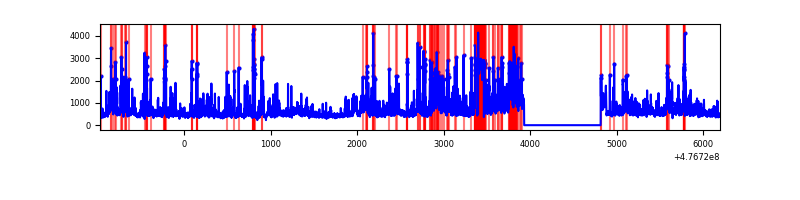 |
| D | 7166 | 6281 | 110 | 110 | 1.54% | 1.75% | 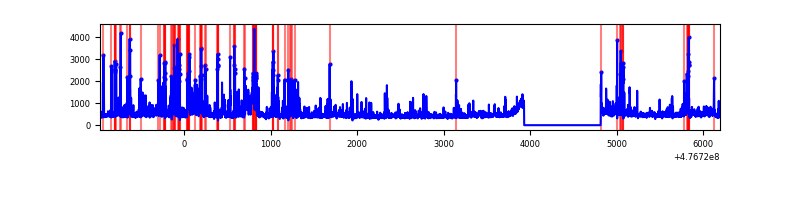 |
Top three noisy pixels from each quadrant. If the there are fewer than three noisy pixels in the level2.evt file, extra rows are filled as -1
| Pixel properties | Quadrant properties | ||||||
|---|---|---|---|---|---|---|---|
| Quadrant | DetID | PixID | Counts | Sigma | Mean | Median | Sigma |
| A | 12 | 80 | 2349113 | 14676.94 | 647 | 632 | 160.0 |
| A | 9 | 191 | 582584 | 3636.94 | 647 | 632 | 160.0 |
| A | 4 | 3 | 150798 | 938.47 | 647 | 632 | 160.0 |
| B | 4 | 170 | 223044 | 1596.8 | 660 | 640 | 139.3 |
| B | 5 | 185 | 217626 | 1557.9 | 660 | 640 | 139.3 |
| B | 4 | 206 | 181339 | 1297.37 | 660 | 640 | 139.3 |
| C | 0 | 224 | 993947 | 5559.78 | 638 | 629 | 178.7 |
| C | 15 | 1 | 318433 | 1778.81 | 638 | 629 | 178.7 |
| C | 15 | 174 | 187534 | 1046.14 | 638 | 629 | 178.7 |
| D | 2 | 153 | 433131 | 2404.36 | 646 | 624 | 179.9 |
| D | 15 | 108 | 134037 | 741.66 | 646 | 624 | 179.9 |
| D | 2 | 249 | 110522 | 610.94 | 646 | 624 | 179.9 |
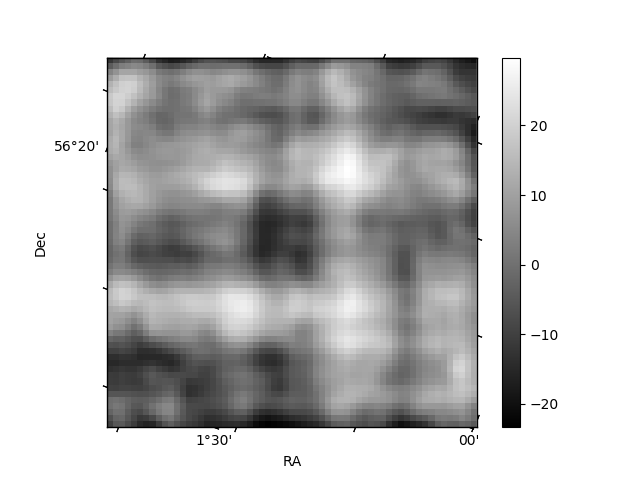
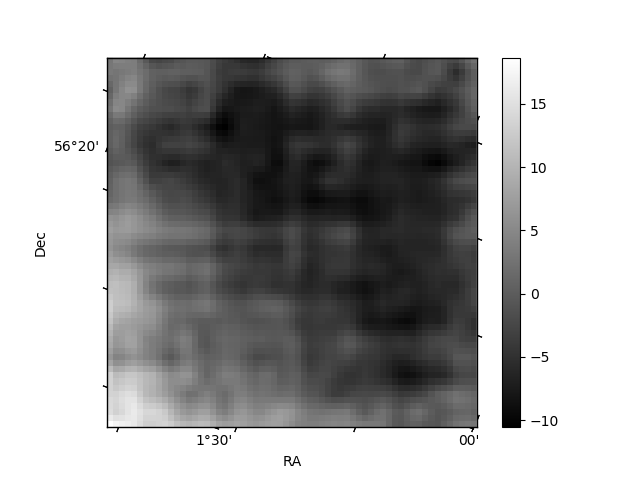
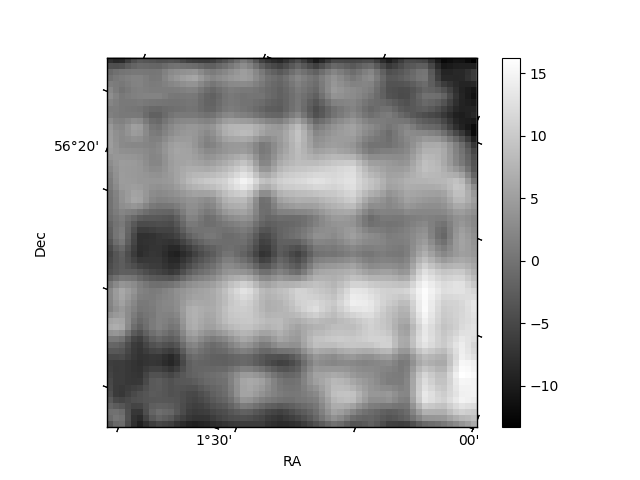
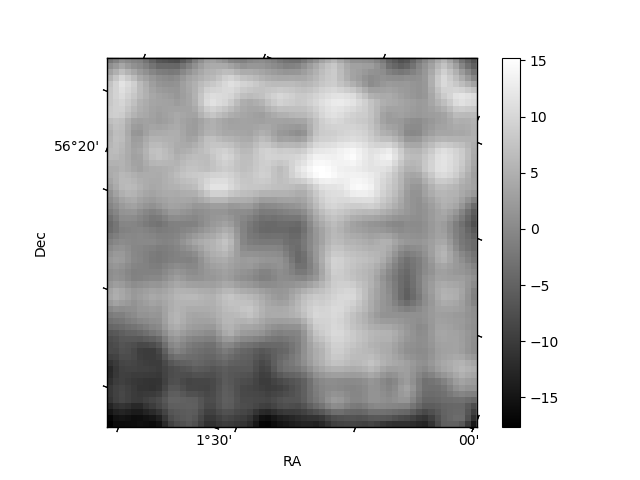
Histogram calculated using DETX and DETY for each event in the final _common_clean file
| Quadrant A | 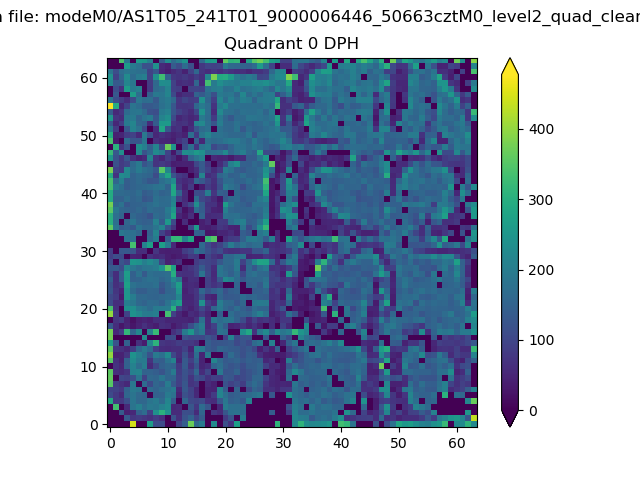 |
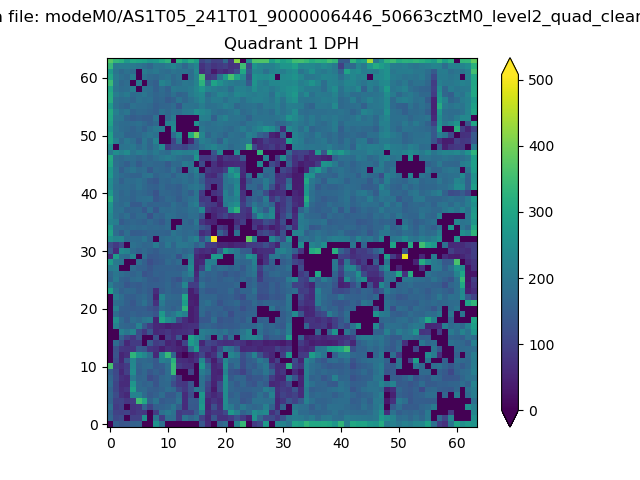 |
Quadrant B |
|---|---|---|---|
| Quadrant D | 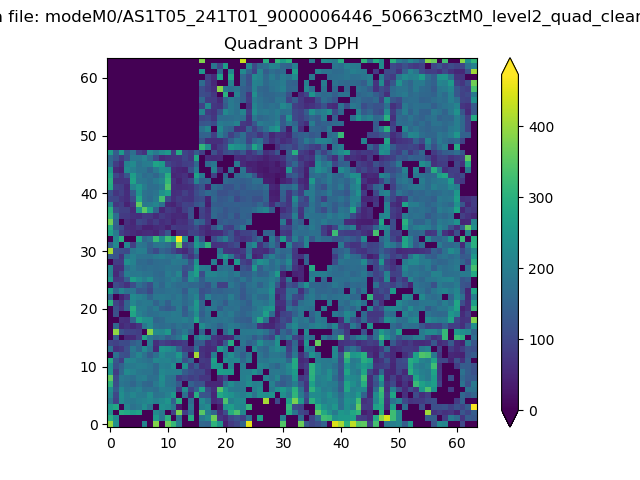 |
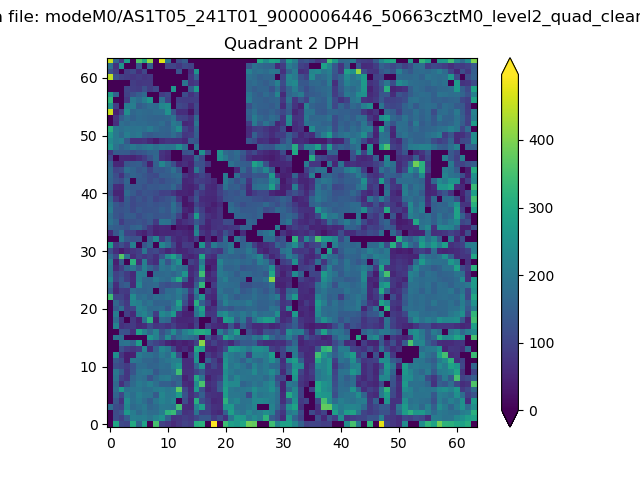 |
Quadrant C |
| Plot type | Count rate plots | Images |
|---|---|---|
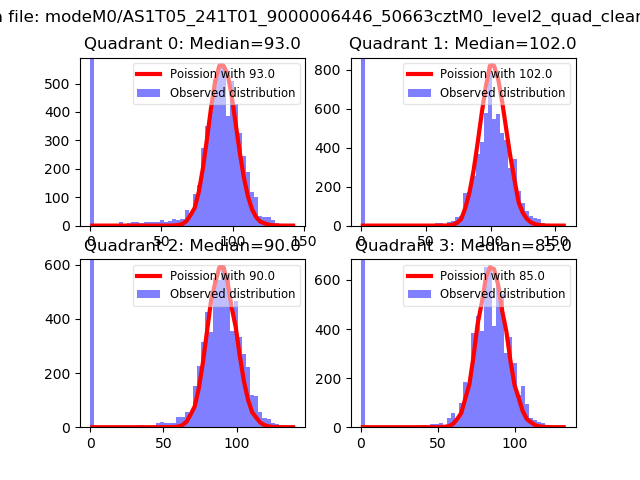
| Comparison with Poisson distribution Blue bars denote a histogram of data divided into 1 sec bins. Red curve is a Poisson curve with rate = median count rate of data. |
 |
 |
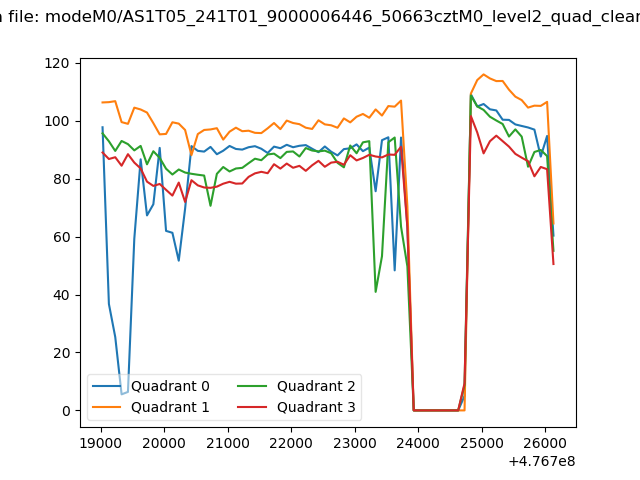
| Quadrant-wise count rates Data is divided into 100 sec bins |
 |
|
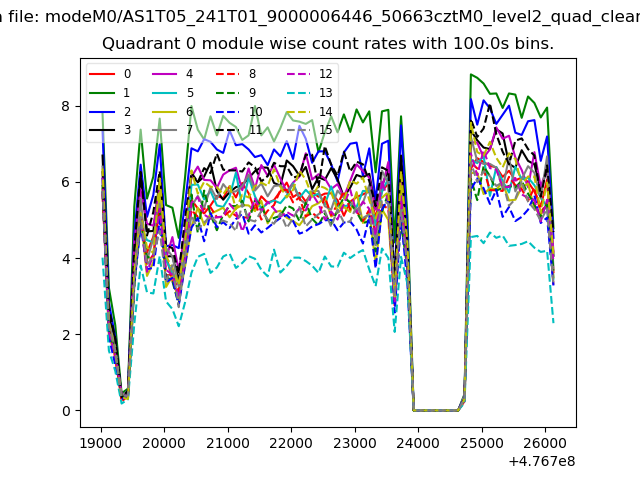
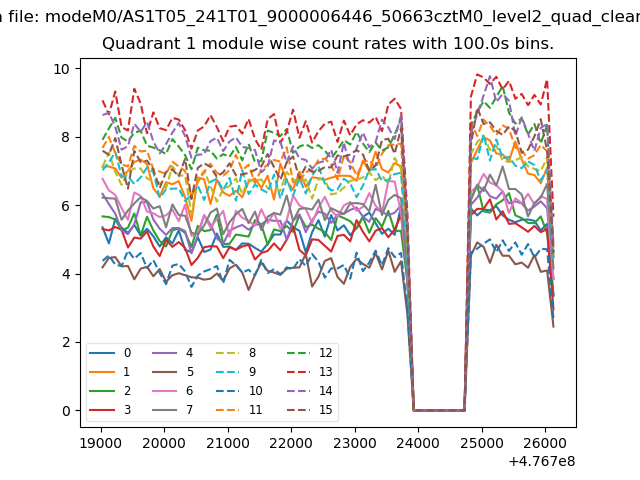
| Module-wise count rates for Quadrant A Data is divided into 100 sec bins |
 |
 |
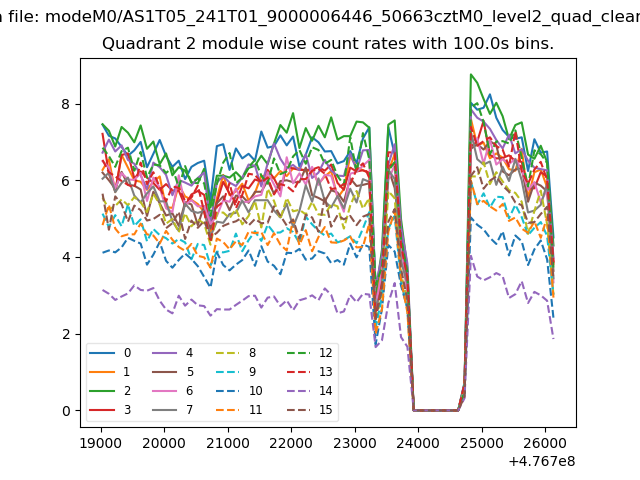
| Module-wise count rates for Quadrant B Data is divided into 100 sec bins |
 |
 |
| Module-wise count rates for Quadrant C Data is divided into 100 sec bins |
 |
 |
| Module-wise count rates for Quadrant D Data is divided into 100 sec bins |
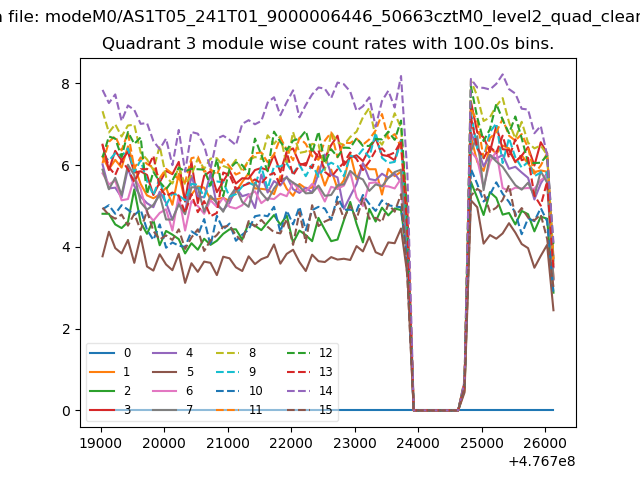 |
 |
| Parameter | Plot |
|---|---|
| CZT HV Monitor | 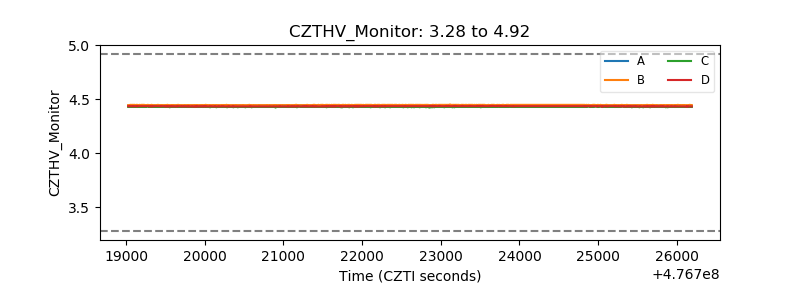 |
| D_VDD | 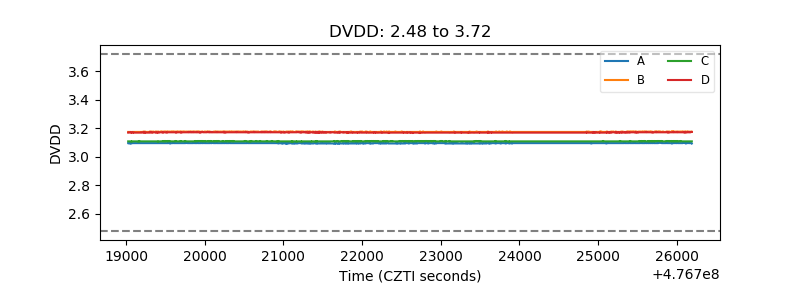 |
| Temperature 1 | 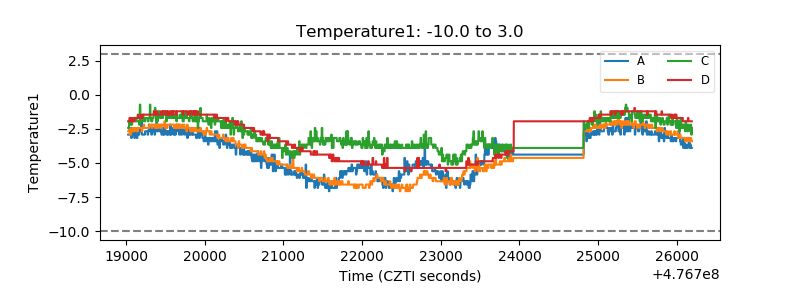 |
| Veto HV Monitor | 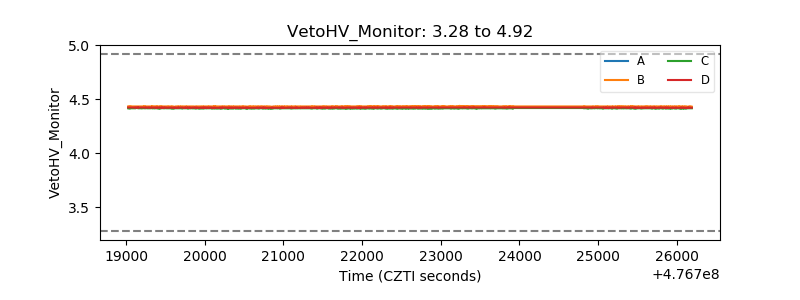 |
| Veto LLD | 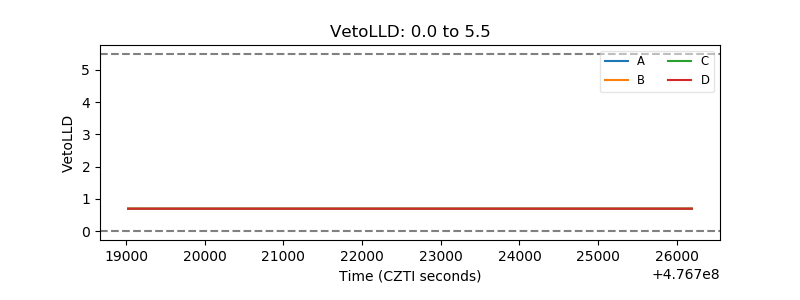 |
| Alpha Counter | 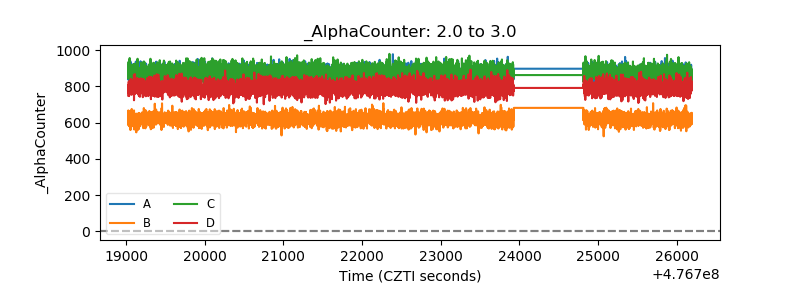 |
| _CPM_Rate | 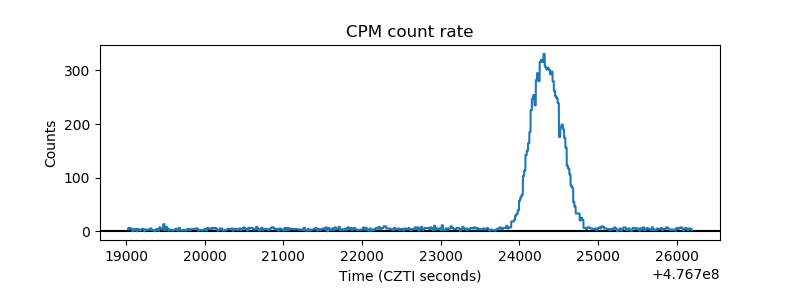 |
| CZT Counter | 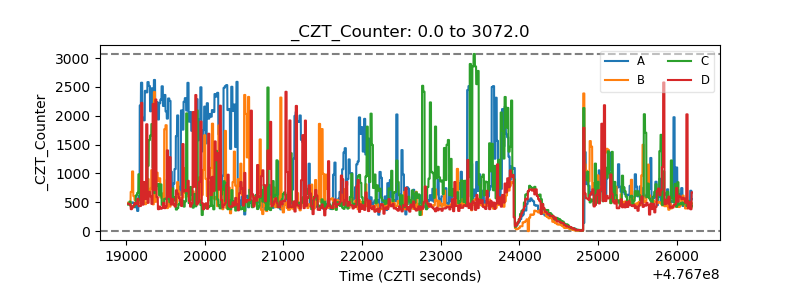 |
| +2.5 Volts monitor |  |
| +5 Volts monitor |  |
| _ROLL_ROT | 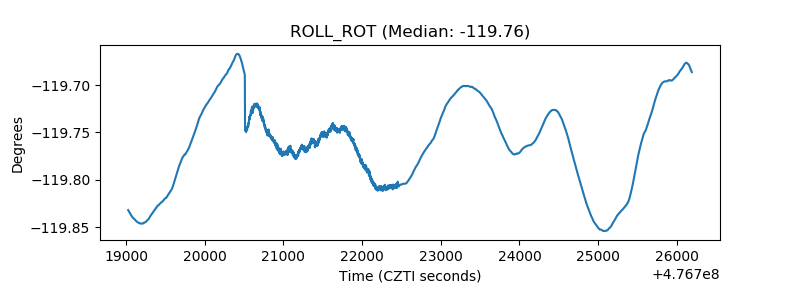 |
| _Roll_DEC | 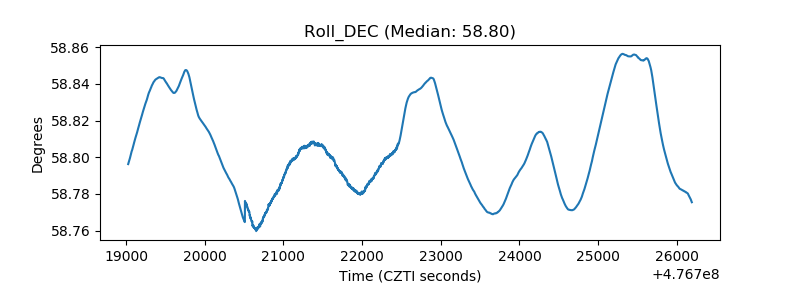 |
| _Roll_RA | 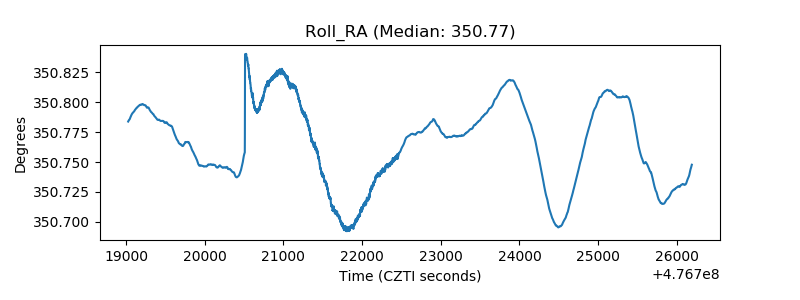 |
| Veto Counter | 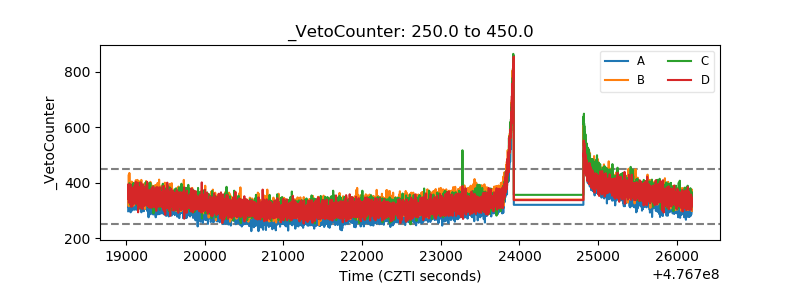 |