| Param | Original file | Final file |
|---|---|---|
| Filename | modeM0/AS1T05_241T01_9000006446_50665cztM0_level2.fits | modeM0/AS1T05_241T01_9000006446_50665cztM0_level2_quad_clean.evt |
| Size (bytes) | 666,630,720 | 87,897,600 |
| Size | 635.7 MB | 83.8 MB |
| Events in quadrant A | 4,643,057 | 628,095 |
| Events in quadrant B | 10,064,387 | 403,458 |
| Events in quadrant C | 4,615,520 | 609,261 |
| Events in quadrant D | 4,838,495 | 557,662 |
| Mode M9 | |||
|---|---|---|---|
| Quadrant | BADHDUFLAG | Total packets | Discarded packets |
| A | 0 | 11 | 0 |
| B | 0 | 11 | 0 |
| C | 0 | 11 | 0 |
| D | 0 | 11 | 0 |
| Mode M0 | |||
|---|---|---|---|
| Quadrant | BADHDUFLAG | Total packets | Discarded packets |
| A | 0 | 18285 | 1 |
| B | 0 | 34388 | 1 |
| C | 0 | 18121 | 1 |
| D | 0 | 18988 | 1 |
| Mode SS | |||
|---|---|---|---|
| Quadrant | BADHDUFLAG | Total packets | Discarded packets |
| A | 0 | 134 | 0 |
| B | 0 | 134 | 0 |
| C | 0 | 134 | 0 |
| D | 0 | 134 | 0 |
| Quadrant | Total seconds | Saturated seconds | Saturation percentage |
|---|---|---|---|
| A | 6640 | 160 | 2.409639% |
| B | 6641 | 3030 | 45.625659% |
| C | 6641 | 175 | 2.635145% |
| D | 6641 | 344 | 5.179943% |
Noise dominated data is calculated using 1-second bins in cleaned event files. If a bin has >2000 counts, and if more than 50% of those come from <1% of pixels, then it is considered to be noise-dominated and hence unusable.
| Quadrant | # 1 sec bins | Bins with >0 counts | Bins with >2000 counts | High rate bins dominated by noise | Noise dominated (total time) | Noise dominated (detector-on time) | Marked lightcurve |
|---|---|---|---|---|---|---|---|
| A | 7695 | 6641 | 108 | 108 | 1.40% | 1.63% |  |
| B | 7696 | 6642 | 2535 | 2535 | 32.94% | 38.17% | 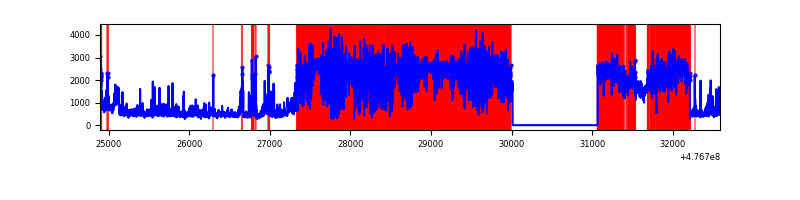 |
| C | 7696 | 6642 | 144 | 144 | 1.87% | 2.17% | 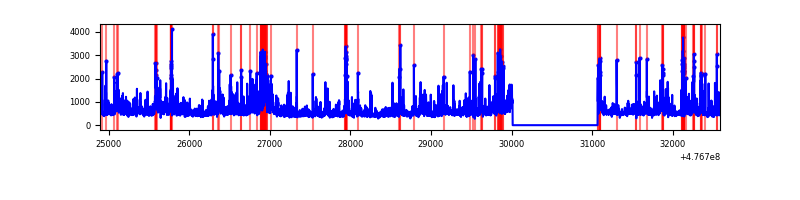 |
| D | 7696 | 6642 | 301 | 301 | 3.91% | 4.53% | 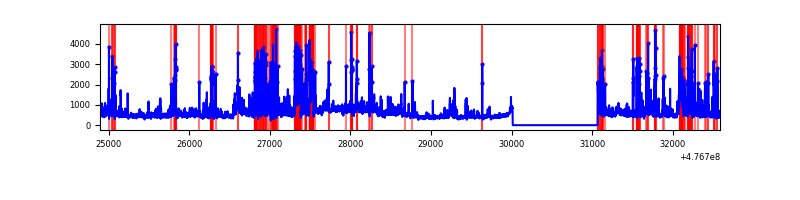 |
Top three noisy pixels from each quadrant. If the there are fewer than three noisy pixels in the level2.evt file, extra rows are filled as -1
| Pixel properties | Quadrant properties | ||||||
|---|---|---|---|---|---|---|---|
| Quadrant | DetID | PixID | Counts | Sigma | Mean | Median | Sigma |
| A | 9 | 191 | 788088 | 4579.45 | 702 | 686 | 171.9 |
| A | 4 | 220 | 170370 | 986.86 | 702 | 686 | 171.9 |
| A | 8 | 38 | 148313 | 858.58 | 702 | 686 | 171.9 |
| B | 4 | 170 | 4576109 | 38621.03 | 555 | 537 | 118.5 |
| B | 5 | 172 | 2058854 | 17373.64 | 555 | 537 | 118.5 |
| B | 3 | 249 | 515858 | 4349.67 | 555 | 537 | 118.5 |
| C | 0 | 224 | 670734 | 3555.92 | 693 | 688 | 188.4 |
| C | 13 | 113 | 239538 | 1267.57 | 693 | 688 | 188.4 |
| C | 15 | 231 | 239433 | 1267.01 | 693 | 688 | 188.4 |
| D | 10 | 102 | 1112708 | 5877.11 | 679 | 655 | 189.2 |
| D | 3 | 12 | 267691 | 1411.26 | 679 | 655 | 189.2 |
| D | 2 | 153 | 129137 | 679.02 | 679 | 655 | 189.2 |
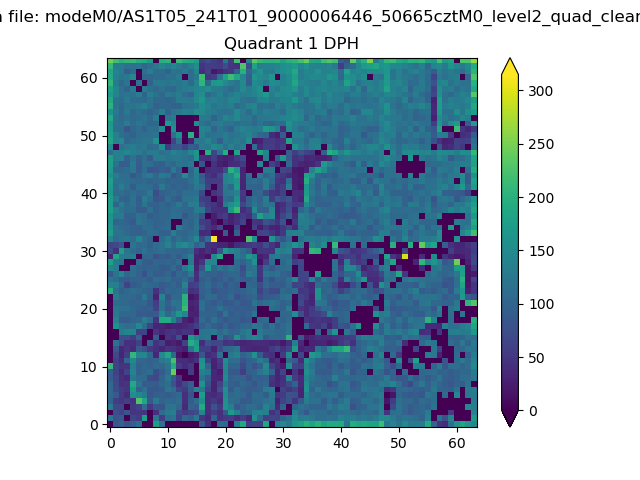
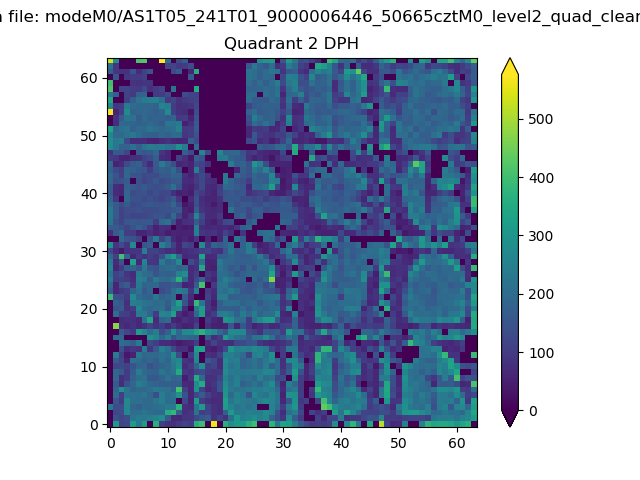
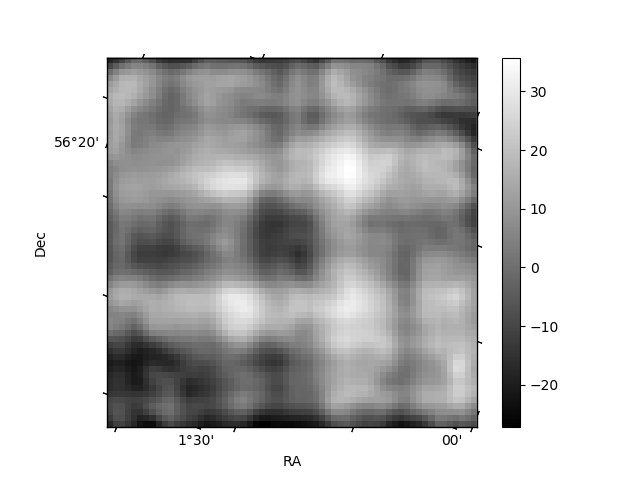
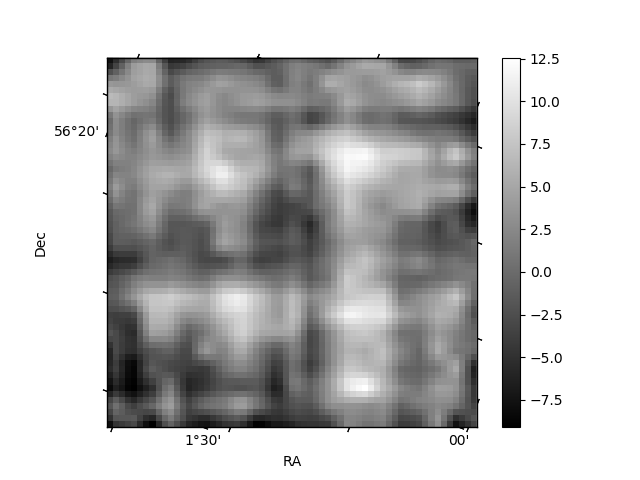
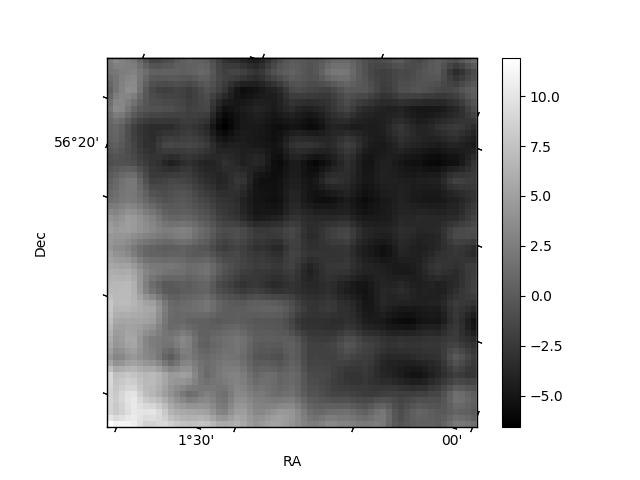
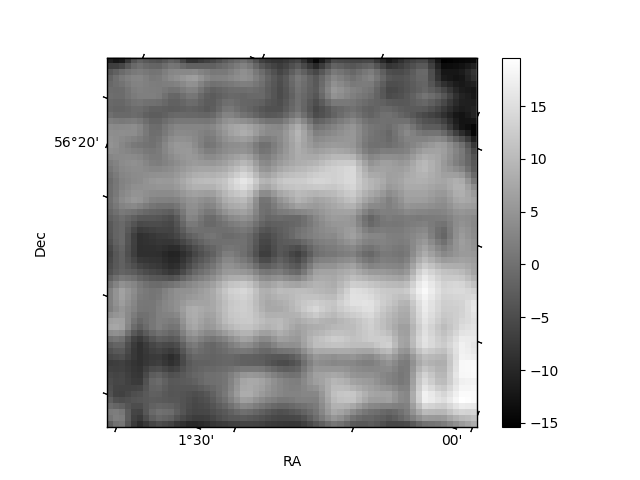
Histogram calculated using DETX and DETY for each event in the final _common_clean file
| Quadrant A | 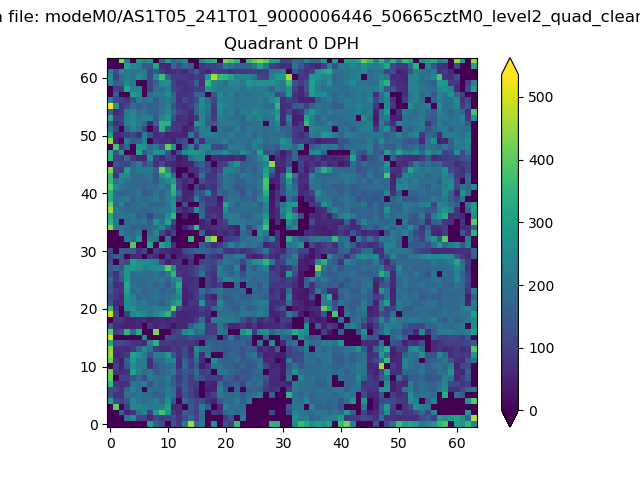 |
 |
Quadrant B |
|---|---|---|---|
| Quadrant D | 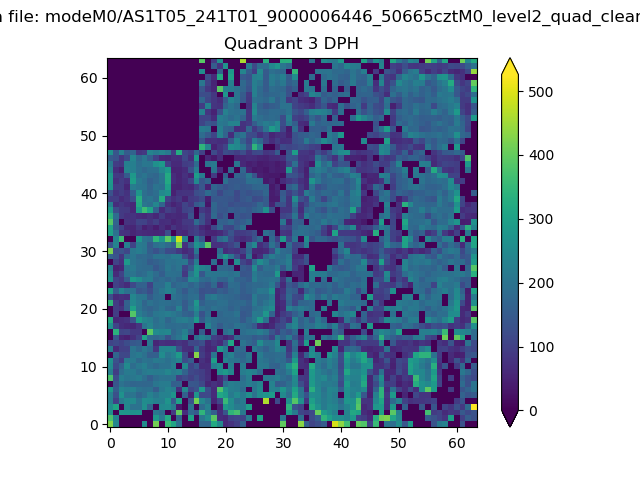 |
 |
Quadrant C |
| Plot type | Count rate plots | Images |
|---|---|---|
| Comparison with Poisson distribution Blue bars denote a histogram of data divided into 1 sec bins. Red curve is a Poisson curve with rate = median count rate of data. |
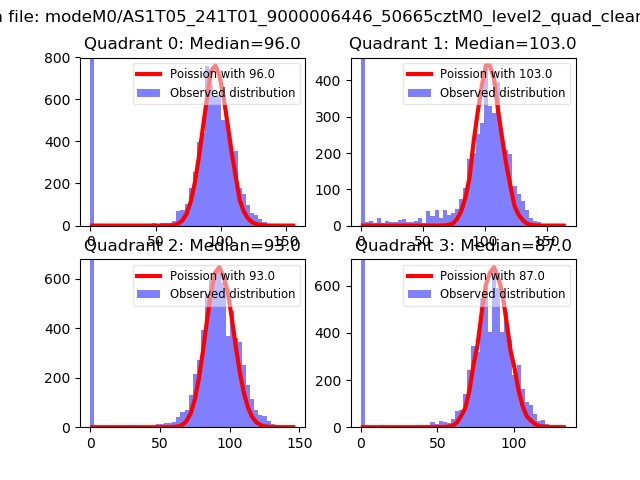 |
 |
| Quadrant-wise count rates Data is divided into 100 sec bins |
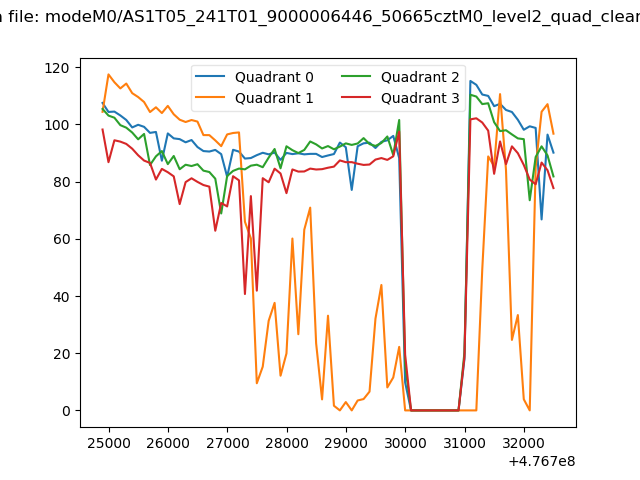 |
|
| Module-wise count rates for Quadrant A Data is divided into 100 sec bins |
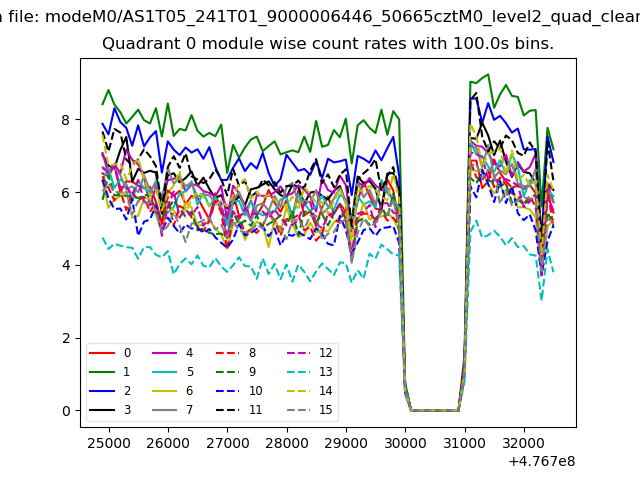 |
 |
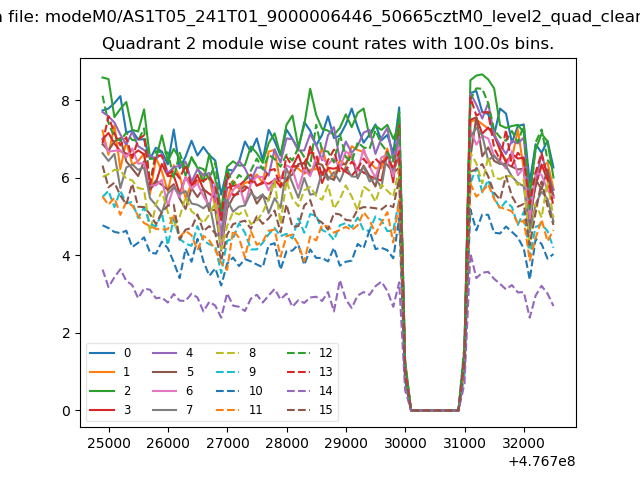
| Module-wise count rates for Quadrant B Data is divided into 100 sec bins |
 |
 |
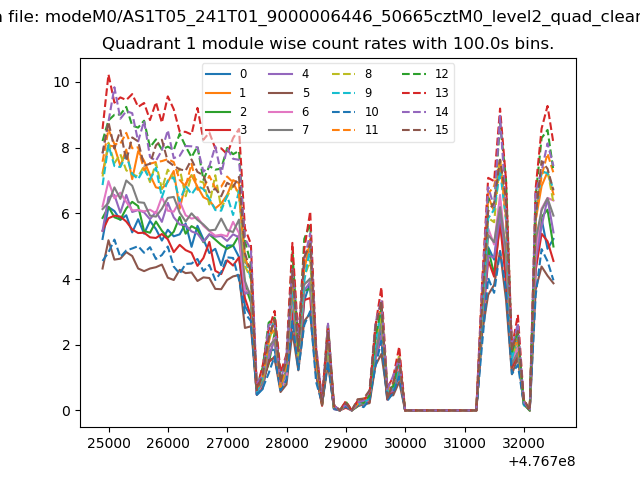
| Module-wise count rates for Quadrant C Data is divided into 100 sec bins |
 |
 |
| Module-wise count rates for Quadrant D Data is divided into 100 sec bins |
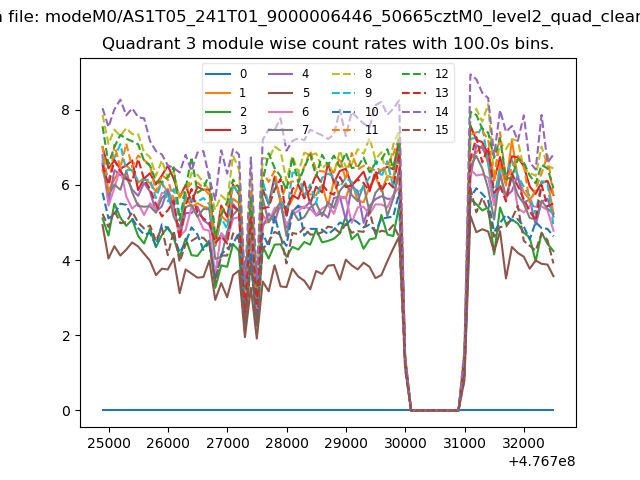 |
 |
| Parameter | Plot |
|---|---|
| CZT HV Monitor | 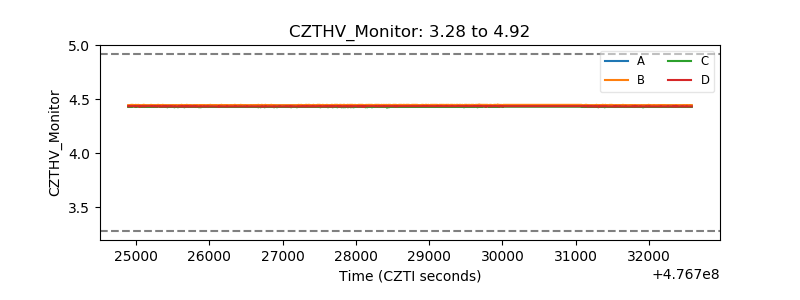 |
| D_VDD | 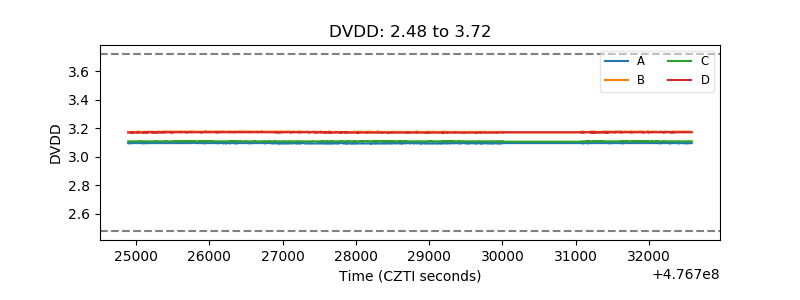 |
| Temperature 1 | 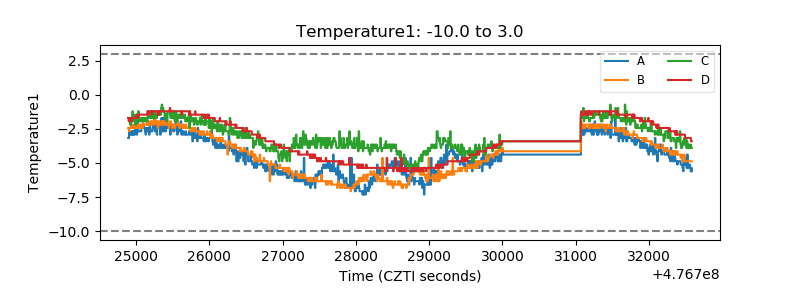 |
| Veto HV Monitor |  |
| Veto LLD | 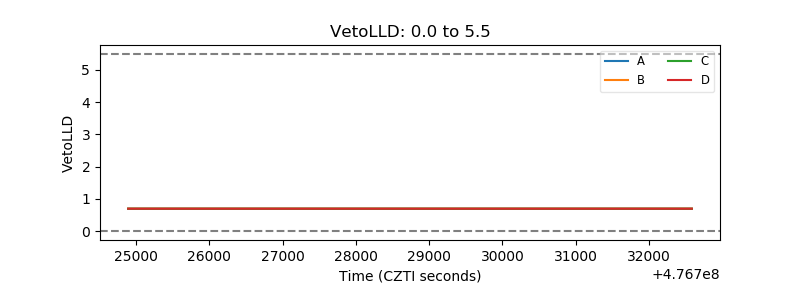 |
| Alpha Counter | 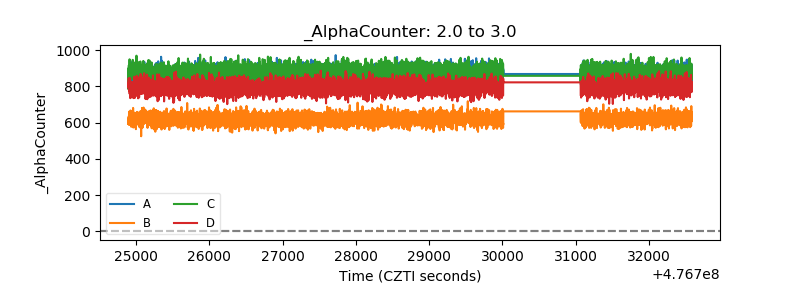 |
| _CPM_Rate | 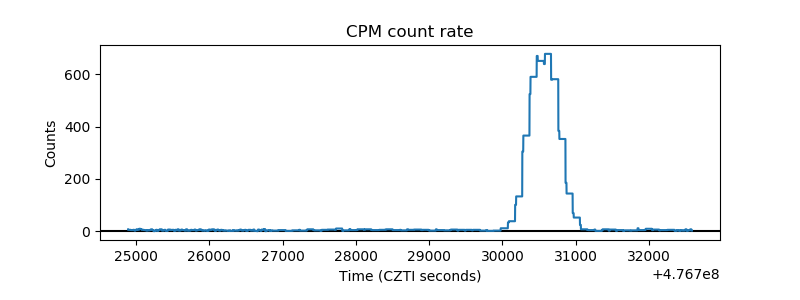 |
| CZT Counter | 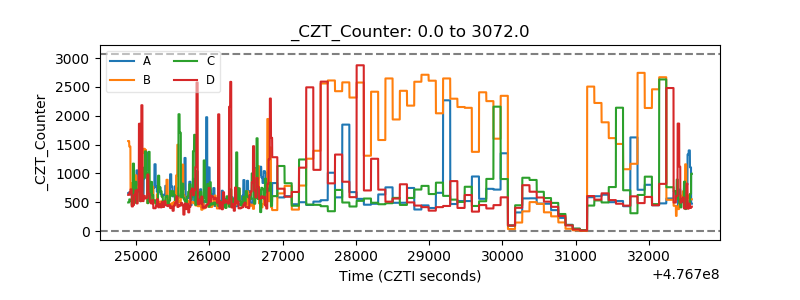 |
| +2.5 Volts monitor |  |
| +5 Volts monitor | 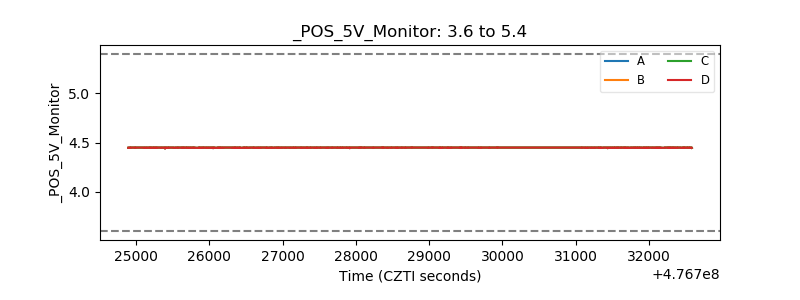 |
| _ROLL_ROT | 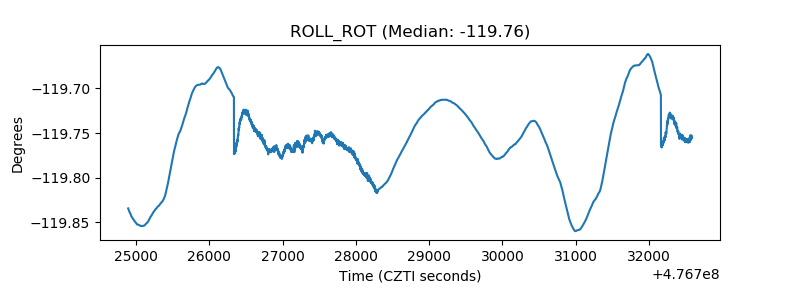 |
| _Roll_DEC | 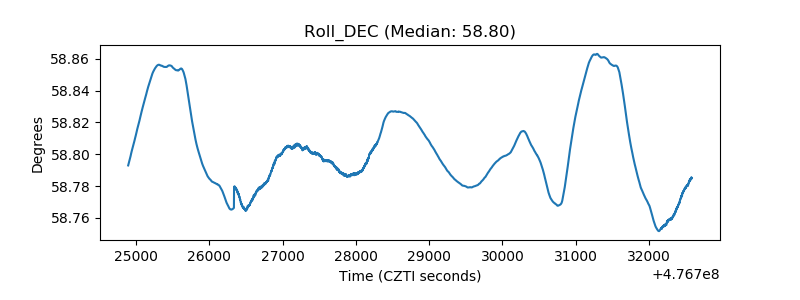 |
| _Roll_RA | 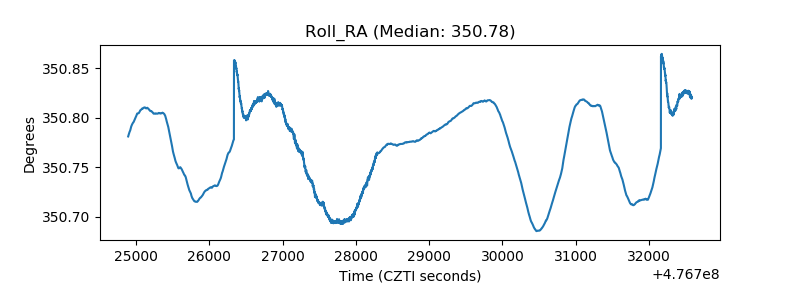 |
| Veto Counter | 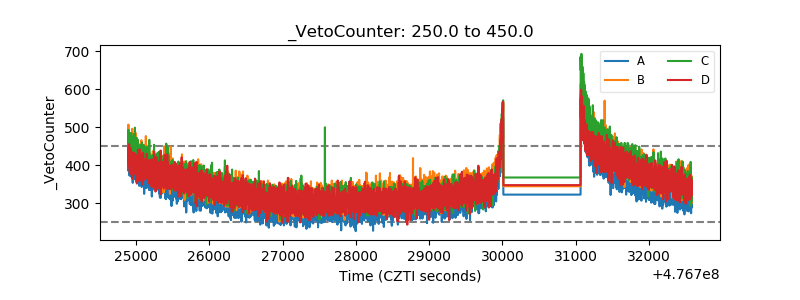 |