| Param | Original file | Final file |
|---|---|---|
| Filename | modeM0/AS1T05_241T01_9000006446_50667cztM0_level2.fits | modeM0/AS1T05_241T01_9000006446_50667cztM0_level2_quad_clean.evt |
| Size (bytes) | 477,204,480 | 96,603,840 |
| Size | 455.1 MB | 92.1 MB |
| Events in quadrant A | 4,743,138 | 615,813 |
| Events in quadrant B | 3,999,522 | 687,059 |
| Events in quadrant C | 4,656,529 | 609,648 |
| Events in quadrant D | 3,768,798 | 565,729 |
| Mode M9 | |||
|---|---|---|---|
| Quadrant | BADHDUFLAG | Total packets | Discarded packets |
| A | 0 | 12 | 0 |
| B | 0 | 12 | 0 |
| C | 0 | 13 | 0 |
| D | 0 | 13 | 0 |
| Mode M0 | |||
|---|---|---|---|
| Quadrant | BADHDUFLAG | Total packets | Discarded packets |
| A | 0 | 18492 | 2 |
| B | 0 | 16383 | 2 |
| C | 0 | 18177 | 2 |
| D | 0 | 15805 | 2 |
| Mode SS | |||
|---|---|---|---|
| Quadrant | BADHDUFLAG | Total packets | Discarded packets |
| A | 0 | 132 | 0 |
| B | 0 | 132 | 0 |
| C | 0 | 132 | 0 |
| D | 0 | 132 | 0 |
| Quadrant | Total seconds | Saturated seconds | Saturation percentage |
|---|---|---|---|
| A | 6398 | 302 | 4.720225% |
| B | 6398 | 223 | 3.485464% |
| C | 6398 | 235 | 3.673023% |
| D | 6398 | 213 | 3.329165% |
Noise dominated data is calculated using 1-second bins in cleaned event files. If a bin has >2000 counts, and if more than 50% of those come from <1% of pixels, then it is considered to be noise-dominated and hence unusable.
| Quadrant | # 1 sec bins | Bins with >0 counts | Bins with >2000 counts | High rate bins dominated by noise | Noise dominated (total time) | Noise dominated (detector-on time) | Marked lightcurve |
|---|---|---|---|---|---|---|---|
| A | 7588 | 6399 | 242 | 242 | 3.19% | 3.78% | 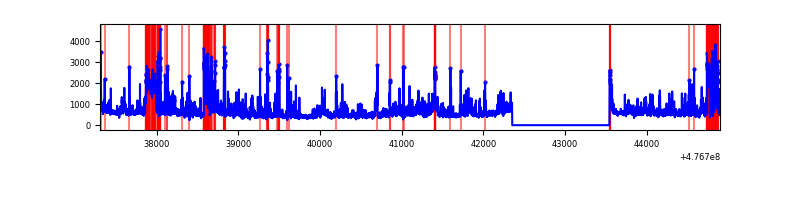 |
| B | 7588 | 6399 | 118 | 118 | 1.56% | 1.84% | 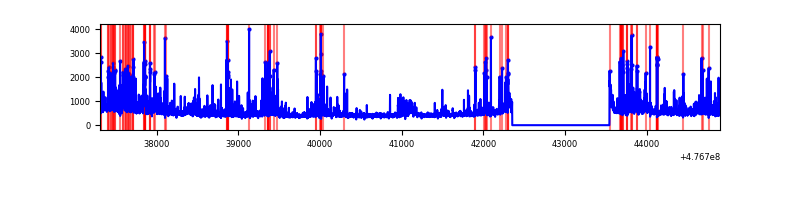 |
| C | 7588 | 6399 | 181 | 181 | 2.39% | 2.83% | 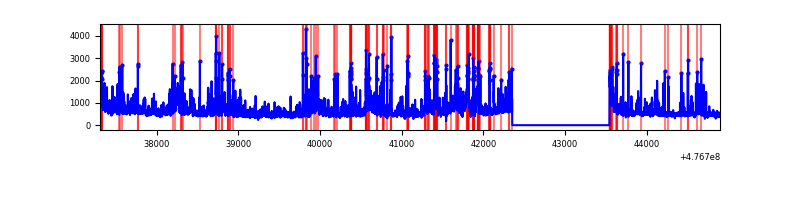 |
| D | 7588 | 6398 | 103 | 103 | 1.36% | 1.61% | 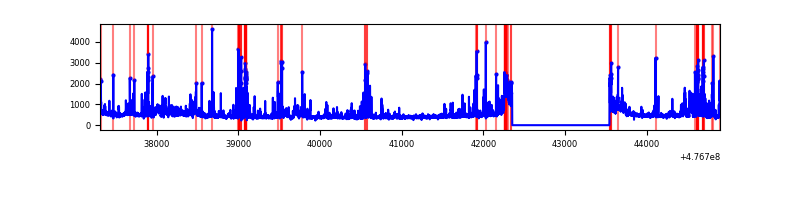 |
Top three noisy pixels from each quadrant. If the there are fewer than three noisy pixels in the level2.evt file, extra rows are filled as -1
| Pixel properties | Quadrant properties | ||||||
|---|---|---|---|---|---|---|---|
| Quadrant | DetID | PixID | Counts | Sigma | Mean | Median | Sigma |
| A | 9 | 191 | 602303 | 3535.85 | 685 | 671 | 170.2 |
| A | 8 | 38 | 416765 | 2445.43 | 685 | 671 | 170.2 |
| A | 12 | 113 | 312574 | 1833.08 | 685 | 671 | 170.2 |
| B | 4 | 170 | 301550 | 2045.6 | 692 | 669 | 147.1 |
| B | 5 | 185 | 205432 | 1392.12 | 692 | 669 | 147.1 |
| B | 0 | 229 | 188182 | 1274.85 | 692 | 669 | 147.1 |
| C | 15 | 174 | 449878 | 2379.28 | 686 | 680 | 188.8 |
| C | 15 | 231 | 333743 | 1764.15 | 686 | 680 | 188.8 |
| C | 0 | 224 | 330678 | 1747.91 | 686 | 680 | 188.8 |
| D | 10 | 102 | 223869 | 1186.13 | 674 | 649 | 188.2 |
| D | 7 | 96 | 181738 | 962.26 | 674 | 649 | 188.2 |
| D | 8 | 246 | 179757 | 951.73 | 674 | 649 | 188.2 |
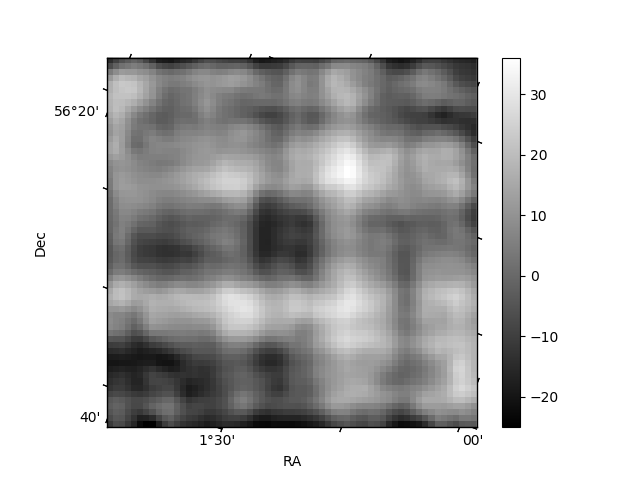
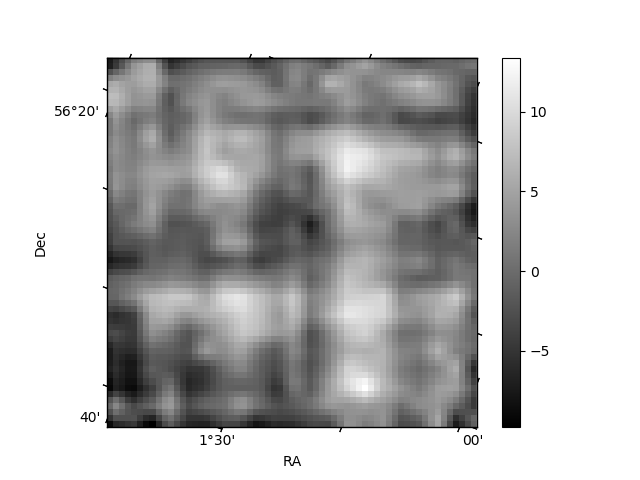
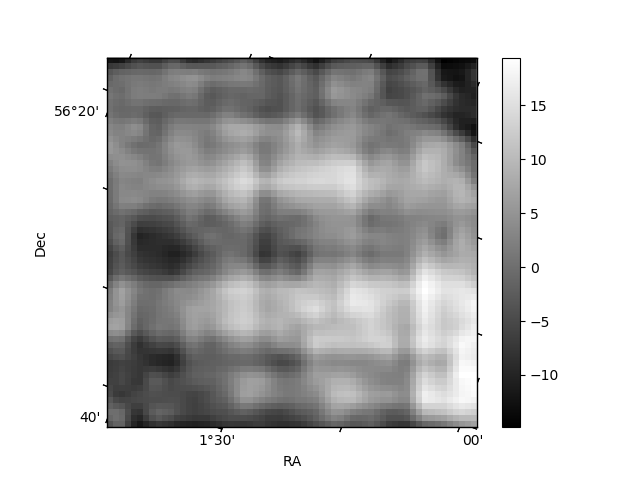
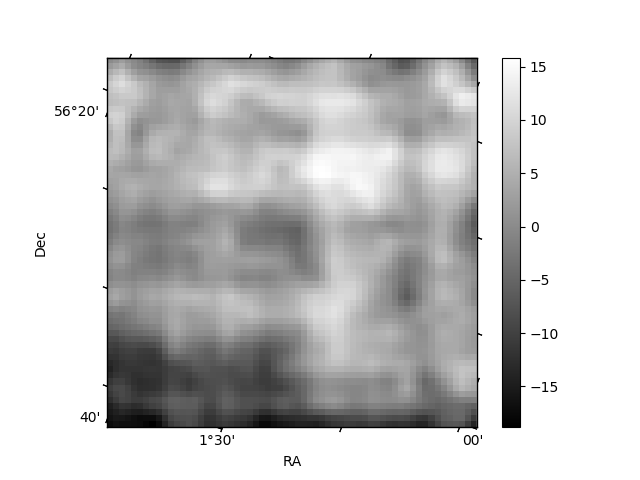
Histogram calculated using DETX and DETY for each event in the final _common_clean file
| Quadrant A | 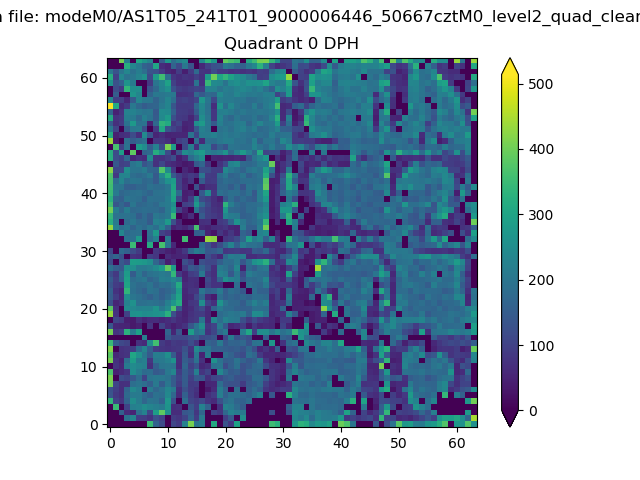 |
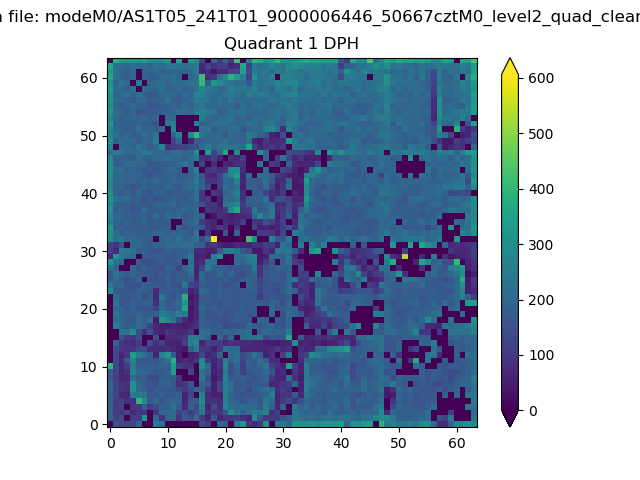 |
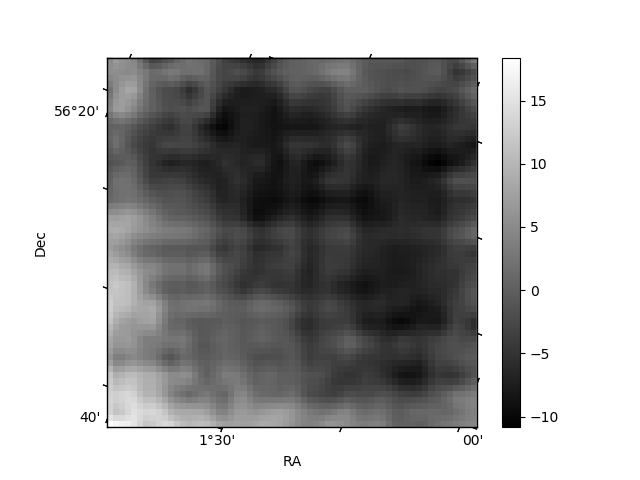
Quadrant B |
|---|---|---|---|
| Quadrant D | 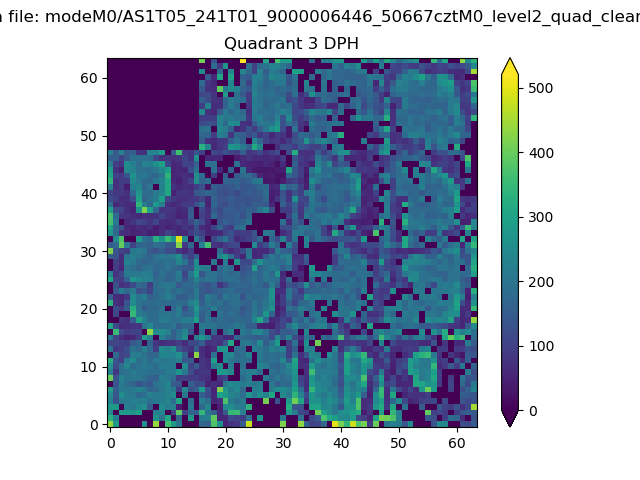 |
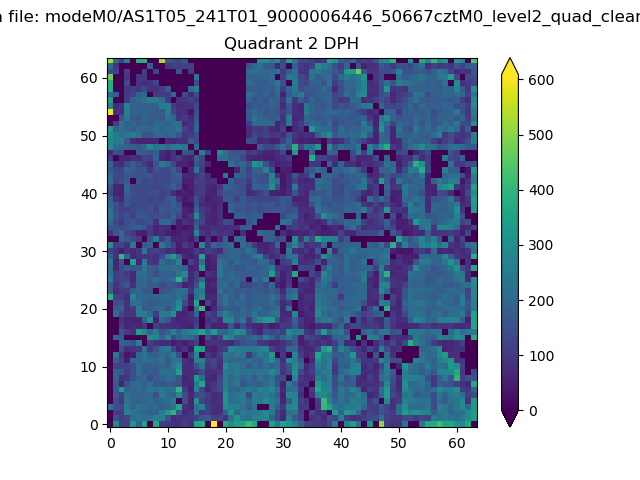 |
Quadrant C |
| Plot type | Count rate plots | Images |
|---|---|---|
| Comparison with Poisson distribution Blue bars denote a histogram of data divided into 1 sec bins. Red curve is a Poisson curve with rate = median count rate of data. |
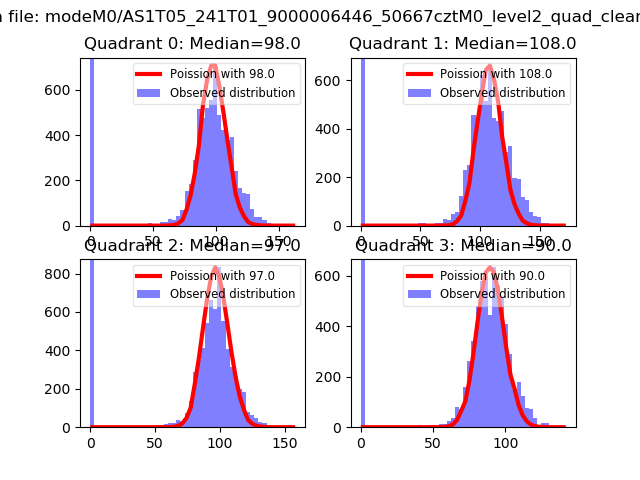 |
 |
| Quadrant-wise count rates Data is divided into 100 sec bins |
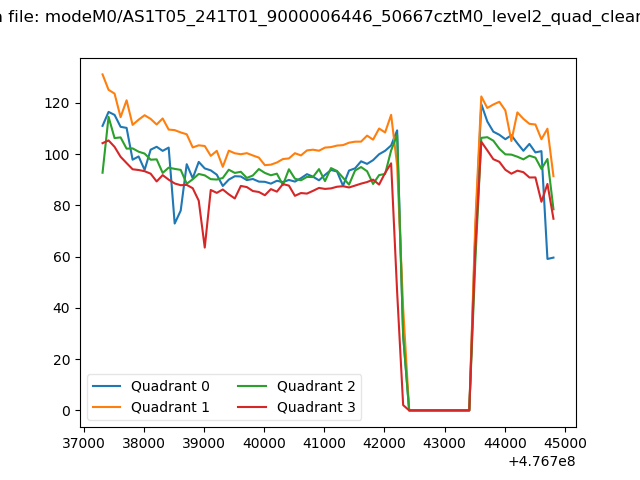 |
|
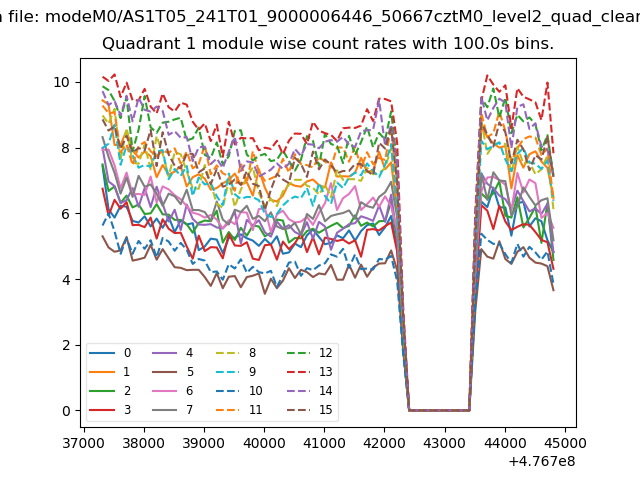
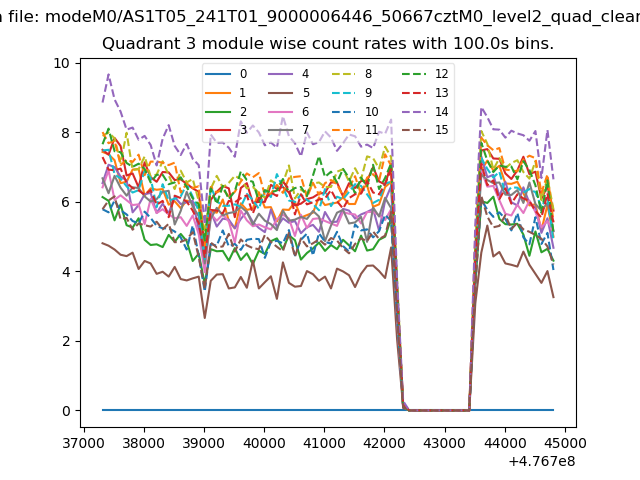
| Module-wise count rates for Quadrant A Data is divided into 100 sec bins |
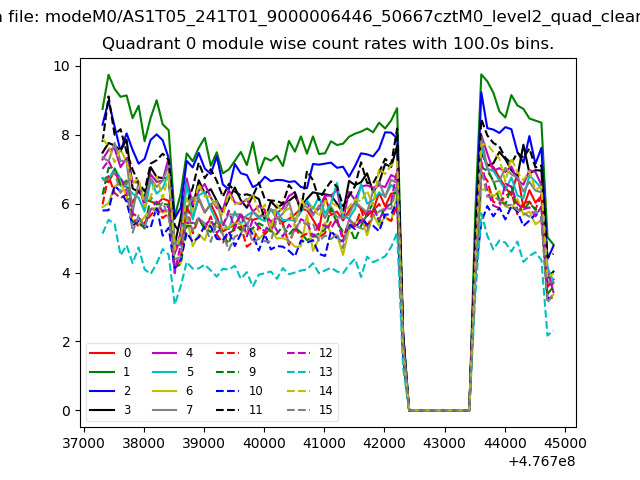 |
 |
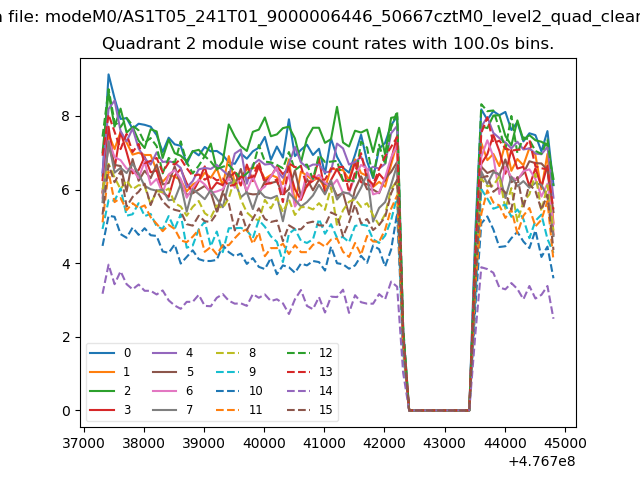
| Module-wise count rates for Quadrant B Data is divided into 100 sec bins |
 |
 |
| Module-wise count rates for Quadrant C Data is divided into 100 sec bins |
 |
 |
| Module-wise count rates for Quadrant D Data is divided into 100 sec bins |
 |
 |
| Parameter | Plot |
|---|---|
| CZT HV Monitor | 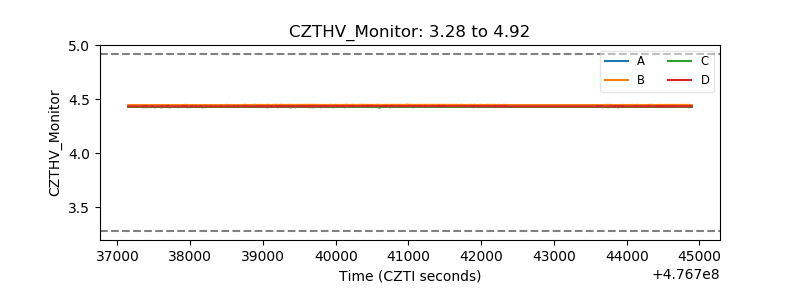 |
| D_VDD | 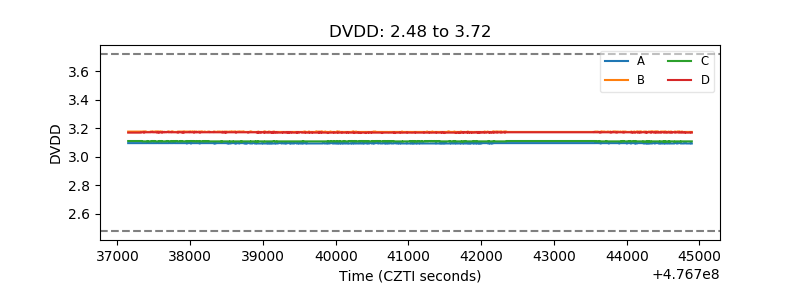 |
| Temperature 1 | 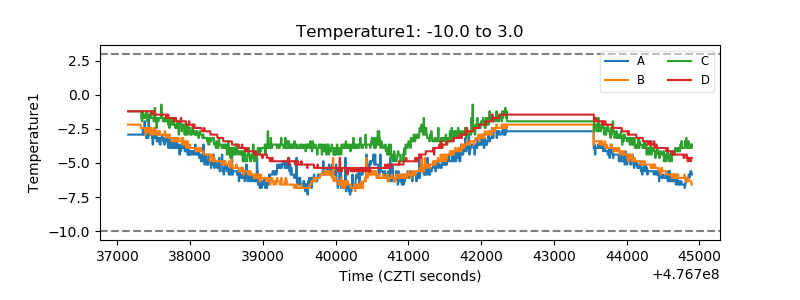 |
| Veto HV Monitor | 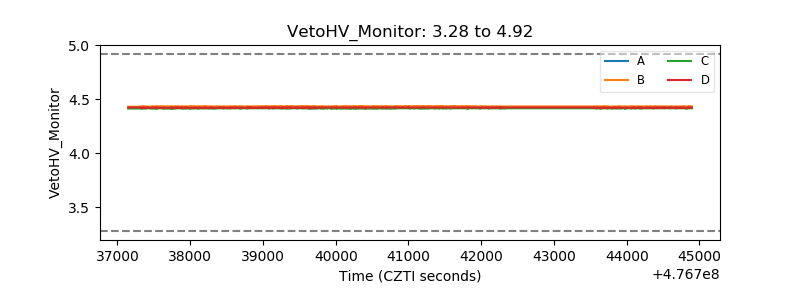 |
| Veto LLD | 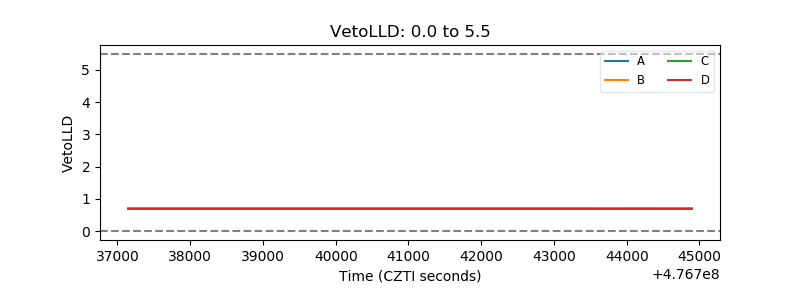 |
| Alpha Counter | 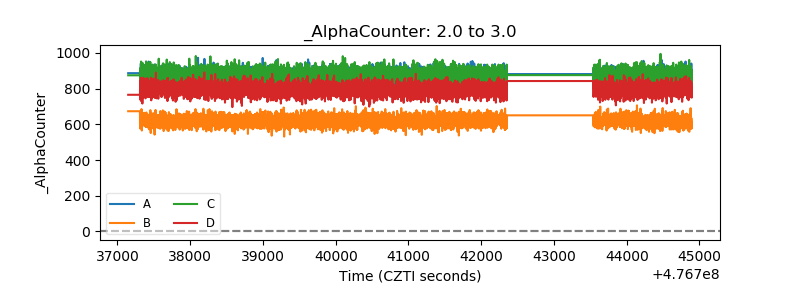 |
| _CPM_Rate | 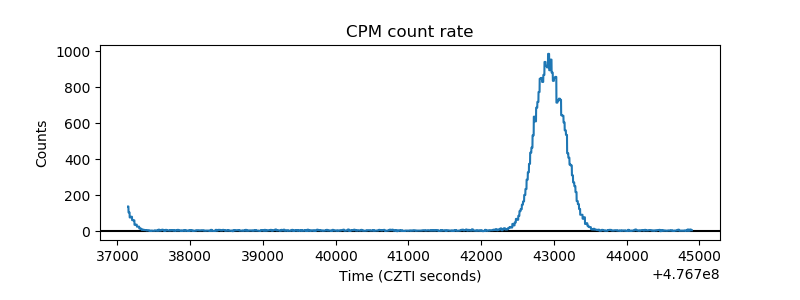 |
| CZT Counter | 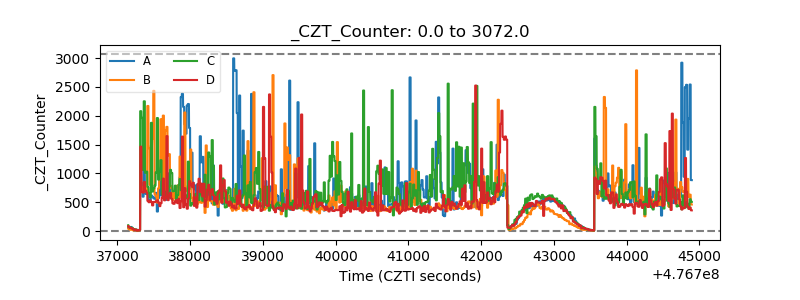 |
| +2.5 Volts monitor | 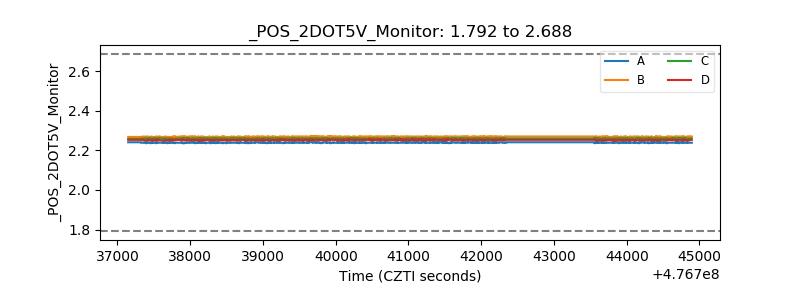 |
| +5 Volts monitor |  |
| _ROLL_ROT | 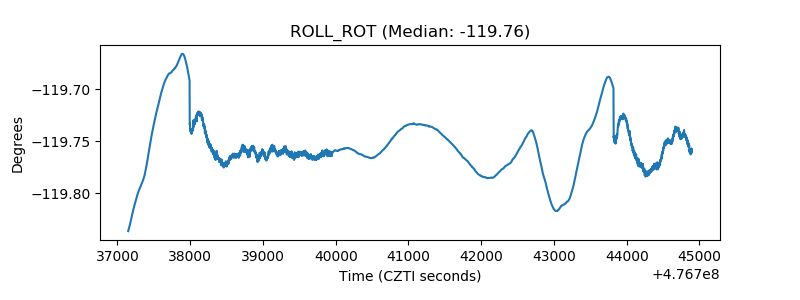 |
| _Roll_DEC | 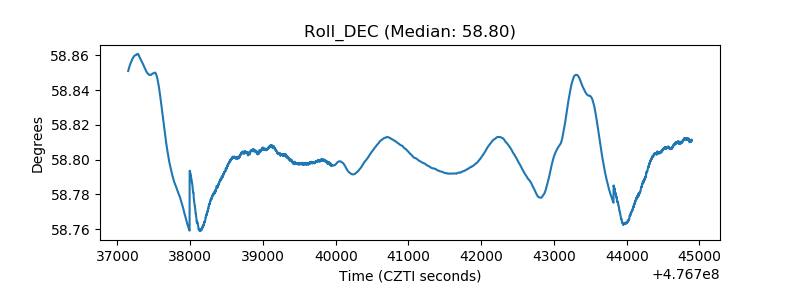 |
| _Roll_RA | 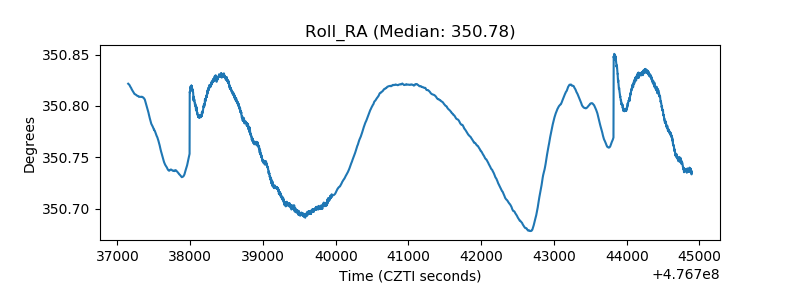 |
| Veto Counter | 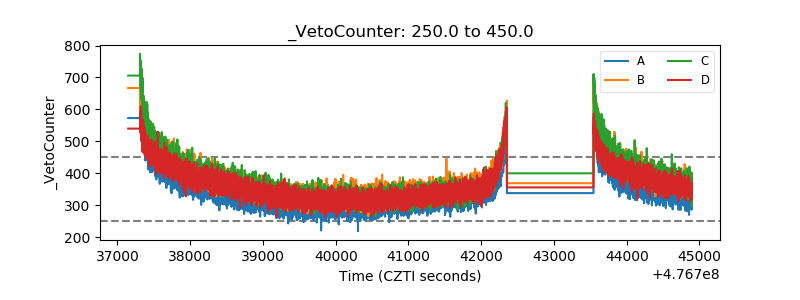 |