| Param | Original file | Final file |
|---|---|---|
| Filename | modeM0/AS1T05_241T01_9000006446_50668cztM0_level2.fits | modeM0/AS1T05_241T01_9000006446_50668cztM0_level2_quad_clean.evt |
| Size (bytes) | 461,813,760 | 96,719,040 |
| Size | 440.4 MB | 92.2 MB |
| Events in quadrant A | 4,446,316 | 617,590 |
| Events in quadrant B | 3,753,052 | 688,492 |
| Events in quadrant C | 4,250,205 | 611,119 |
| Events in quadrant D | 4,146,867 | 563,424 |
| Mode M9 | |||
|---|---|---|---|
| Quadrant | BADHDUFLAG | Total packets | Discarded packets |
| A | 0 | 15 | 0 |
| B | 0 | 16 | 0 |
| C | 0 | 16 | 0 |
| D | 0 | 16 | 0 |
| Mode M0 | |||
|---|---|---|---|
| Quadrant | BADHDUFLAG | Total packets | Discarded packets |
| A | 0 | 17664 | 2 |
| B | 0 | 15658 | 2 |
| C | 0 | 17020 | 2 |
| D | 0 | 16882 | 2 |
| Mode SS | |||
|---|---|---|---|
| Quadrant | BADHDUFLAG | Total packets | Discarded packets |
| A | 0 | 132 | 0 |
| B | 0 | 132 | 0 |
| C | 0 | 132 | 0 |
| D | 0 | 132 | 0 |
| Quadrant | Total seconds | Saturated seconds | Saturation percentage |
|---|---|---|---|
| A | 6419 | 218 | 3.396168% |
| B | 6419 | 150 | 2.336813% |
| C | 6419 | 197 | 3.069014% |
| D | 6419 | 224 | 3.489640% |
Noise dominated data is calculated using 1-second bins in cleaned event files. If a bin has >2000 counts, and if more than 50% of those come from <1% of pixels, then it is considered to be noise-dominated and hence unusable.
| Quadrant | # 1 sec bins | Bins with >0 counts | Bins with >2000 counts | High rate bins dominated by noise | Noise dominated (total time) | Noise dominated (detector-on time) | Marked lightcurve |
|---|---|---|---|---|---|---|---|
| A | 7620 | 6420 | 176 | 176 | 2.31% | 2.74% | 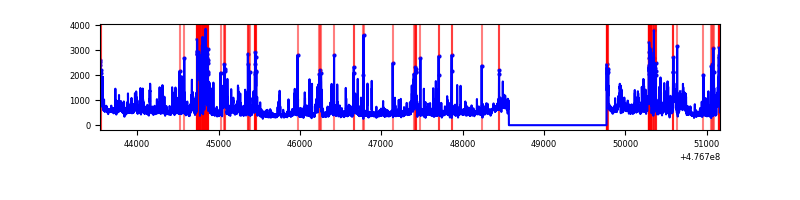 |
| B | 7620 | 6420 | 75 | 75 | 0.98% | 1.17% | 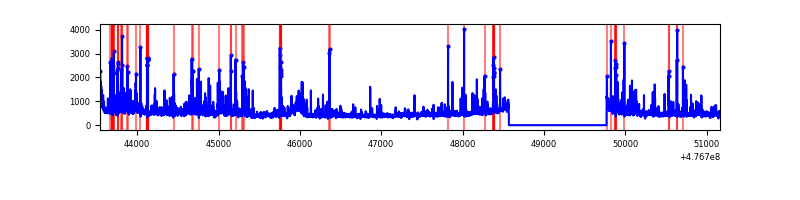 |
| C | 7620 | 6420 | 149 | 149 | 1.96% | 2.32% | 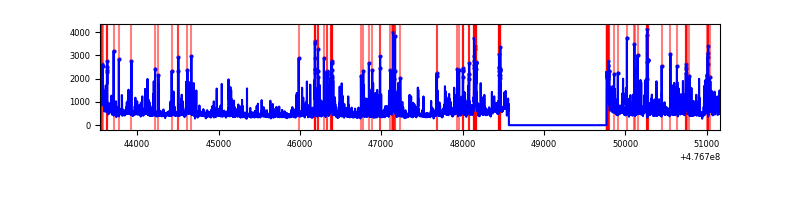 |
| D | 7620 | 6420 | 130 | 130 | 1.71% | 2.02% | 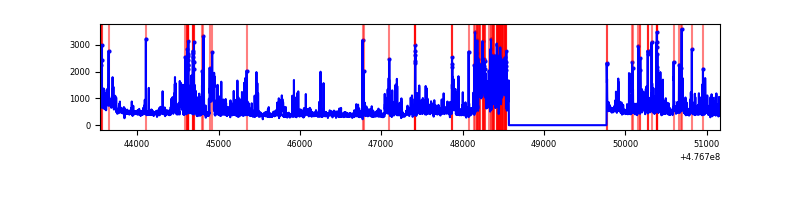 |
Top three noisy pixels from each quadrant. If the there are fewer than three noisy pixels in the level2.evt file, extra rows are filled as -1
| Pixel properties | Quadrant properties | ||||||
|---|---|---|---|---|---|---|---|
| Quadrant | DetID | PixID | Counts | Sigma | Mean | Median | Sigma |
| A | 12 | 113 | 390066 | 2283.9 | 684 | 665 | 170.5 |
| A | 8 | 38 | 354016 | 2072.46 | 684 | 665 | 170.5 |
| A | 8 | 247 | 263963 | 1544.29 | 684 | 665 | 170.5 |
| B | 5 | 185 | 179196 | 1229.13 | 688 | 664 | 145.3 |
| B | 4 | 170 | 176701 | 1211.95 | 688 | 664 | 145.3 |
| B | 0 | 213 | 128112 | 877.43 | 688 | 664 | 145.3 |
| C | 0 | 224 | 449690 | 2389.66 | 680 | 674 | 187.9 |
| C | 14 | 254 | 296608 | 1574.96 | 680 | 674 | 187.9 |
| C | 13 | 3 | 173783 | 921.28 | 680 | 674 | 187.9 |
| D | 7 | 96 | 224162 | 1202.48 | 668 | 644 | 185.9 |
| D | 2 | 249 | 216742 | 1162.56 | 668 | 644 | 185.9 |
| D | 7 | 110 | 212140 | 1137.8 | 668 | 644 | 185.9 |
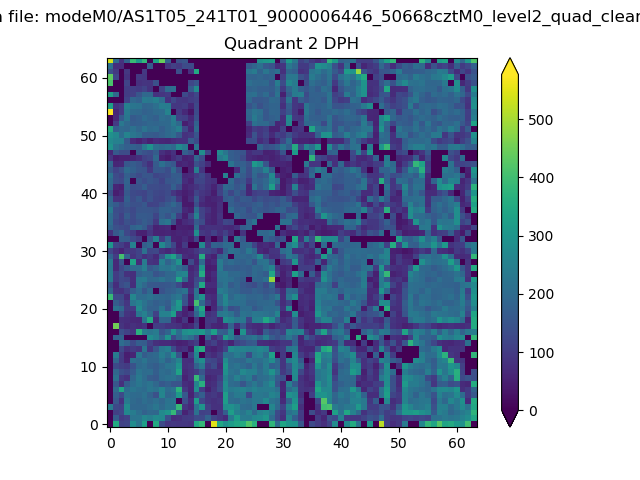
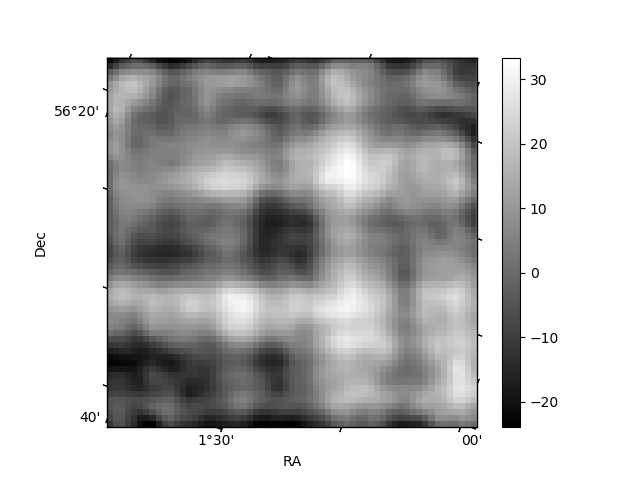
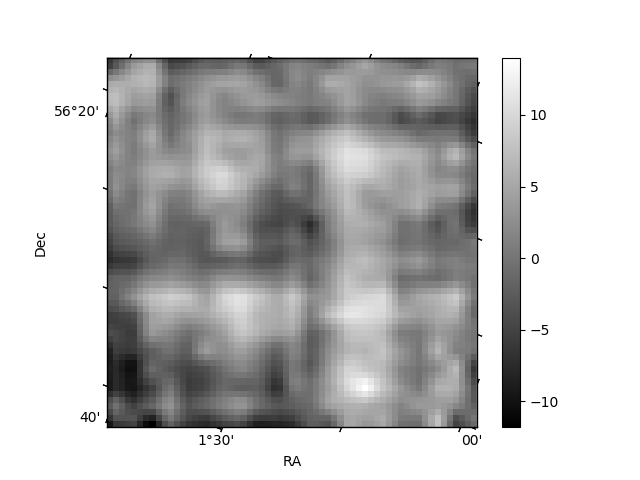
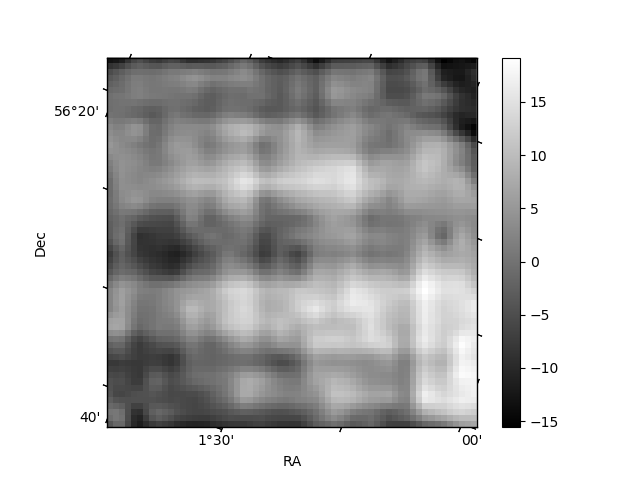
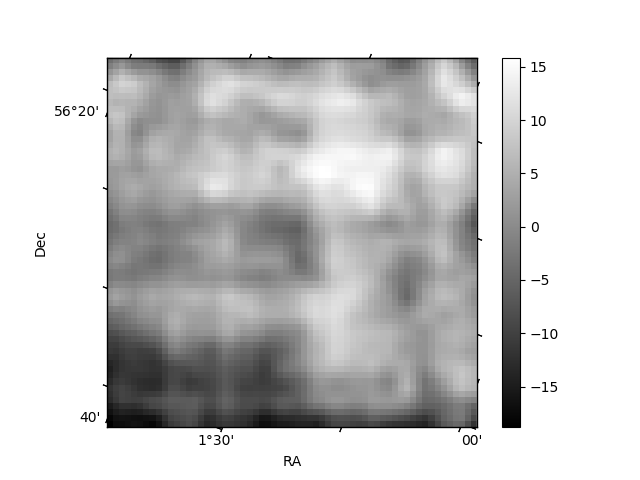
Histogram calculated using DETX and DETY for each event in the final _common_clean file
| Quadrant A | 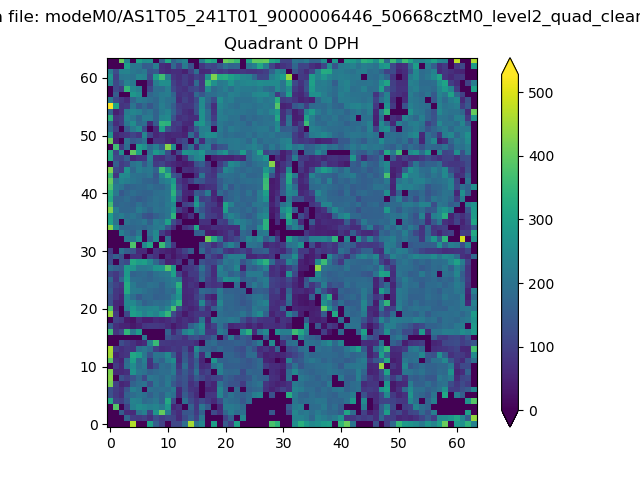 |
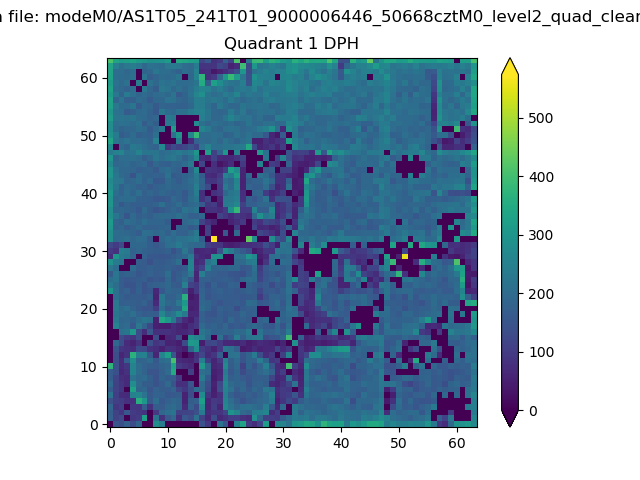 |
Quadrant B |
|---|---|---|---|
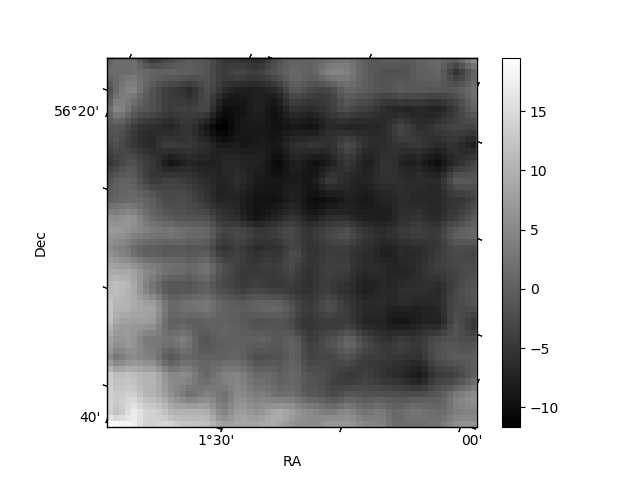
| Quadrant D | 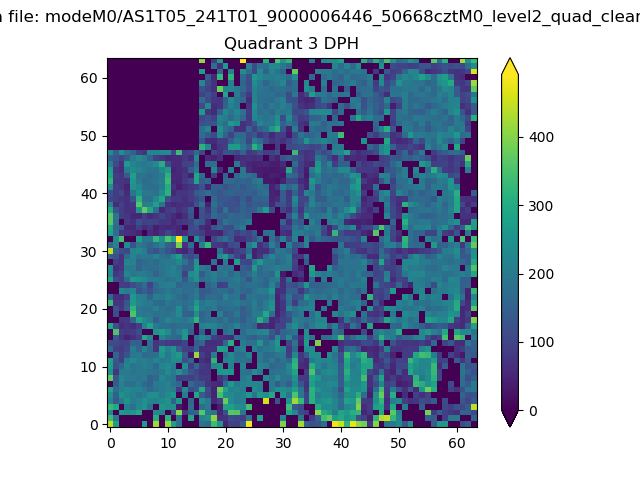 |
 |
Quadrant C |
| Plot type | Count rate plots | Images |
|---|---|---|
| Comparison with Poisson distribution Blue bars denote a histogram of data divided into 1 sec bins. Red curve is a Poisson curve with rate = median count rate of data. |
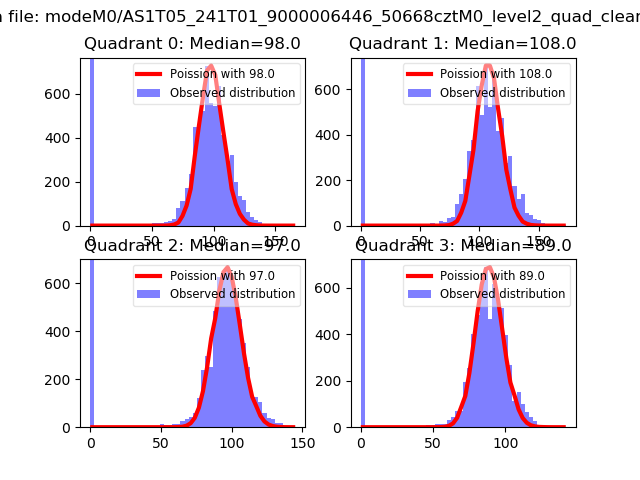 |
 |
| Quadrant-wise count rates Data is divided into 100 sec bins |
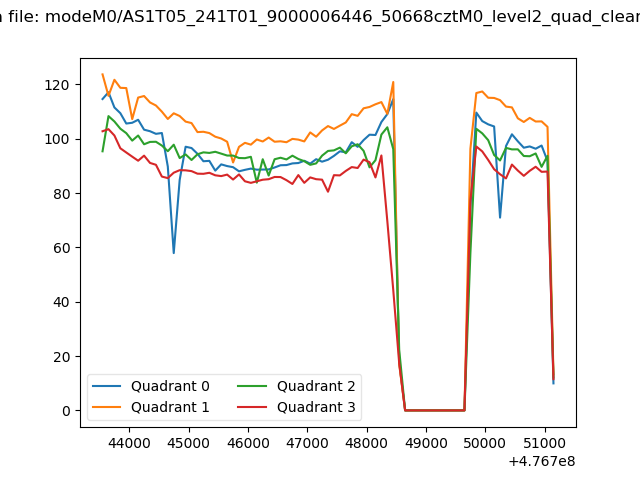 |
|
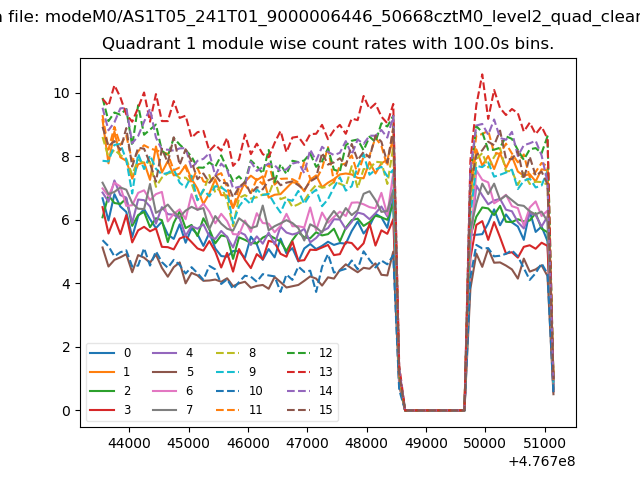
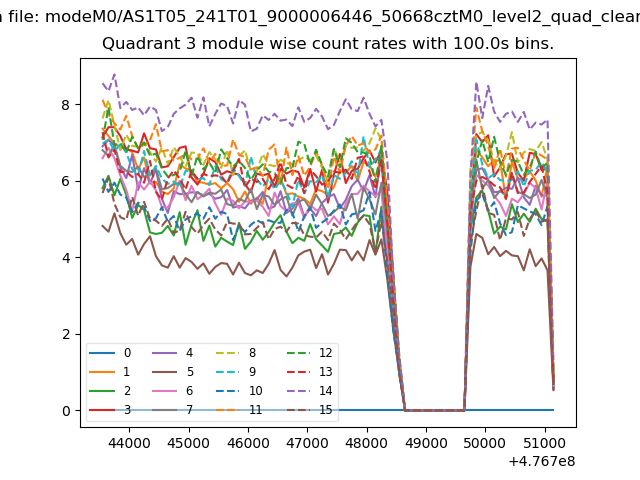
| Module-wise count rates for Quadrant A Data is divided into 100 sec bins |
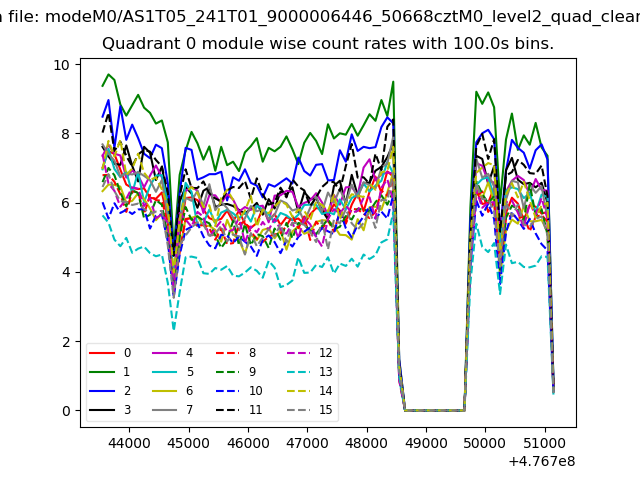 |
 |
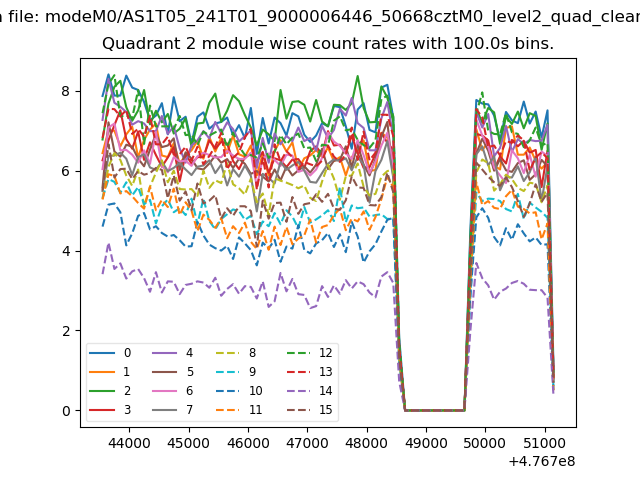
| Module-wise count rates for Quadrant B Data is divided into 100 sec bins |
 |
 |
| Module-wise count rates for Quadrant C Data is divided into 100 sec bins |
 |
 |
| Module-wise count rates for Quadrant D Data is divided into 100 sec bins |
 |
 |
| Parameter | Plot |
|---|---|
| CZT HV Monitor | 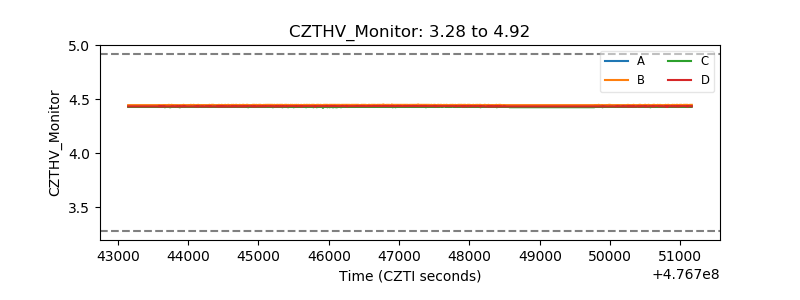 |
| D_VDD | 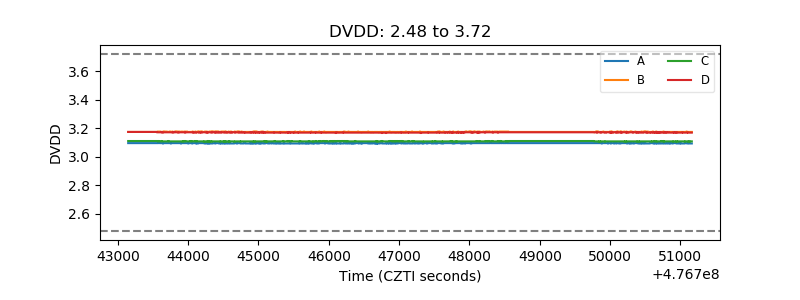 |
| Temperature 1 | 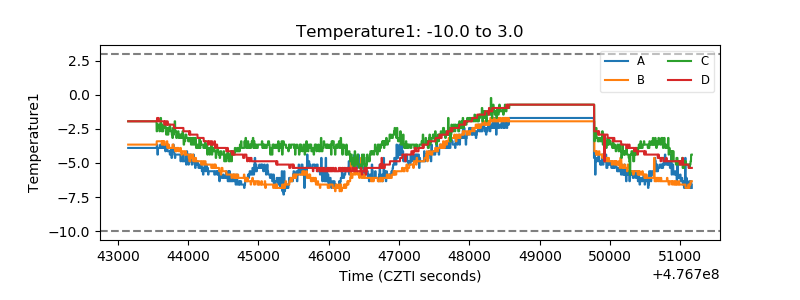 |
| Veto HV Monitor | 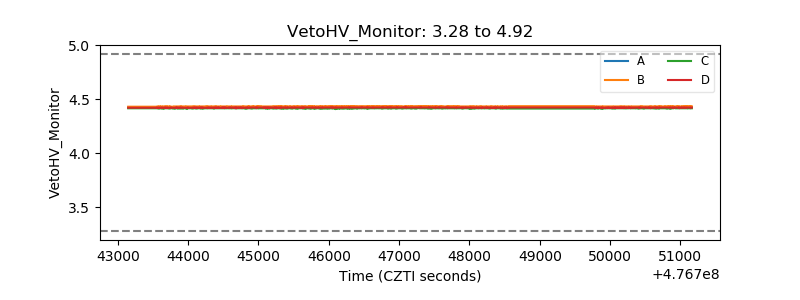 |
| Veto LLD | 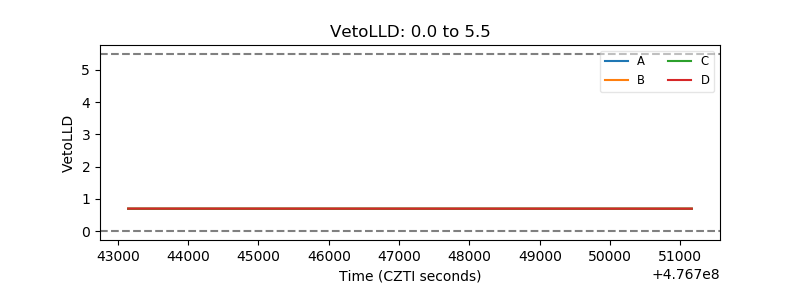 |
| Alpha Counter | 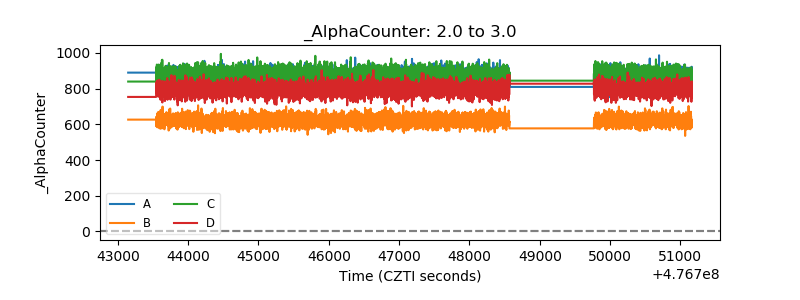 |
| _CPM_Rate | 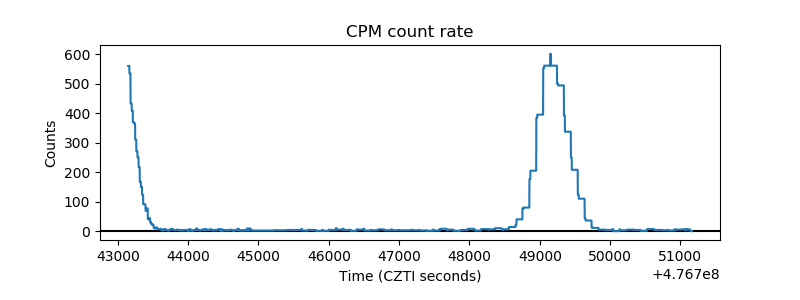 |
| CZT Counter | 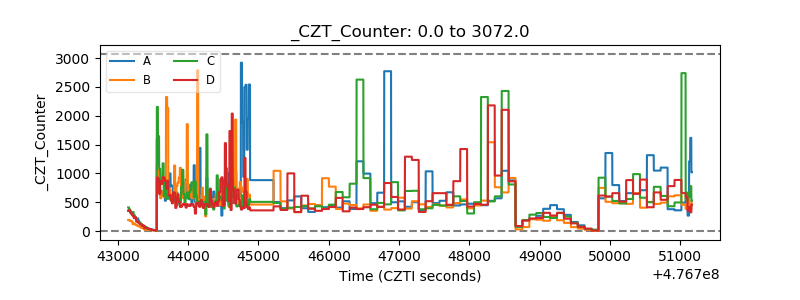 |
| +2.5 Volts monitor | 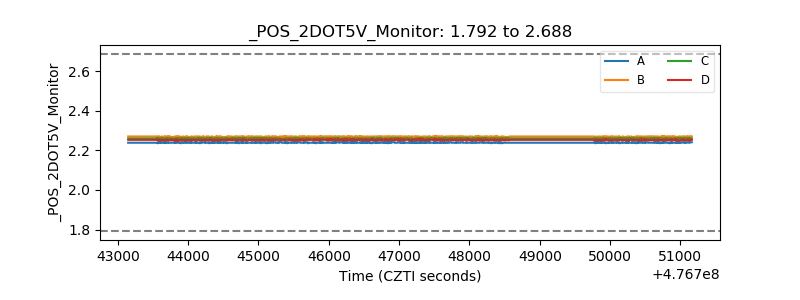 |
| +5 Volts monitor | 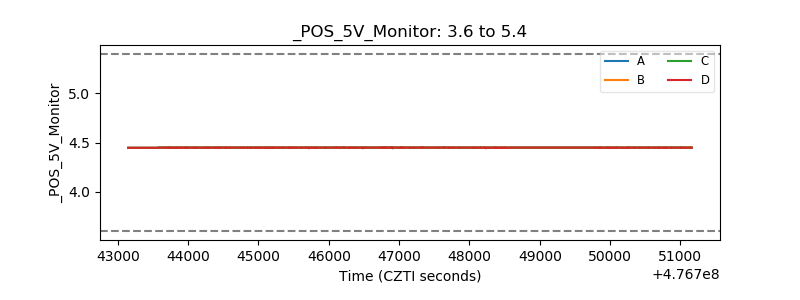 |
| _ROLL_ROT | 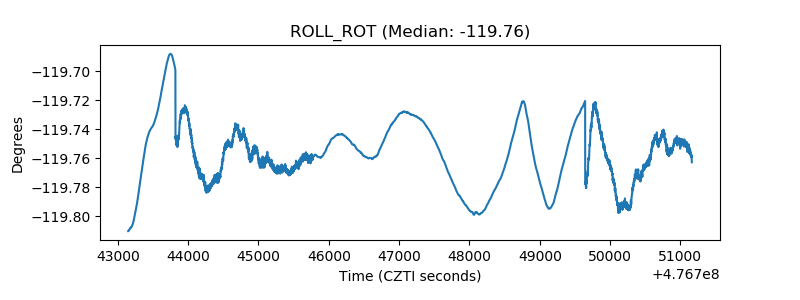 |
| _Roll_DEC | 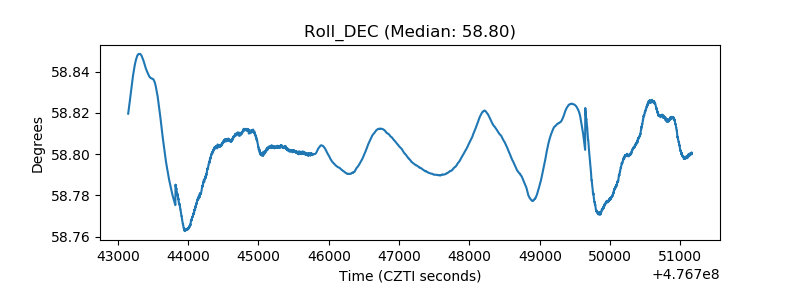 |
| _Roll_RA | 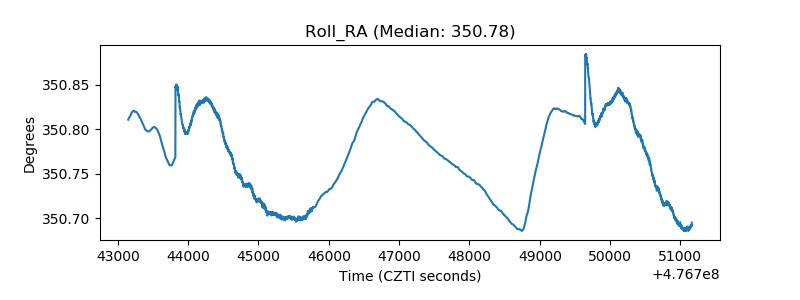 |
| Veto Counter | 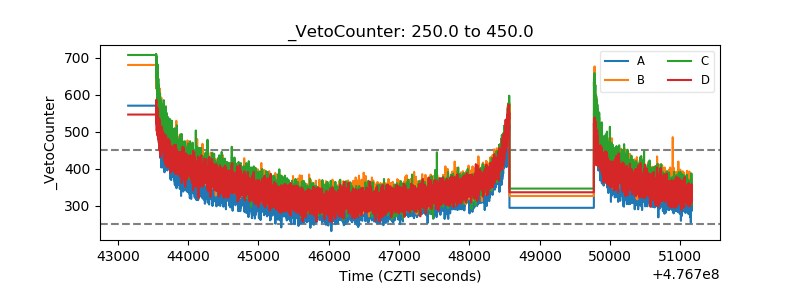 |