| Param | Original file | Final file |
|---|---|---|
| Filename | modeM0/AS1T05_241T01_9000006446_50669cztM0_level2.fits | modeM0/AS1T05_241T01_9000006446_50669cztM0_level2_quad_clean.evt |
| Size (bytes) | 604,880,640 | 93,712,320 |
| Size | 576.9 MB | 89.4 MB |
| Events in quadrant A | 4,448,664 | 643,485 |
| Events in quadrant B | 7,407,069 | 530,285 |
| Events in quadrant C | 4,837,685 | 621,550 |
| Events in quadrant D | 5,169,974 | 568,408 |
| Mode M9 | |||
|---|---|---|---|
| Quadrant | BADHDUFLAG | Total packets | Discarded packets |
| A | 0 | 17 | 0 |
| B | 0 | 18 | 0 |
| C | 0 | 18 | 0 |
| D | 0 | 18 | 0 |
| Mode M0 | |||
|---|---|---|---|
| Quadrant | BADHDUFLAG | Total packets | Discarded packets |
| A | 0 | 18098 | 2 |
| B | 0 | 26744 | 2 |
| C | 0 | 19128 | 2 |
| D | 0 | 20210 | 2 |
| Mode SS | |||
|---|---|---|---|
| Quadrant | BADHDUFLAG | Total packets | Discarded packets |
| A | 0 | 140 | 0 |
| B | 0 | 140 | 0 |
| C | 0 | 140 | 0 |
| D | 0 | 140 | 0 |
| Quadrant | Total seconds | Saturated seconds | Saturation percentage |
|---|---|---|---|
| A | 6797 | 178 | 2.618802% |
| B | 6797 | 1850 | 27.217890% |
| C | 6797 | 353 | 5.193468% |
| D | 6797 | 437 | 6.429307% |
Noise dominated data is calculated using 1-second bins in cleaned event files. If a bin has >2000 counts, and if more than 50% of those come from <1% of pixels, then it is considered to be noise-dominated and hence unusable.
| Quadrant | # 1 sec bins | Bins with >0 counts | Bins with >2000 counts | High rate bins dominated by noise | Noise dominated (total time) | Noise dominated (detector-on time) | Marked lightcurve |
|---|---|---|---|---|---|---|---|
| A | 7877 | 6799 | 106 | 106 | 1.35% | 1.56% | 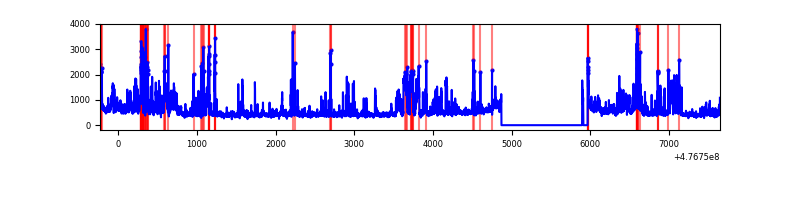 |
| B | 7877 | 6797 | 1434 | 1434 | 18.20% | 21.10% | 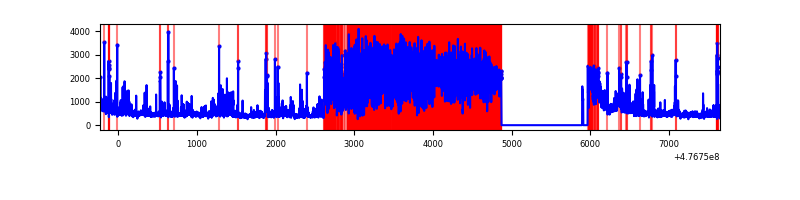 |
| C | 7877 | 6799 | 247 | 247 | 3.14% | 3.63% | 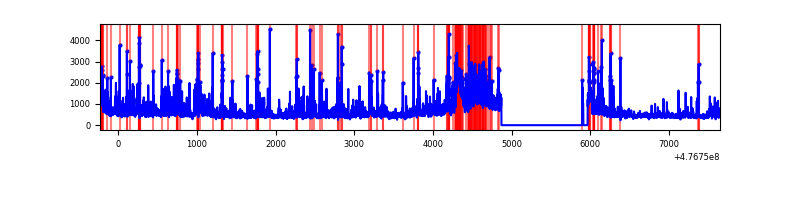 |
| D | 7877 | 6797 | 385 | 385 | 4.89% | 5.66% | 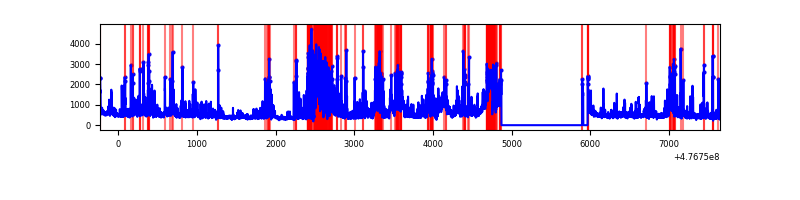 |
Top three noisy pixels from each quadrant. If the there are fewer than three noisy pixels in the level2.evt file, extra rows are filled as -1
| Pixel properties | Quadrant properties | ||||||
|---|---|---|---|---|---|---|---|
| Quadrant | DetID | PixID | Counts | Sigma | Mean | Median | Sigma |
| A | 12 | 80 | 501626 | 2836.22 | 719 | 700 | 176.6 |
| A | 12 | 113 | 277955 | 1569.8 | 719 | 700 | 176.6 |
| A | 8 | 38 | 166718 | 939.99 | 719 | 700 | 176.6 |
| B | 4 | 170 | 3836449 | 28421.86 | 629 | 607 | 135.0 |
| B | 5 | 185 | 278611 | 2059.88 | 629 | 607 | 135.0 |
| B | 3 | 249 | 167476 | 1236.42 | 629 | 607 | 135.0 |
| C | 15 | 174 | 498093 | 2555.51 | 703 | 698 | 194.6 |
| C | 13 | 3 | 260624 | 1335.44 | 703 | 698 | 194.6 |
| C | 14 | 254 | 235778 | 1207.79 | 703 | 698 | 194.6 |
| D | 0 | 33 | 1076787 | 5632.31 | 688 | 663 | 191.1 |
| D | 2 | 249 | 329146 | 1719.24 | 688 | 663 | 191.1 |
| D | 8 | 129 | 274209 | 1431.71 | 688 | 663 | 191.1 |
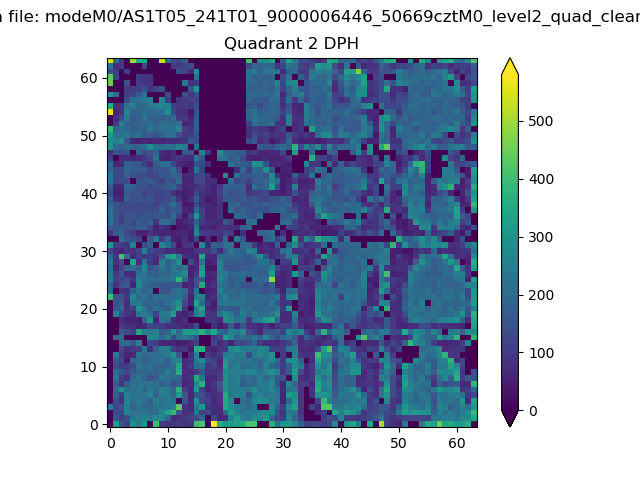
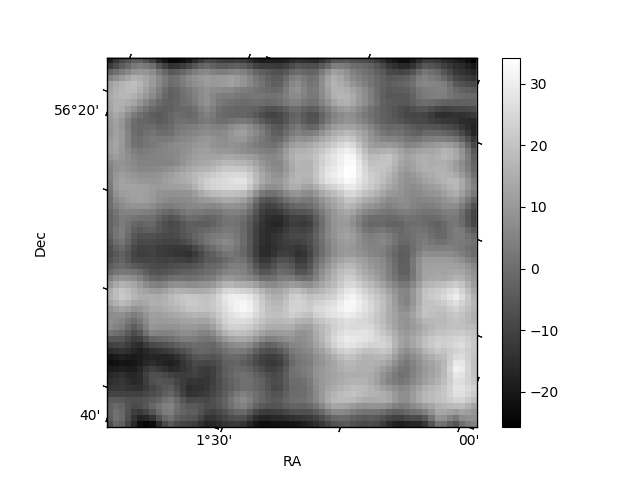
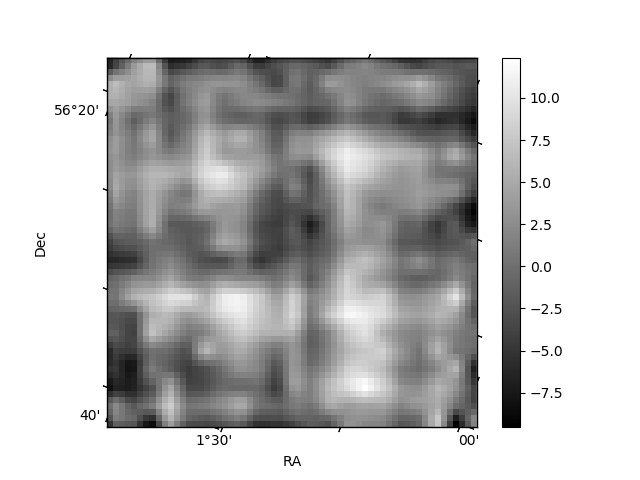
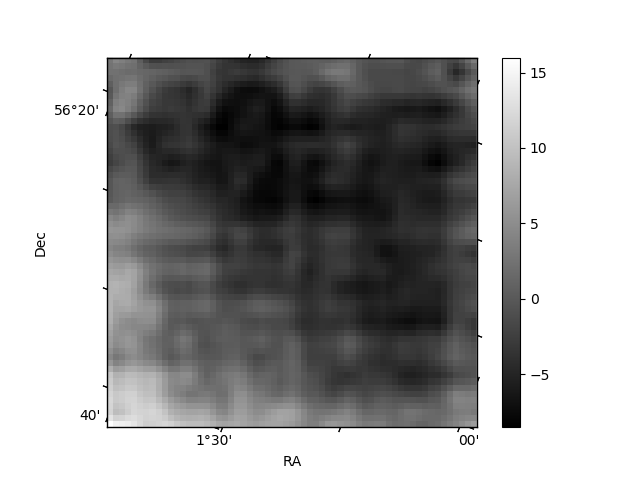
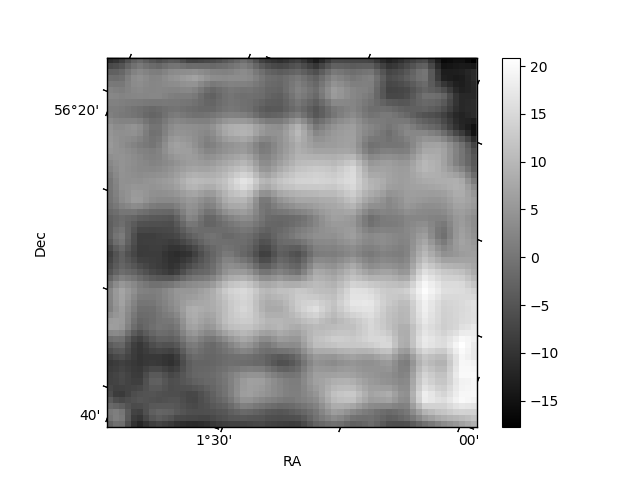
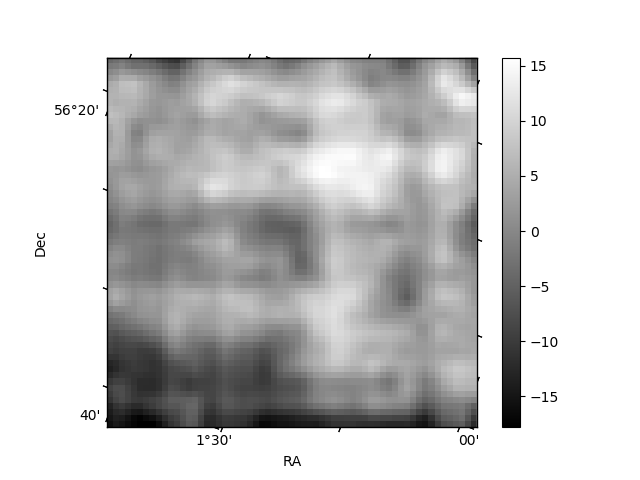
Histogram calculated using DETX and DETY for each event in the final _common_clean file
| Quadrant A | 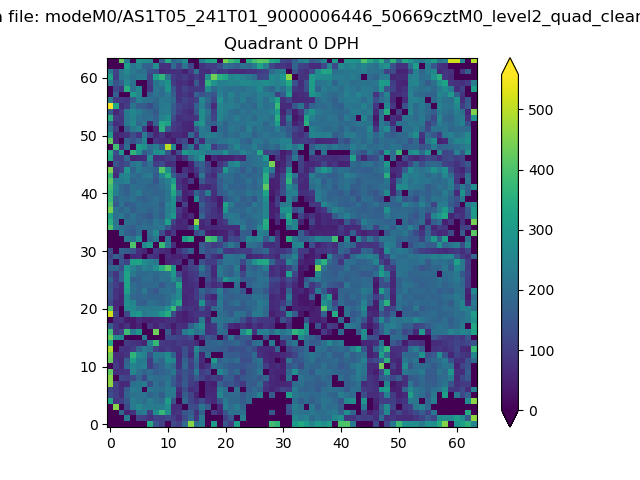 |
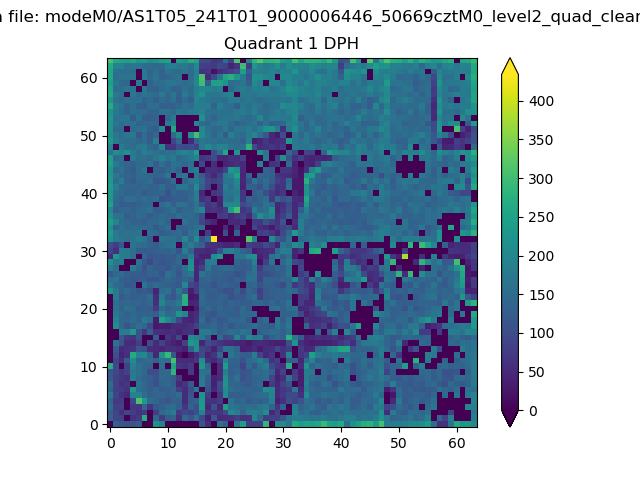 |
Quadrant B |
|---|---|---|---|
| Quadrant D | 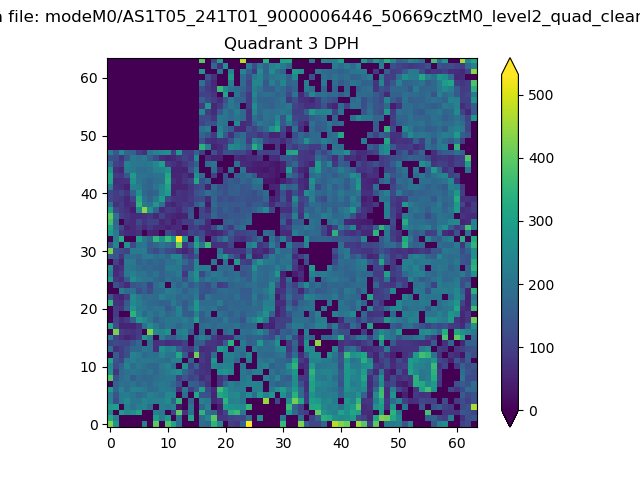 |
 |
Quadrant C |
| Plot type | Count rate plots | Images |
|---|---|---|
| Comparison with Poisson distribution Blue bars denote a histogram of data divided into 1 sec bins. Red curve is a Poisson curve with rate = median count rate of data. |
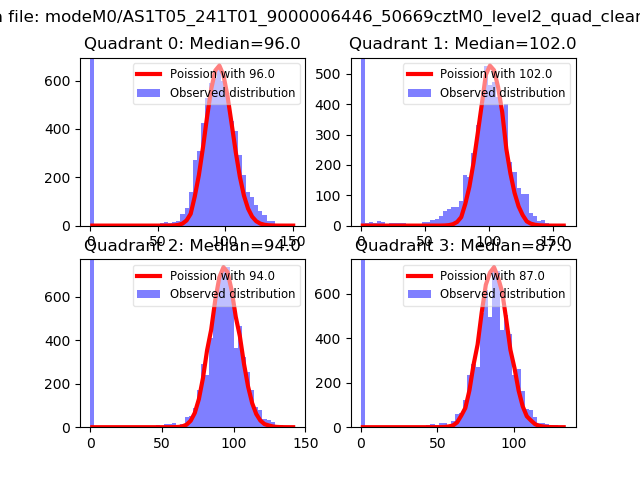 |
 |
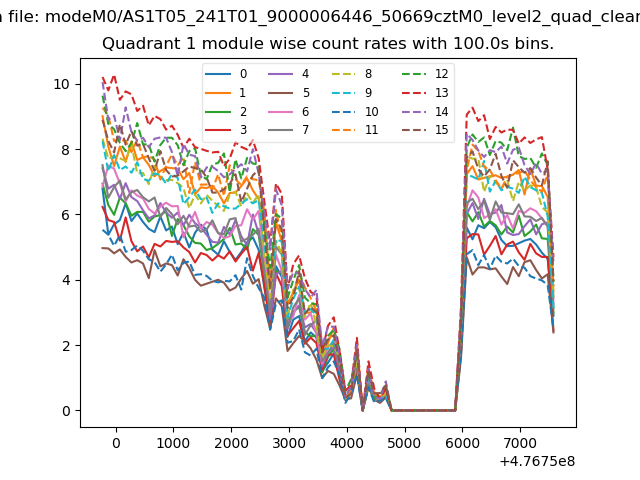
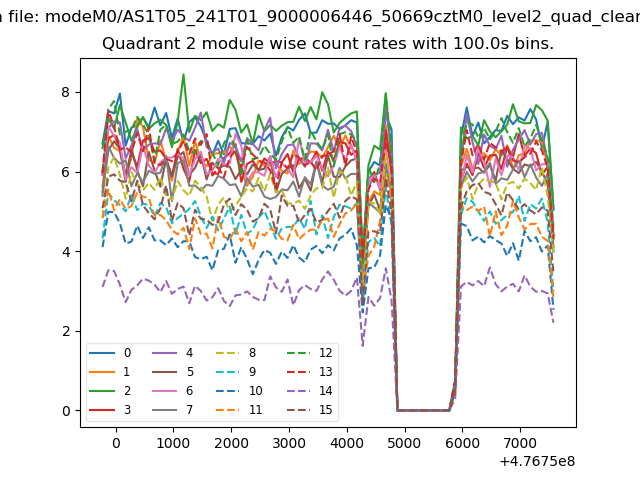
| Quadrant-wise count rates Data is divided into 100 sec bins |
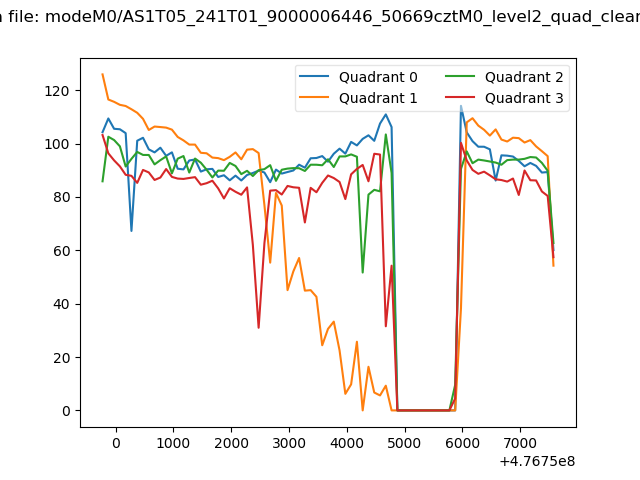 |
|
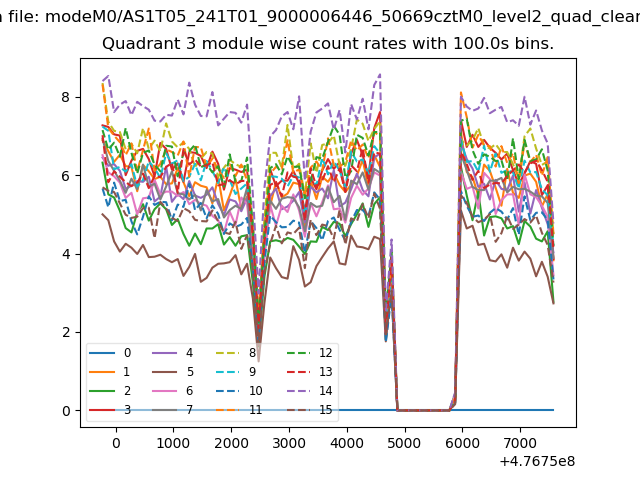
| Module-wise count rates for Quadrant A Data is divided into 100 sec bins |
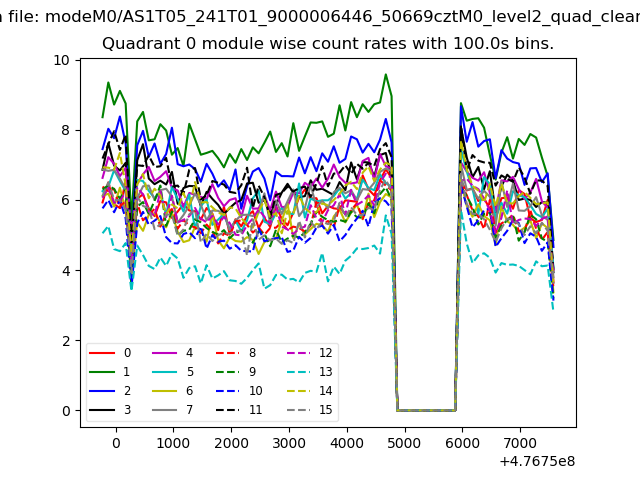 |
 |
| Module-wise count rates for Quadrant B Data is divided into 100 sec bins |
 |
 |
| Module-wise count rates for Quadrant C Data is divided into 100 sec bins |
 |
 |
| Module-wise count rates for Quadrant D Data is divided into 100 sec bins |
 |
 |
| Parameter | Plot |
|---|---|
| CZT HV Monitor | 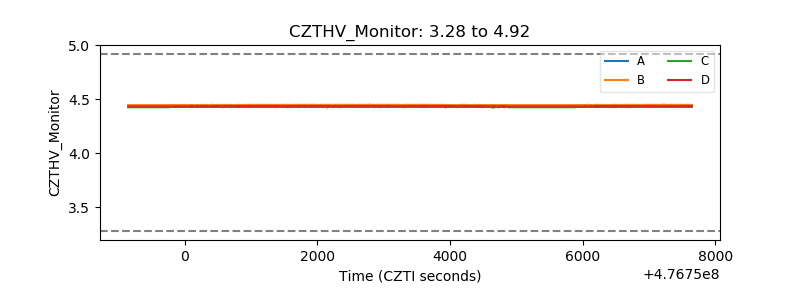 |
| D_VDD | 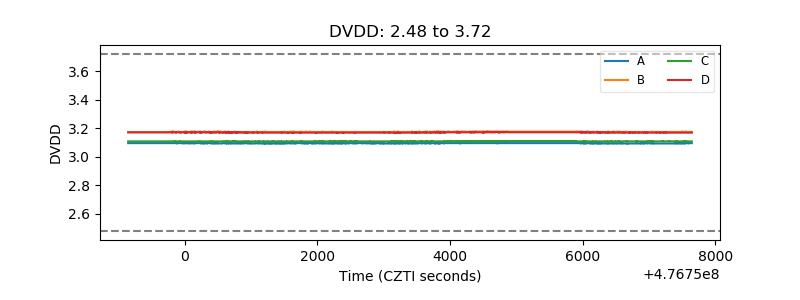 |
| Temperature 1 | 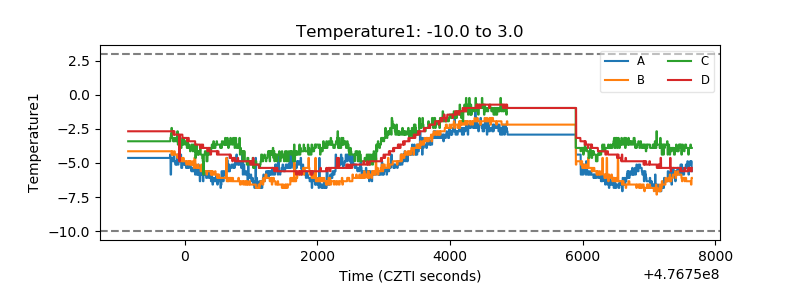 |
| Veto HV Monitor | 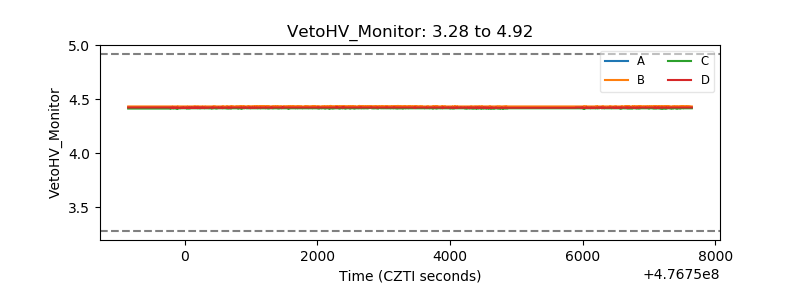 |
| Veto LLD | 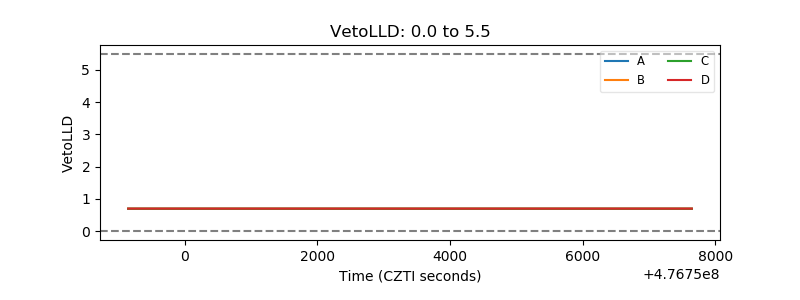 |
| Alpha Counter | 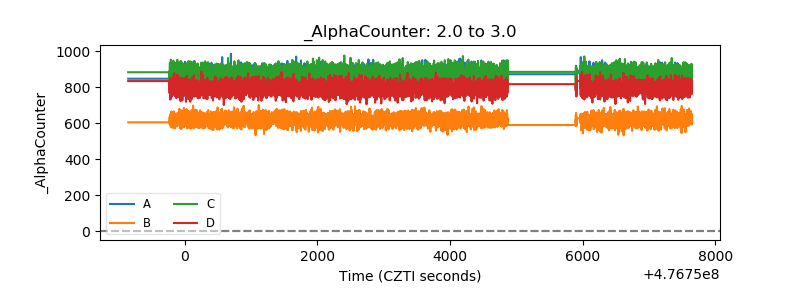 |
| _CPM_Rate | 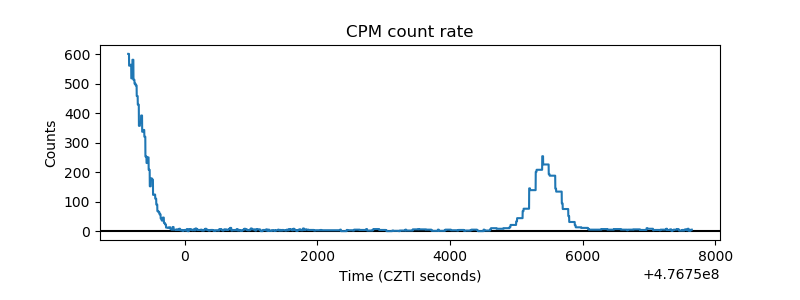 |
| CZT Counter | 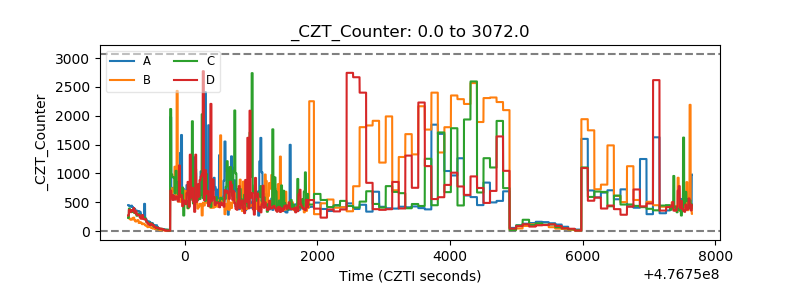 |
| +2.5 Volts monitor | 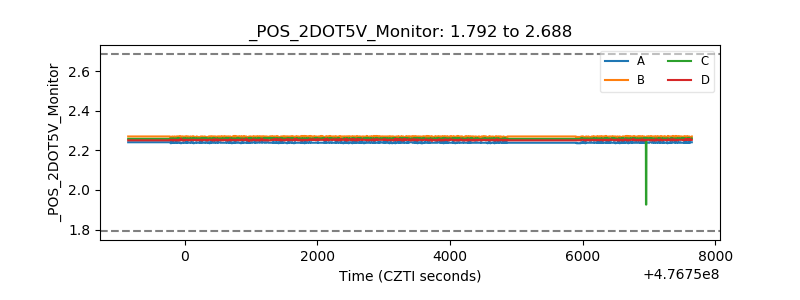 |
| +5 Volts monitor | 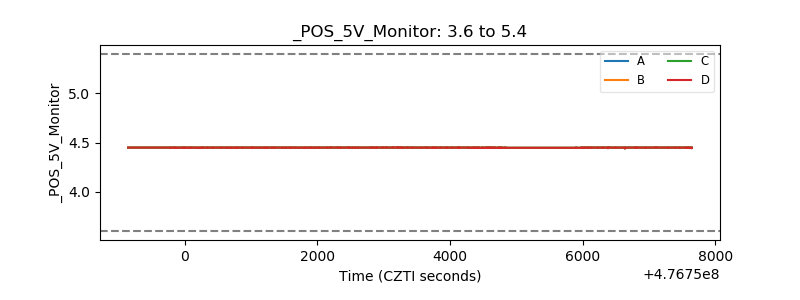 |
| _ROLL_ROT | 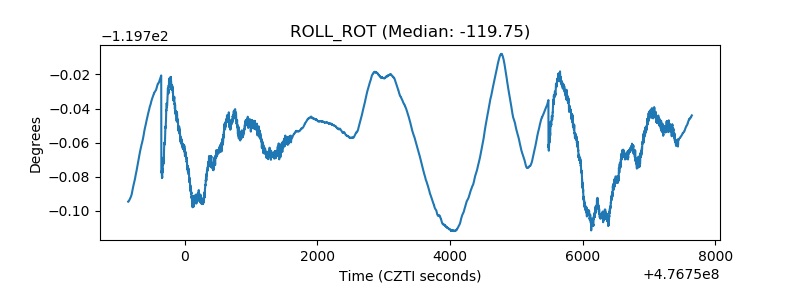 |
| _Roll_DEC | 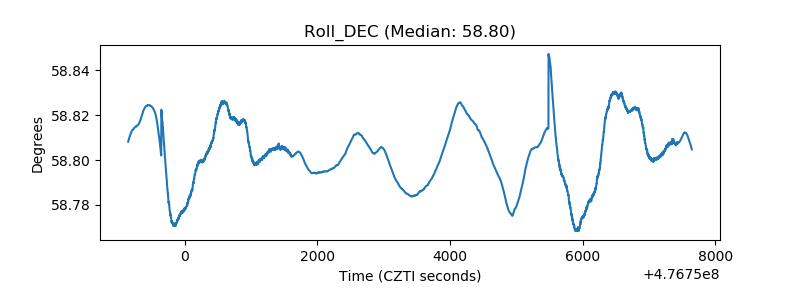 |
| _Roll_RA | 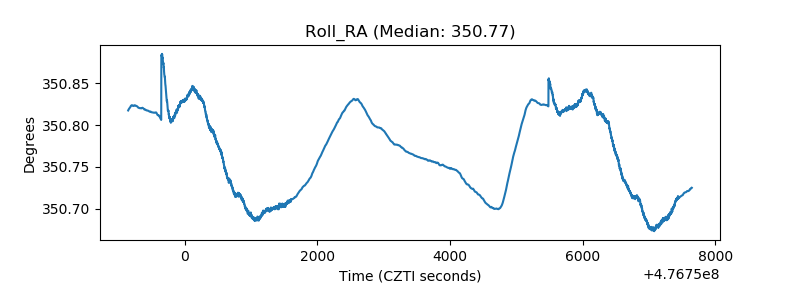 |
| Veto Counter | 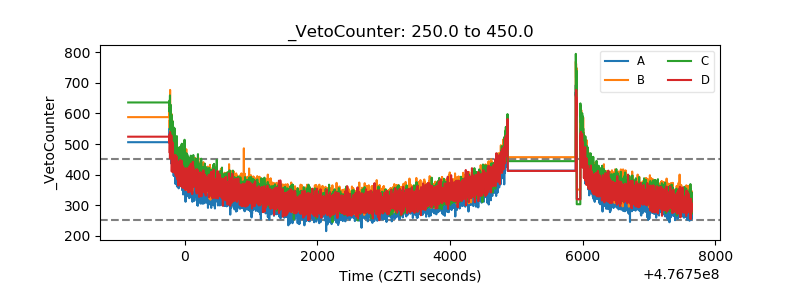 |