| Param | Original file | Final file |
|---|---|---|
| Filename | modeM0/AS1T05_241T01_9000006446_50670cztM0_level2.fits | modeM0/AS1T05_241T01_9000006446_50670cztM0_level2_quad_clean.evt |
| Size (bytes) | 622,572,480 | 94,720,320 |
| Size | 593.7 MB | 90.3 MB |
| Events in quadrant A | 8,411,846 | 523,656 |
| Events in quadrant B | 4,385,322 | 686,868 |
| Events in quadrant C | 4,497,449 | 623,278 |
| Events in quadrant D | 5,219,668 | 556,046 |
| Mode M9 | |||
|---|---|---|---|
| Quadrant | BADHDUFLAG | Total packets | Discarded packets |
| A | 0 | 7 | 0 |
| B | 0 | 7 | 0 |
| C | 0 | 7 | 0 |
| D | 0 | 7 | 0 |
| Mode M0 | |||
|---|---|---|---|
| Quadrant | BADHDUFLAG | Total packets | Discarded packets |
| A | 0 | 29803 | 1 |
| B | 0 | 17959 | 1 |
| C | 0 | 18077 | 1 |
| D | 0 | 20604 | 1 |
| Mode SS | |||
|---|---|---|---|
| Quadrant | BADHDUFLAG | Total packets | Discarded packets |
| A | 0 | 140 | 0 |
| B | 0 | 140 | 0 |
| C | 0 | 140 | 0 |
| D | 0 | 140 | 0 |
| Quadrant | Total seconds | Saturated seconds | Saturation percentage |
|---|---|---|---|
| A | 6857 | 1446 | 21.087939% |
| B | 6857 | 225 | 3.281318% |
| C | 6857 | 190 | 2.770891% |
| D | 6857 | 553 | 8.064751% |
Noise dominated data is calculated using 1-second bins in cleaned event files. If a bin has >2000 counts, and if more than 50% of those come from <1% of pixels, then it is considered to be noise-dominated and hence unusable.
| Quadrant | # 1 sec bins | Bins with >0 counts | Bins with >2000 counts | High rate bins dominated by noise | Noise dominated (total time) | Noise dominated (detector-on time) | Marked lightcurve |
|---|---|---|---|---|---|---|---|
| A | 7597 | 6858 | 1325 | 1325 | 17.44% | 19.32% | 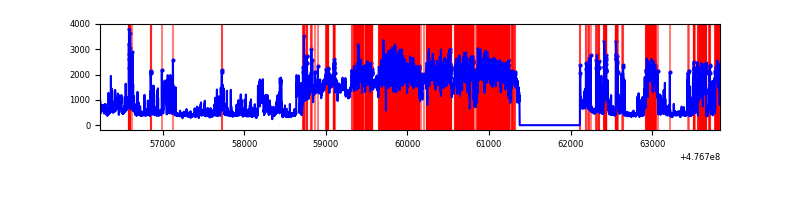 |
| B | 7597 | 6857 | 80 | 80 | 1.05% | 1.17% | 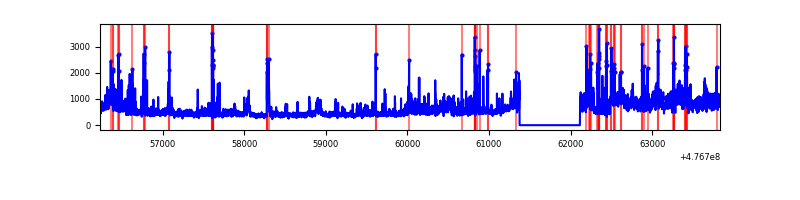 |
| C | 7597 | 6858 | 104 | 104 | 1.37% | 1.52% | 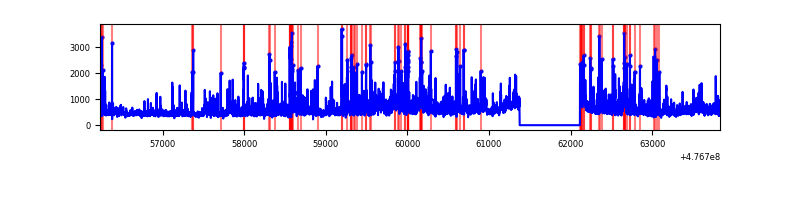 |
| D | 7597 | 6857 | 465 | 465 | 6.12% | 6.78% | 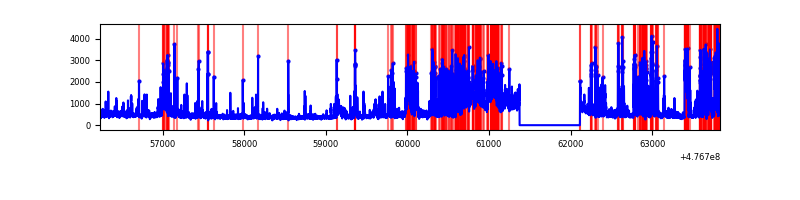 |
Top three noisy pixels from each quadrant. If the there are fewer than three noisy pixels in the level2.evt file, extra rows are filled as -1
| Pixel properties | Quadrant properties | ||||||
|---|---|---|---|---|---|---|---|
| Quadrant | DetID | PixID | Counts | Sigma | Mean | Median | Sigma |
| A | 12 | 80 | 4680784 | 27326.17 | 686 | 668 | 171.3 |
| A | 12 | 113 | 479963 | 2798.5 | 686 | 668 | 171.3 |
| A | 8 | 38 | 128079 | 743.92 | 686 | 668 | 171.3 |
| B | 4 | 170 | 640009 | 4192.41 | 719 | 693 | 152.5 |
| B | 5 | 185 | 235966 | 1542.84 | 719 | 693 | 152.5 |
| B | 7 | 252 | 73165 | 475.25 | 719 | 693 | 152.5 |
| C | 13 | 113 | 740001 | 3795.26 | 708 | 702 | 194.8 |
| C | 14 | 254 | 139204 | 711.01 | 708 | 702 | 194.8 |
| C | 4 | 5 | 132700 | 677.62 | 708 | 702 | 194.8 |
| D | 8 | 129 | 852442 | 4487.24 | 682 | 659 | 189.8 |
| D | 7 | 110 | 427583 | 2249.06 | 682 | 659 | 189.8 |
| D | 2 | 249 | 351209 | 1846.72 | 682 | 659 | 189.8 |
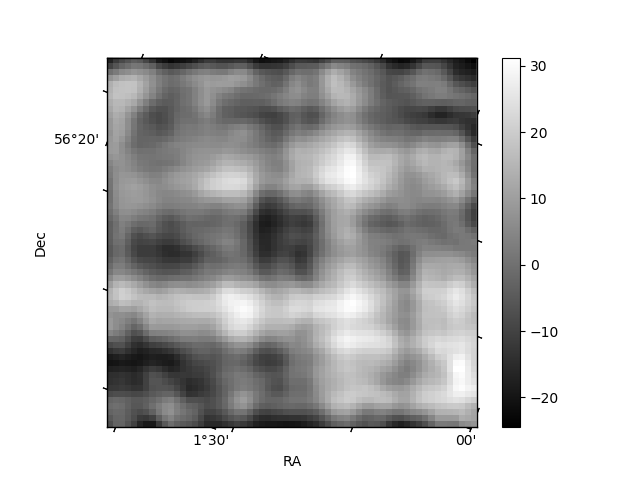
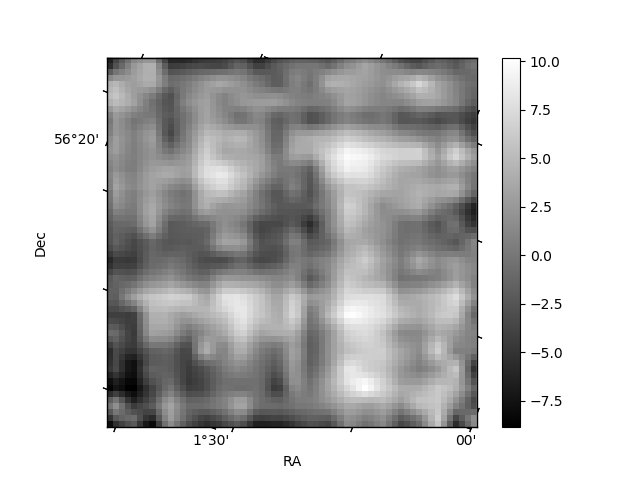
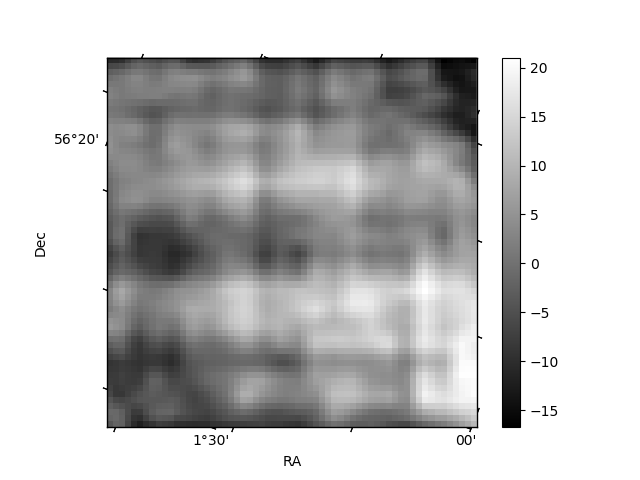
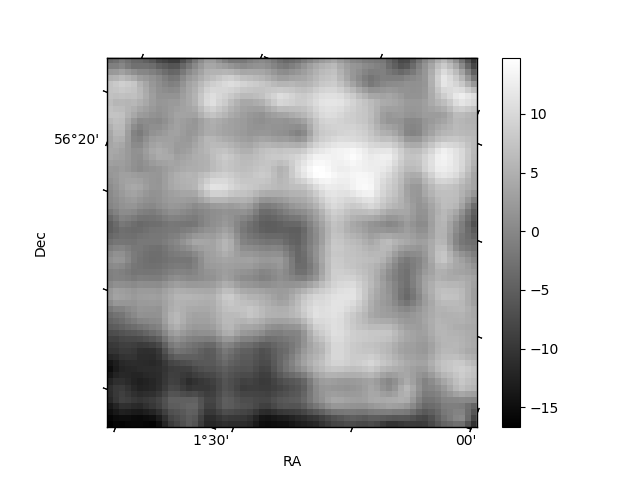
Histogram calculated using DETX and DETY for each event in the final _common_clean file
| Quadrant A | 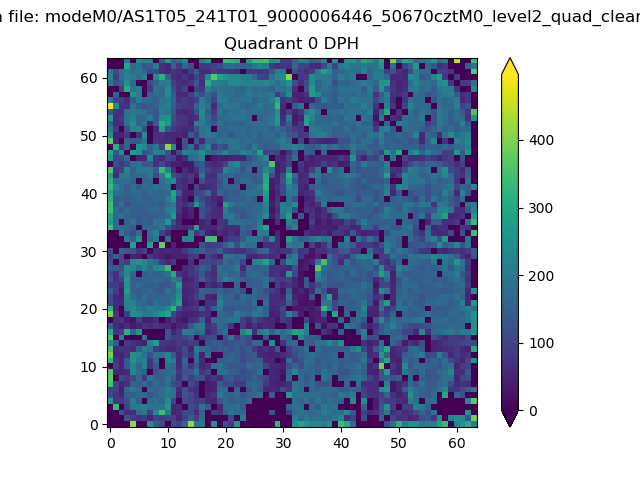 |
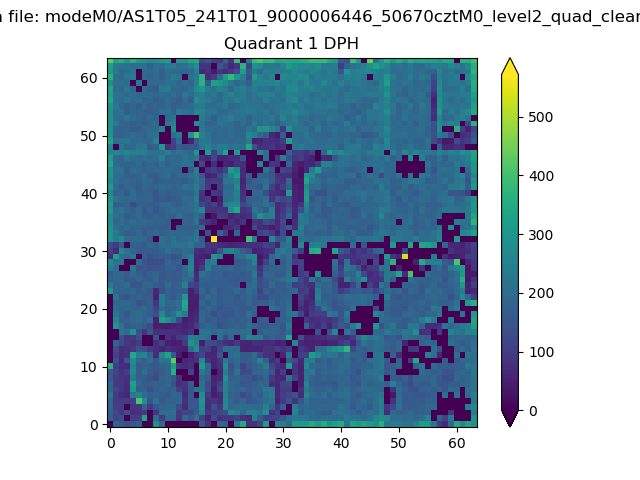 |
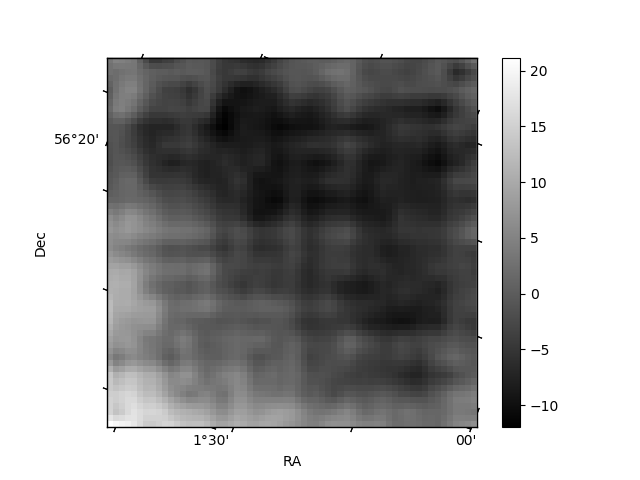
Quadrant B |
|---|---|---|---|
| Quadrant D | 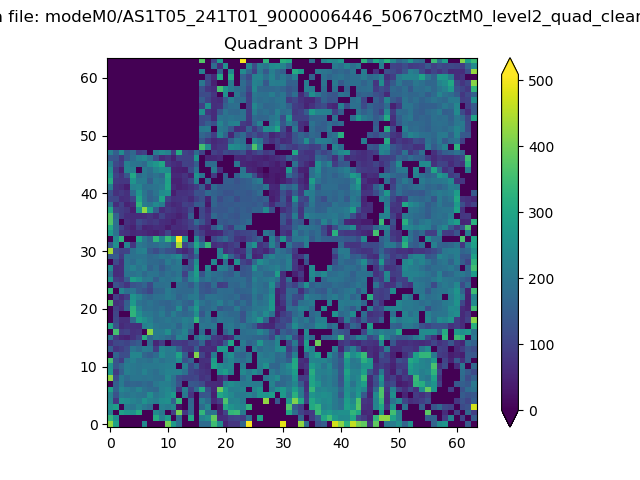 |
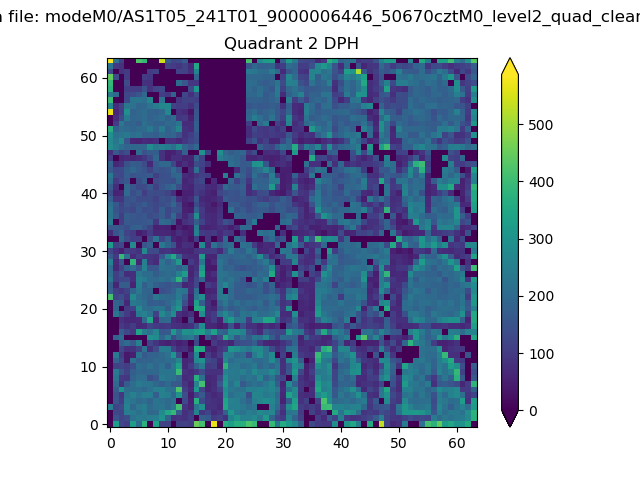 |
Quadrant C |
| Plot type | Count rate plots | Images |
|---|---|---|
| Comparison with Poisson distribution Blue bars denote a histogram of data divided into 1 sec bins. Red curve is a Poisson curve with rate = median count rate of data. |
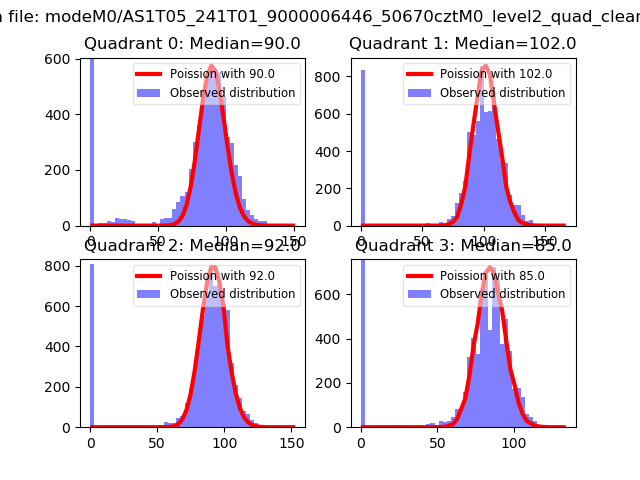 |
 |
| Quadrant-wise count rates Data is divided into 100 sec bins |
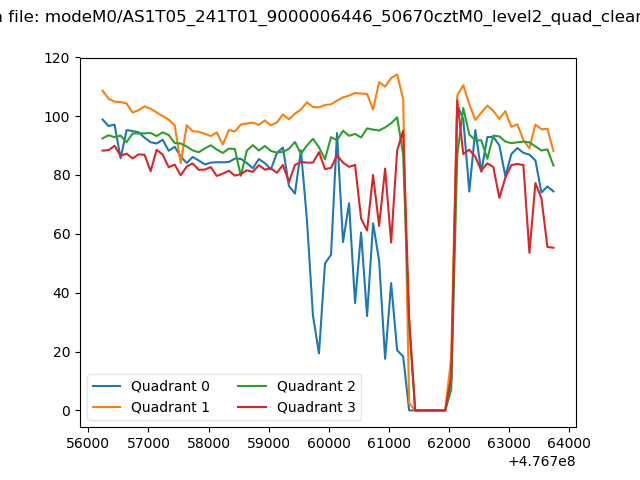 |
|
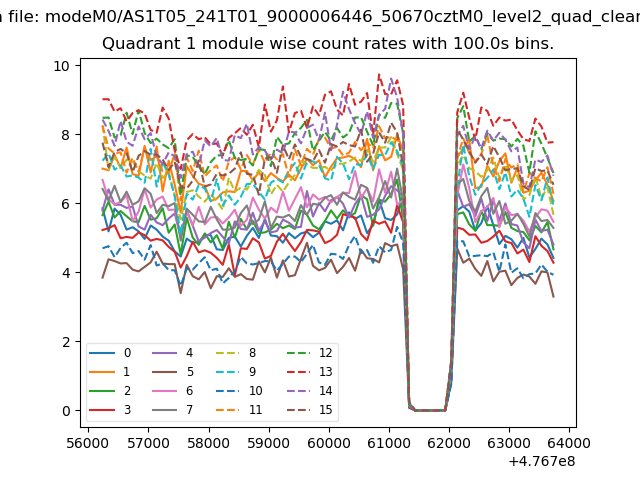
| Module-wise count rates for Quadrant A Data is divided into 100 sec bins |
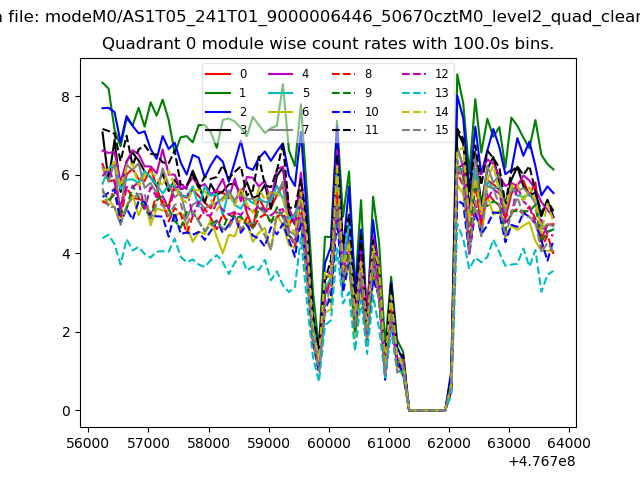 |
 |
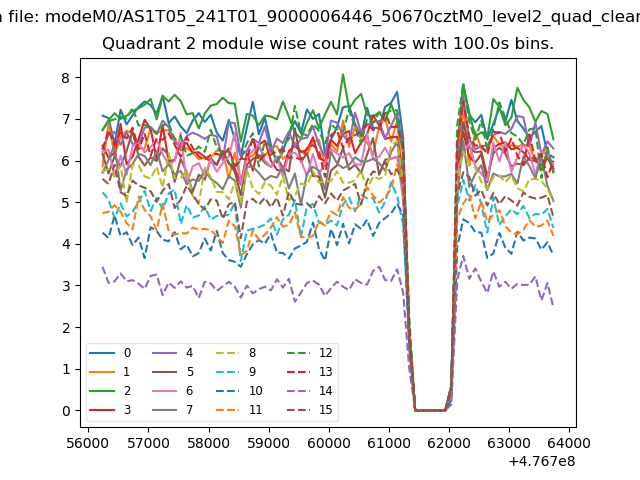
| Module-wise count rates for Quadrant B Data is divided into 100 sec bins |
 |
 |
| Module-wise count rates for Quadrant C Data is divided into 100 sec bins |
 |
 |
| Module-wise count rates for Quadrant D Data is divided into 100 sec bins |
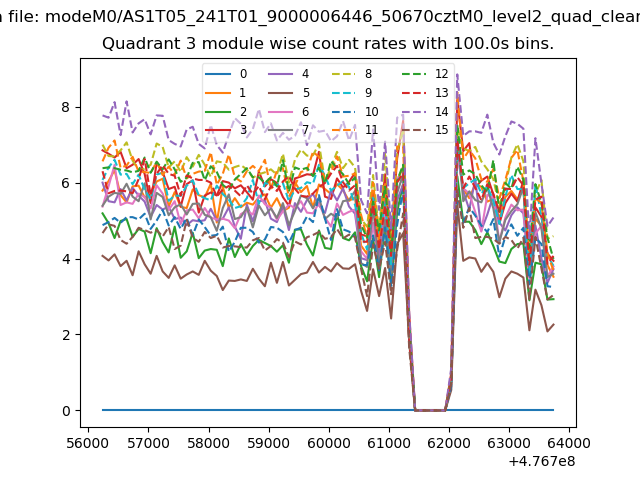 |
 |
| Parameter | Plot |
|---|---|
| CZT HV Monitor | 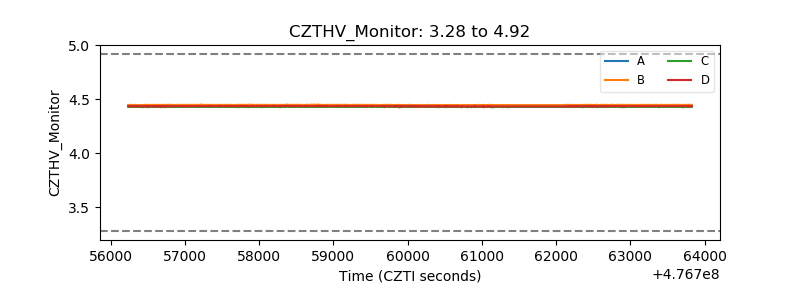 |
| D_VDD | 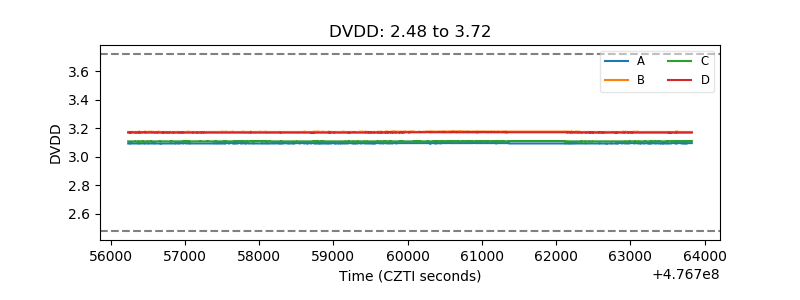 |
| Temperature 1 | 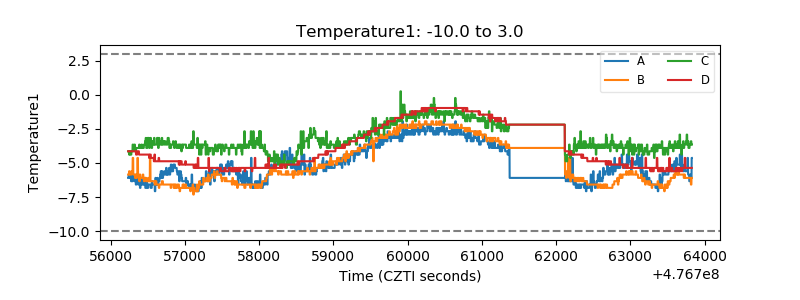 |
| Veto HV Monitor | 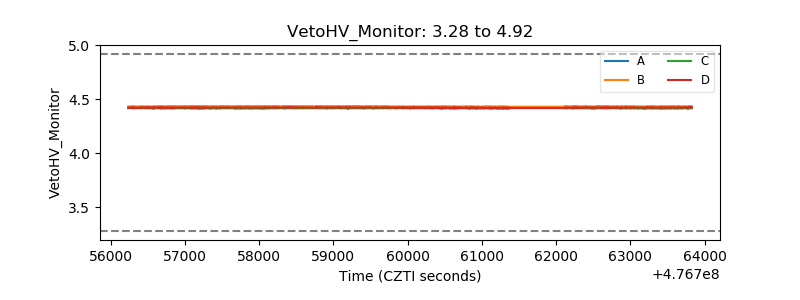 |
| Veto LLD | 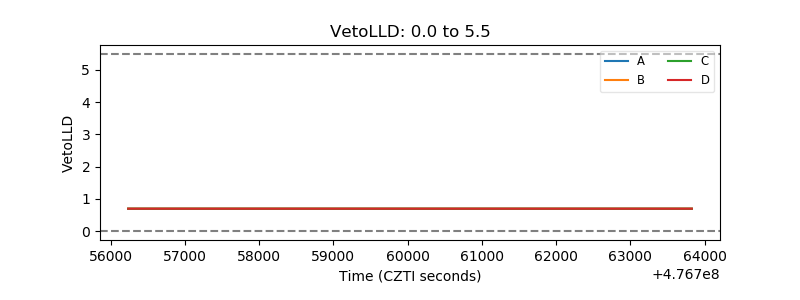 |
| Alpha Counter | 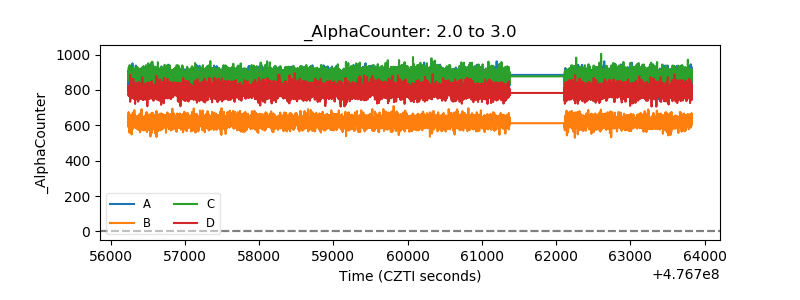 |
| _CPM_Rate | 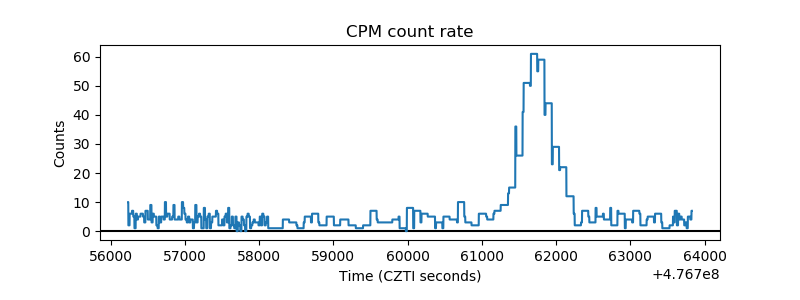 |
| CZT Counter | 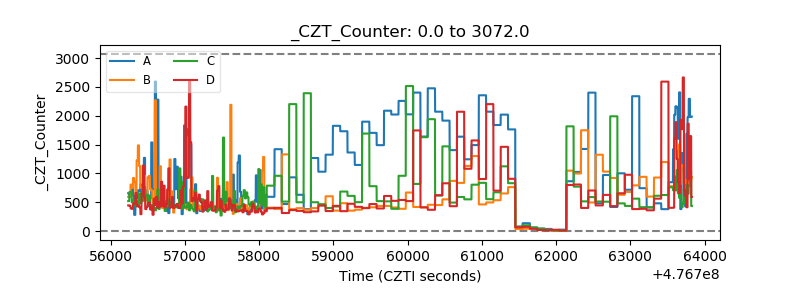 |
| +2.5 Volts monitor | 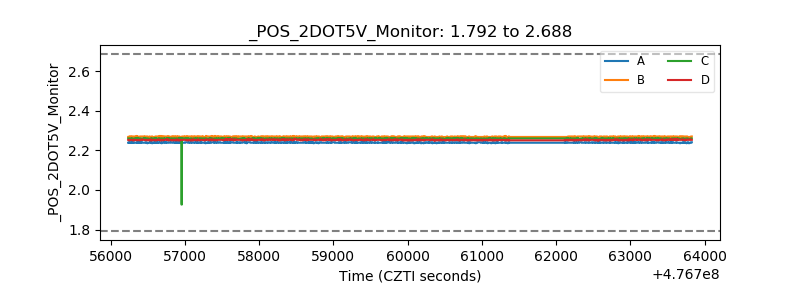 |
| +5 Volts monitor | 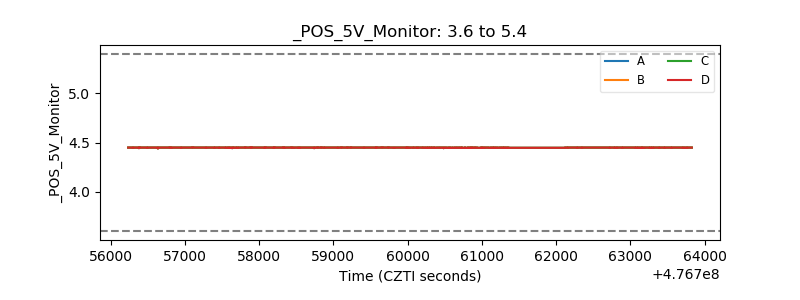 |
| _ROLL_ROT | 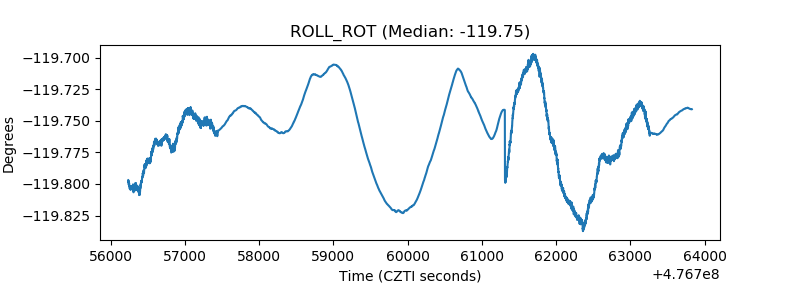 |
| _Roll_DEC | 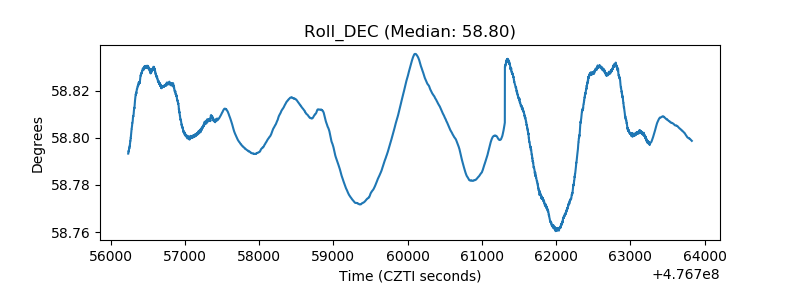 |
| _Roll_RA | 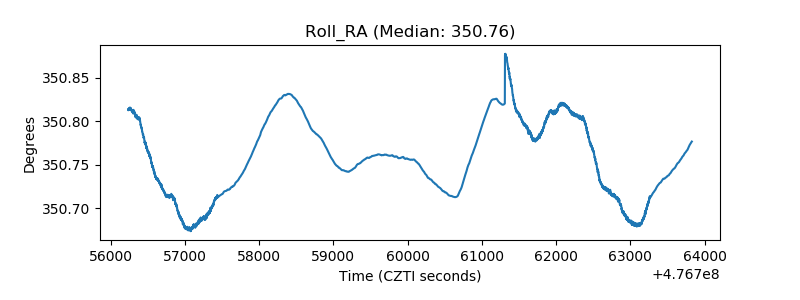 |
| Veto Counter | 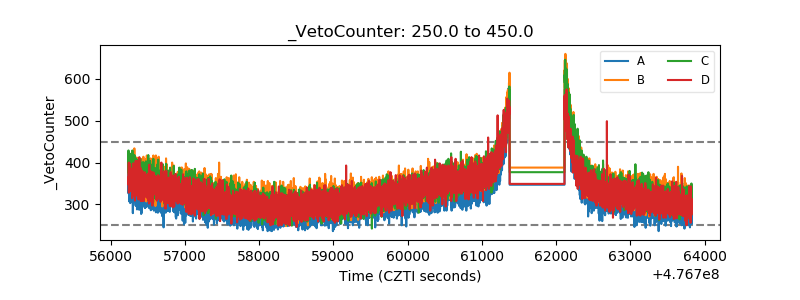 |