| Param | Original file | Final file |
|---|---|---|
| Filename | modeM0/AS1T05_241T01_9000006446_50671cztM0_level2.fits | modeM0/AS1T05_241T01_9000006446_50671cztM0_level2_quad_clean.evt |
| Size (bytes) | 734,863,680 | 107,487,360 |
| Size | 700.8 MB | 102.5 MB |
| Events in quadrant A | 5,909,283 | 695,920 |
| Events in quadrant B | 8,487,746 | 692,972 |
| Events in quadrant C | 5,941,285 | 700,495 |
| Events in quadrant D | 6,258,730 | 620,890 |
| Mode M9 | |||
|---|---|---|---|
| Quadrant | BADHDUFLAG | Total packets | Discarded packets |
| A | 0 | 9 | 0 |
| B | 0 | 9 | 0 |
| C | 0 | 9 | 0 |
| D | 0 | 9 | 0 |
| Mode M0 | |||
|---|---|---|---|
| Quadrant | BADHDUFLAG | Total packets | Discarded packets |
| A | 0 | 22822 | 2 |
| B | 0 | 30771 | 2 |
| C | 0 | 23147 | 2 |
| D | 0 | 24352 | 2 |
| Mode SS | |||
|---|---|---|---|
| Quadrant | BADHDUFLAG | Total packets | Discarded packets |
| A | 0 | 162 | 0 |
| B | 0 | 162 | 0 |
| C | 0 | 162 | 0 |
| D | 0 | 162 | 0 |
| Quadrant | Total seconds | Saturated seconds | Saturation percentage |
|---|---|---|---|
| A | 7824 | 563 | 7.195808% |
| B | 7824 | 1271 | 16.244888% |
| C | 7824 | 388 | 4.959100% |
| D | 7824 | 729 | 9.317485% |
Noise dominated data is calculated using 1-second bins in cleaned event files. If a bin has >2000 counts, and if more than 50% of those come from <1% of pixels, then it is considered to be noise-dominated and hence unusable.
| Quadrant | # 1 sec bins | Bins with >0 counts | Bins with >2000 counts | High rate bins dominated by noise | Noise dominated (total time) | Noise dominated (detector-on time) | Marked lightcurve |
|---|---|---|---|---|---|---|---|
| A | 8669 | 7827 | 404 | 404 | 4.66% | 5.16% | 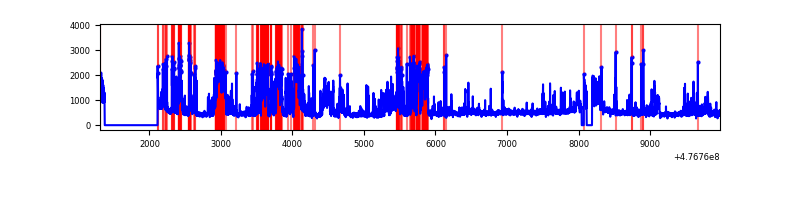 |
| B | 8669 | 7825 | 496 | 496 | 5.72% | 6.34% | 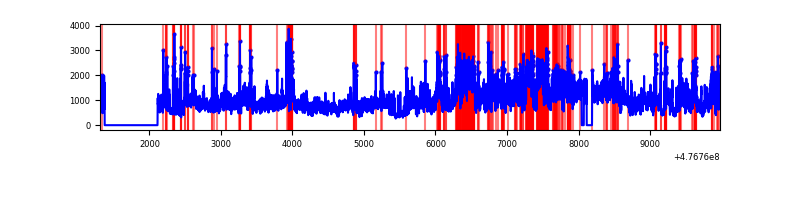 |
| C | 8669 | 7827 | 228 | 228 | 2.63% | 2.91% | 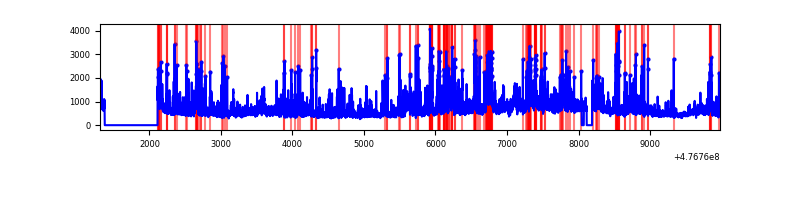 |
| D | 8669 | 7826 | 581 | 581 | 6.70% | 7.42% | 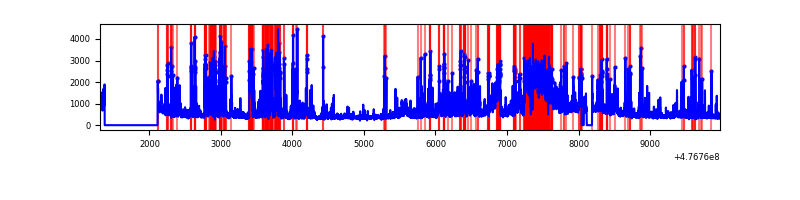 |
Top three noisy pixels from each quadrant. If the there are fewer than three noisy pixels in the level2.evt file, extra rows are filled as -1
| Pixel properties | Quadrant properties | ||||||
|---|---|---|---|---|---|---|---|
| Quadrant | DetID | PixID | Counts | Sigma | Mean | Median | Sigma |
| A | 12 | 80 | 1861189 | 9028.06 | 833 | 812 | 206.1 |
| A | 4 | 3 | 180506 | 872.02 | 833 | 812 | 206.1 |
| A | 5 | 240 | 95900 | 461.44 | 833 | 812 | 206.1 |
| B | 4 | 170 | 3948156 | 22950.9 | 812 | 784 | 172.0 |
| B | 0 | 229 | 231293 | 1340.23 | 812 | 784 | 172.0 |
| B | 5 | 185 | 211780 | 1226.78 | 812 | 784 | 172.0 |
| C | 13 | 113 | 1072361 | 4710.63 | 823 | 815 | 227.5 |
| C | 13 | 3 | 234372 | 1026.74 | 823 | 815 | 227.5 |
| C | 14 | 254 | 220280 | 964.79 | 823 | 815 | 227.5 |
| D | 8 | 129 | 983800 | 4451.08 | 797 | 766 | 220.9 |
| D | 0 | 33 | 862231 | 3900.63 | 797 | 766 | 220.9 |
| D | 2 | 249 | 369799 | 1670.95 | 797 | 766 | 220.9 |
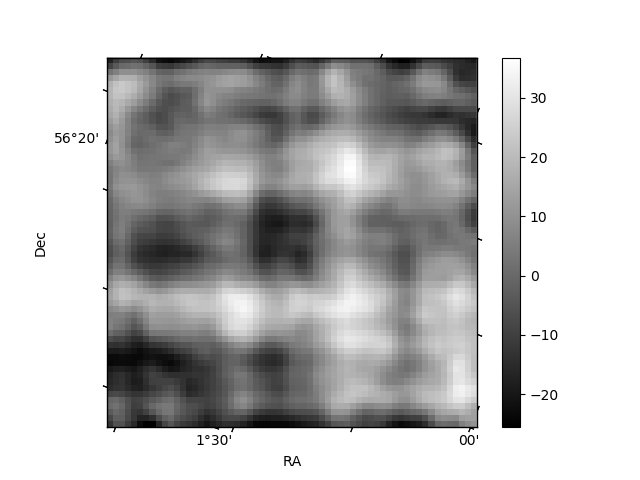
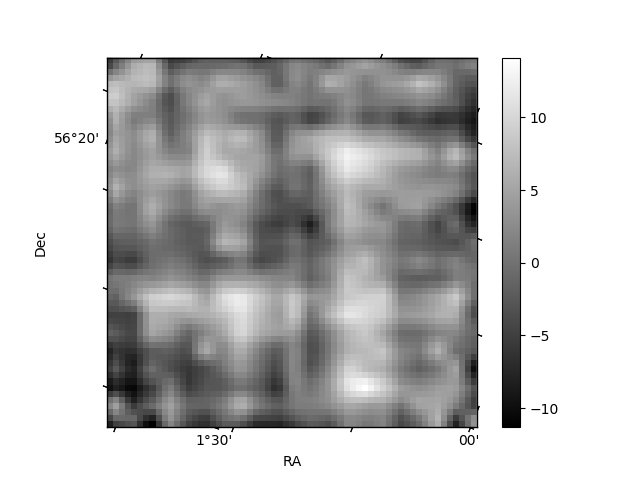
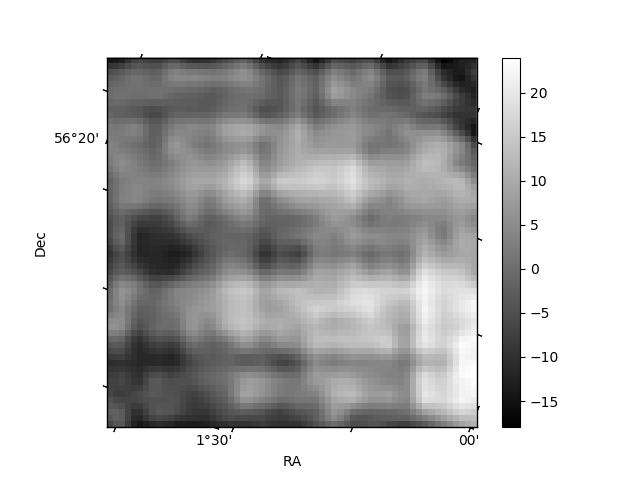
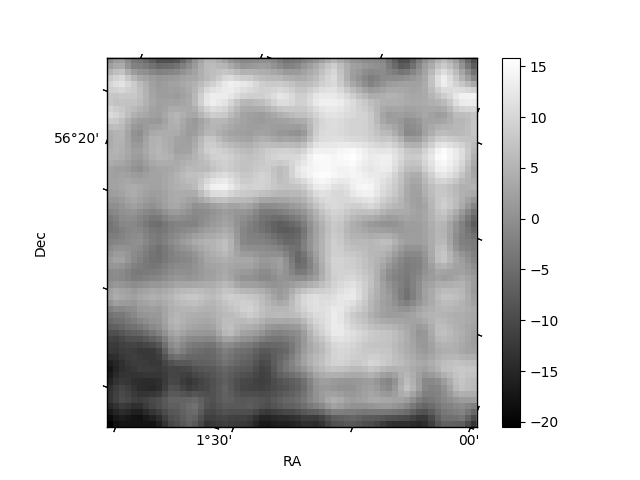
Histogram calculated using DETX and DETY for each event in the final _common_clean file
| Quadrant A | 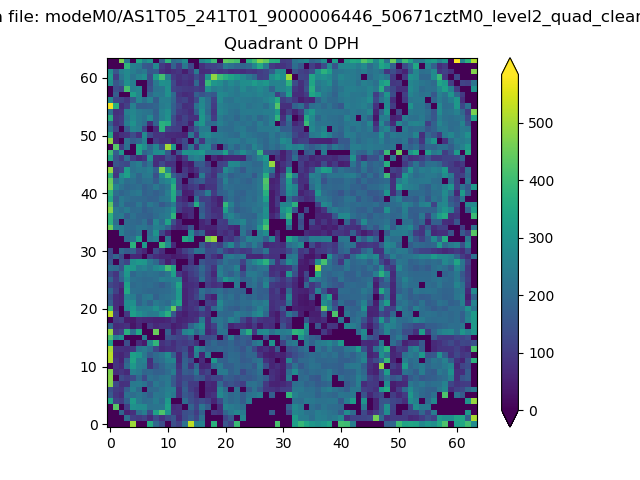 |
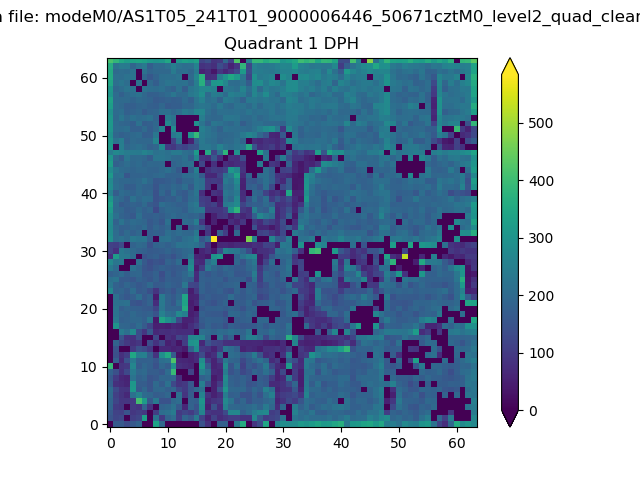 |
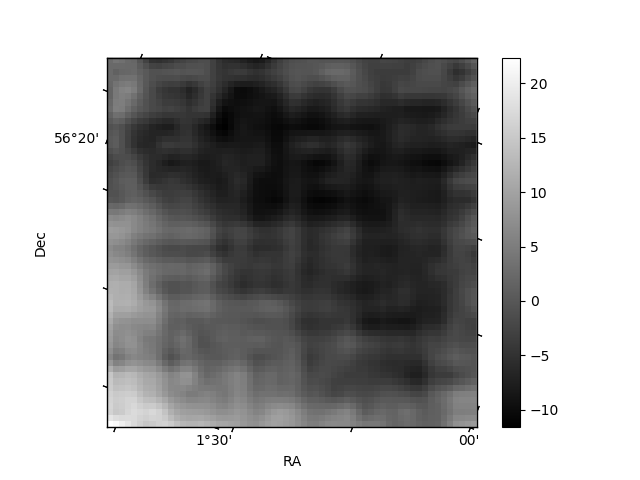
Quadrant B |
|---|---|---|---|
| Quadrant D | 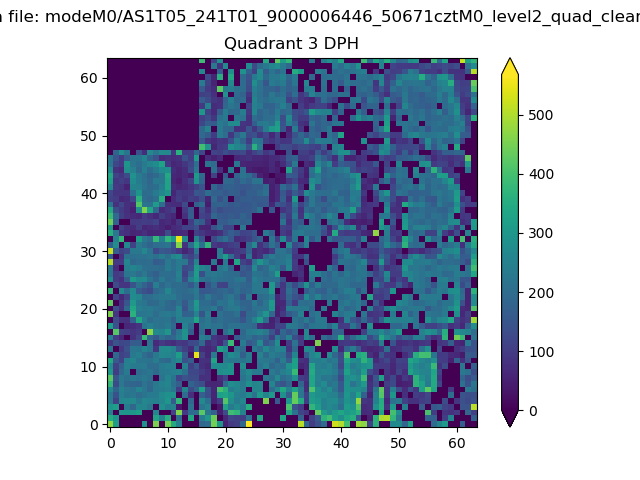 |
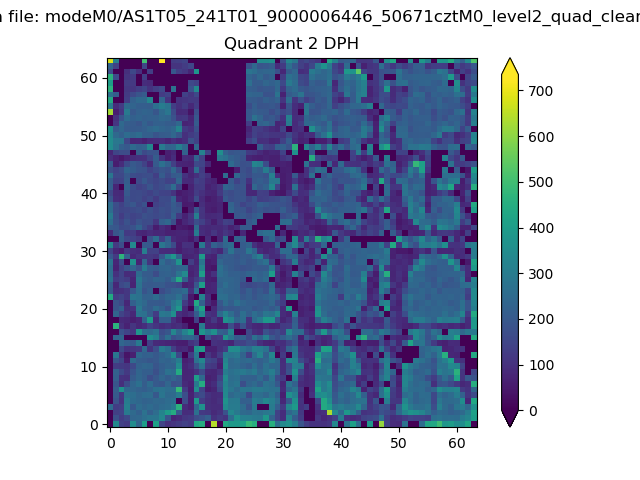 |
Quadrant C |
| Plot type | Count rate plots | Images |
|---|---|---|
| Comparison with Poisson distribution Blue bars denote a histogram of data divided into 1 sec bins. Red curve is a Poisson curve with rate = median count rate of data. |
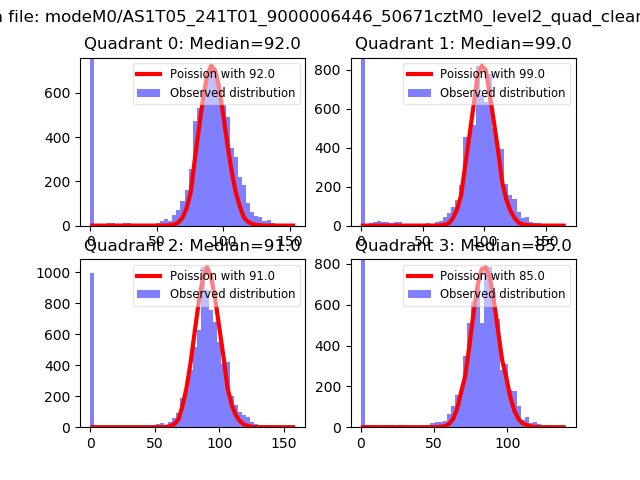 |
 |
| Quadrant-wise count rates Data is divided into 100 sec bins |
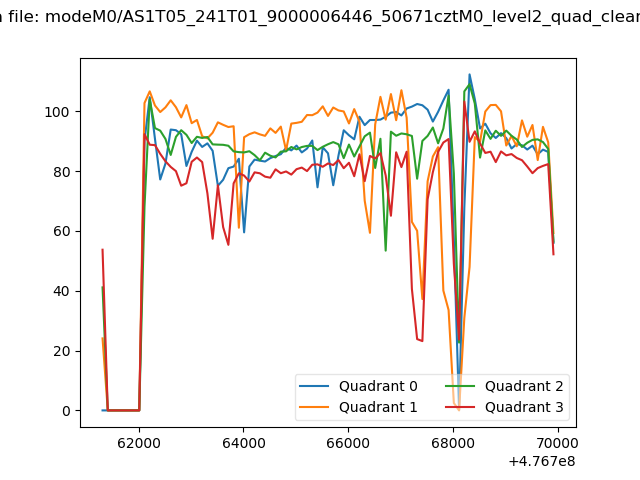 |
|
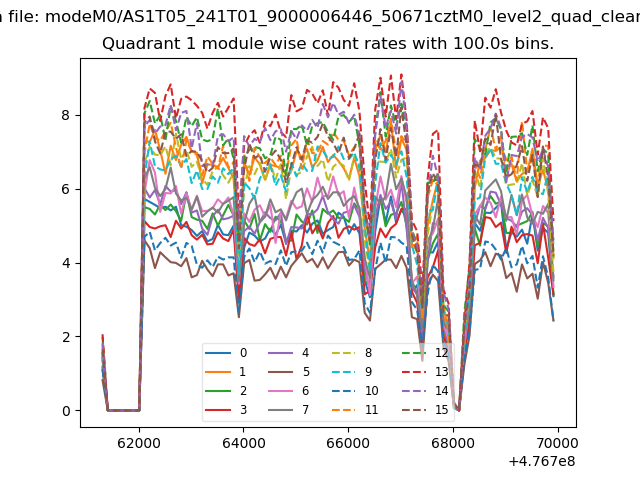
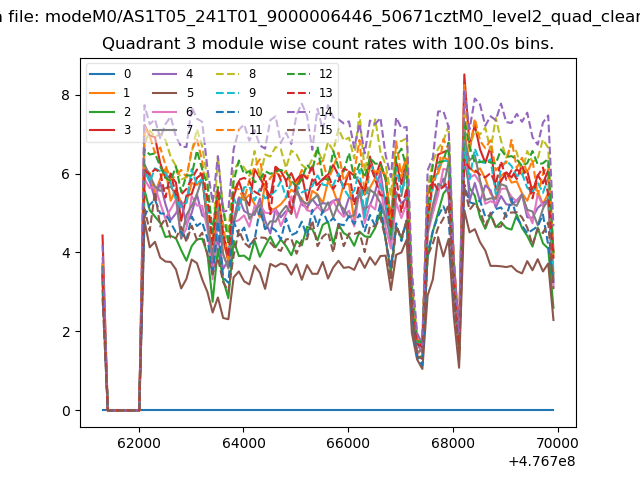
| Module-wise count rates for Quadrant A Data is divided into 100 sec bins |
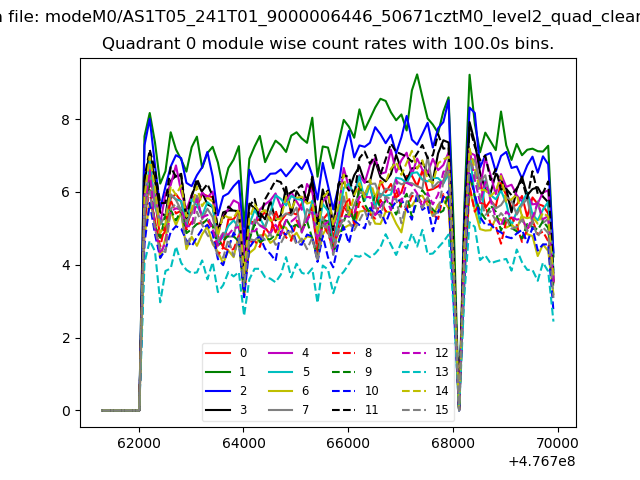 |
 |
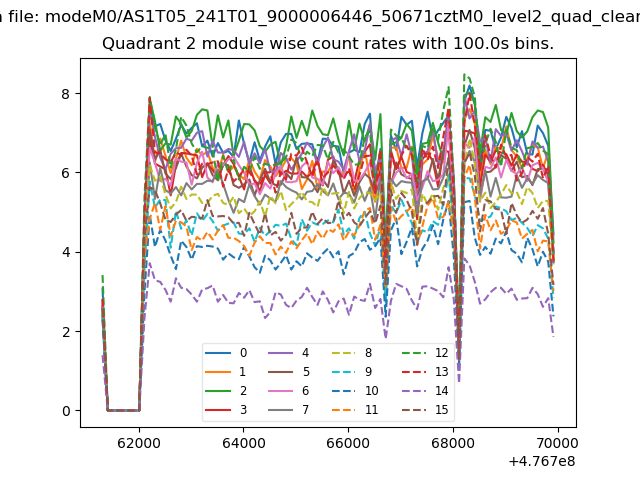
| Module-wise count rates for Quadrant B Data is divided into 100 sec bins |
 |
 |
| Module-wise count rates for Quadrant C Data is divided into 100 sec bins |
 |
 |
| Module-wise count rates for Quadrant D Data is divided into 100 sec bins |
 |
 |
| Parameter | Plot |
|---|---|
| CZT HV Monitor | 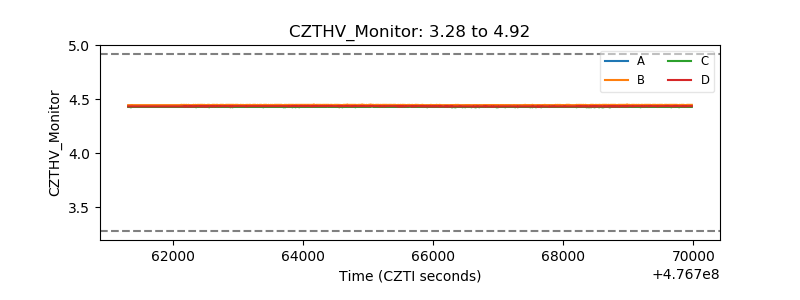 |
| D_VDD | 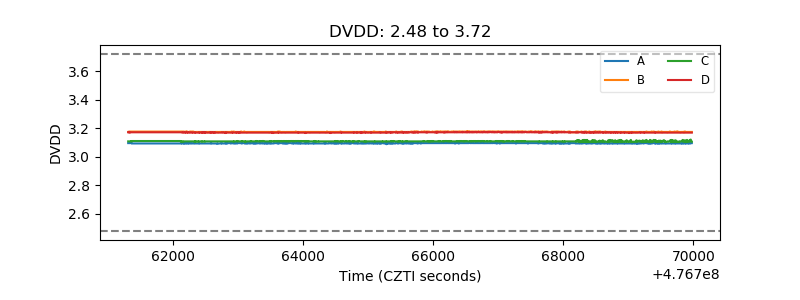 |
| Temperature 1 | 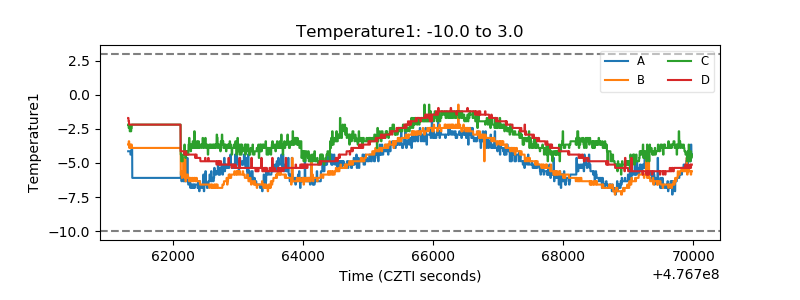 |
| Veto HV Monitor |  |
| Veto LLD | 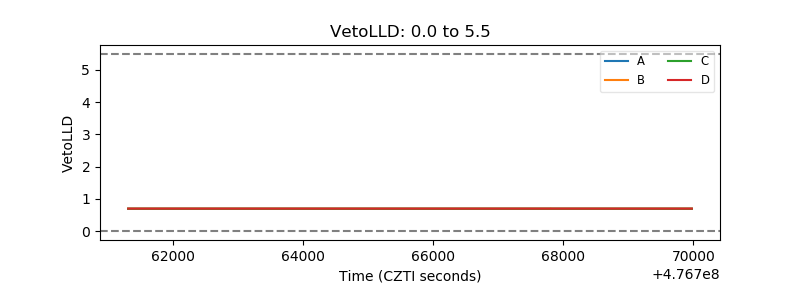 |
| Alpha Counter | 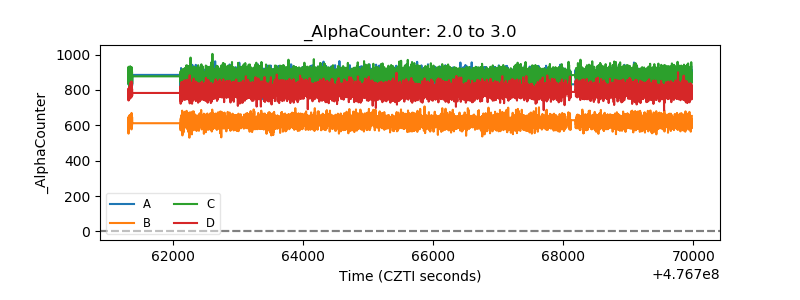 |
| _CPM_Rate | 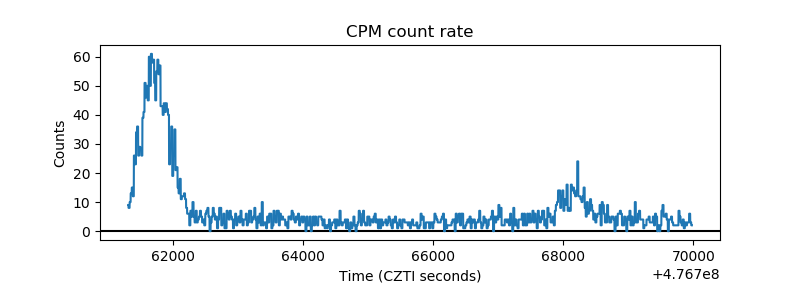 |
| CZT Counter | 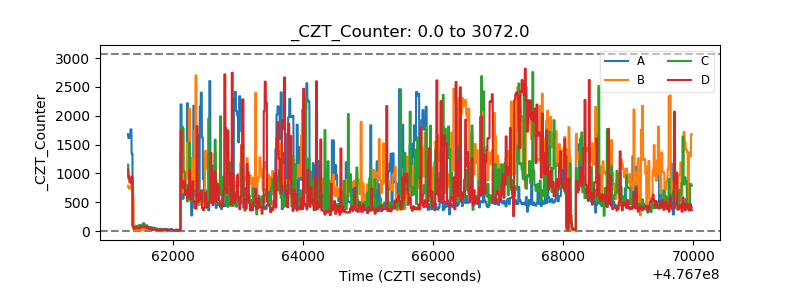 |
| +2.5 Volts monitor | 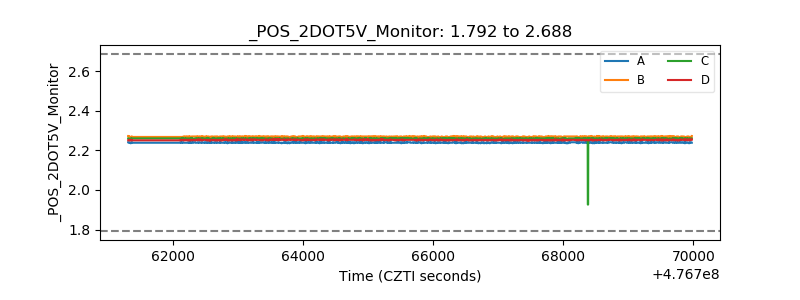 |
| +5 Volts monitor | 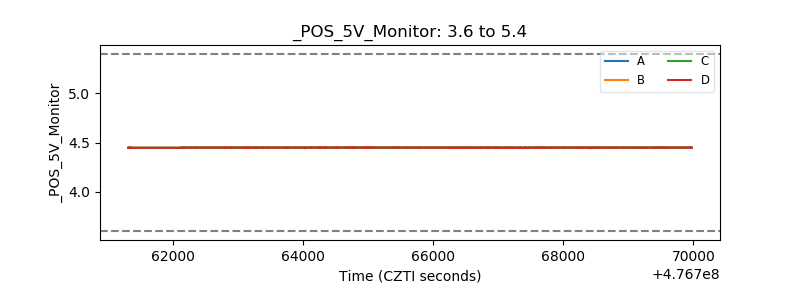 |
| _ROLL_ROT | 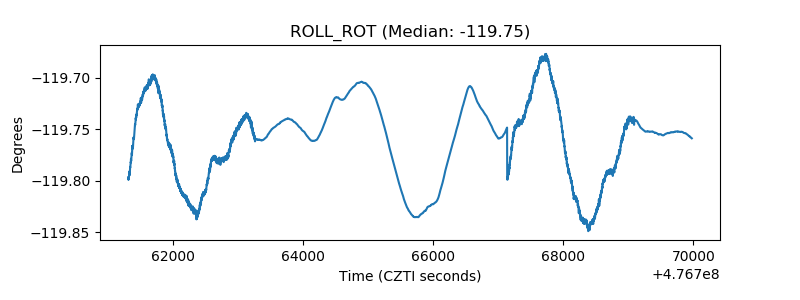 |
| _Roll_DEC | 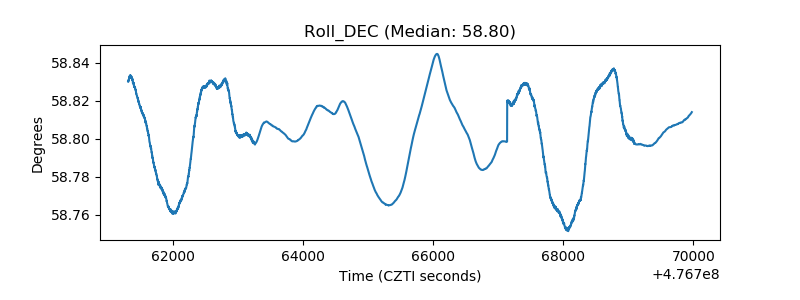 |
| _Roll_RA | 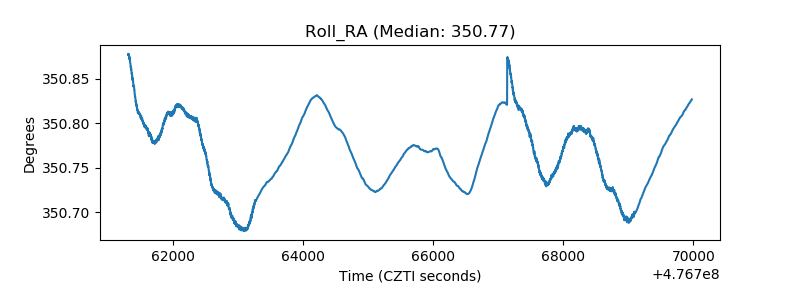 |
| Veto Counter | 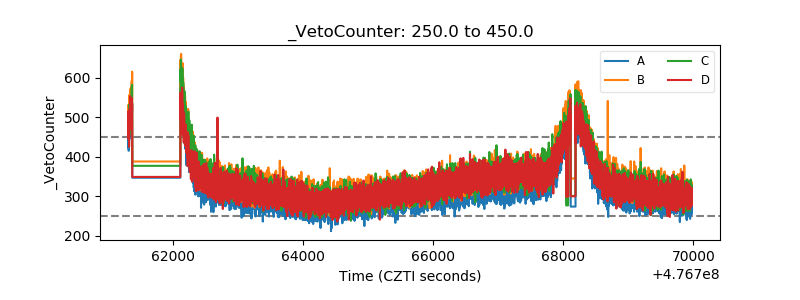 |