| Param | Original file | Final file |
|---|---|---|
| Filename | modeM0/AS1T05_241T01_9000006446_50672cztM0_level2.fits | modeM0/AS1T05_241T01_9000006446_50672cztM0_level2_quad_clean.evt |
| Size (bytes) | 600,624,000 | 113,086,080 |
| Size | 572.8 MB | 107.8 MB |
| Events in quadrant A | 4,625,146 | 720,958 |
| Events in quadrant B | 7,150,750 | 769,100 |
| Events in quadrant C | 4,838,456 | 721,618 |
| Events in quadrant D | 5,005,030 | 661,874 |
| Mode M0 | |||
|---|---|---|---|
| Quadrant | BADHDUFLAG | Total packets | Discarded packets |
| A | 0 | 19040 | 1 |
| B | 0 | 26703 | 19 |
| C | 0 | 19949 | 2 |
| D | 0 | 20739 | 6 |
| Mode SS | |||
|---|---|---|---|
| Quadrant | BADHDUFLAG | Total packets | Discarded packets |
| A | 0 | 158 | 0 |
| B | 0 | 158 | 0 |
| C | 0 | 158 | 0 |
| D | 0 | 158 | 0 |
| Quadrant | Total seconds | Saturated seconds | Saturation percentage |
|---|---|---|---|
| A | 7922 | 212 | 2.676092% |
| B | 7919 | 511 | 6.452835% |
| C | 7922 | 140 | 1.767230% |
| D | 7920 | 258 | 3.257576% |
Noise dominated data is calculated using 1-second bins in cleaned event files. If a bin has >2000 counts, and if more than 50% of those come from <1% of pixels, then it is considered to be noise-dominated and hence unusable.
| Quadrant | # 1 sec bins | Bins with >0 counts | Bins with >2000 counts | High rate bins dominated by noise | Noise dominated (total time) | Noise dominated (detector-on time) | Marked lightcurve |
|---|---|---|---|---|---|---|---|
| A | 7922 | 7922 | 93 | 93 | 1.17% | 1.17% | 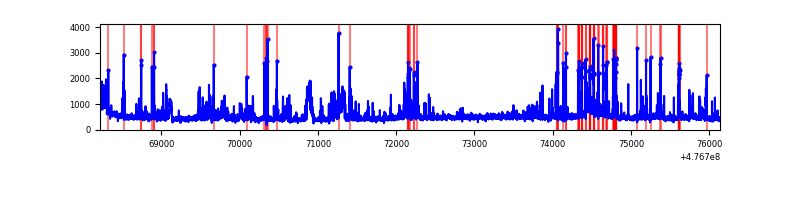 |
| B | 7919 | 7919 | 220 | 220 | 2.78% | 2.78% | 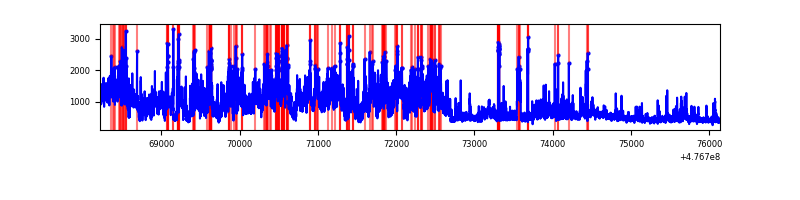 |
| C | 7922 | 7922 | 120 | 120 | 1.51% | 1.51% | 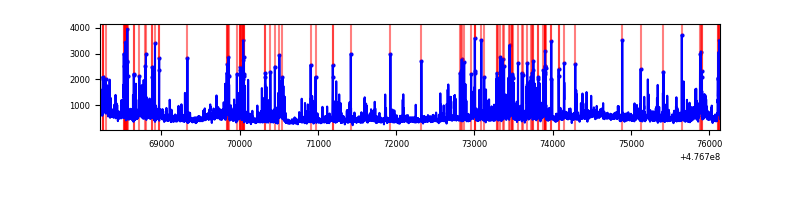 |
| D | 7920 | 7920 | 224 | 224 | 2.83% | 2.83% | 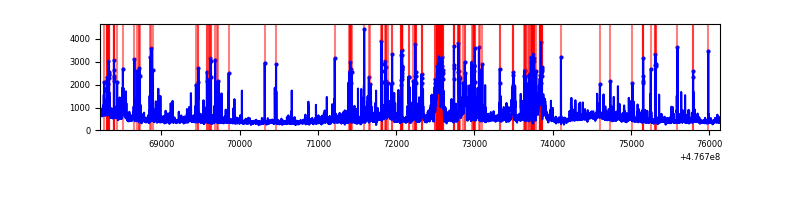 |
Top three noisy pixels from each quadrant. If the there are fewer than three noisy pixels in the level2.evt file, extra rows are filled as -1
| Pixel properties | Quadrant properties | ||||||
|---|---|---|---|---|---|---|---|
| Quadrant | DetID | PixID | Counts | Sigma | Mean | Median | Sigma |
| A | 12 | 80 | 329376 | 1578.33 | 836 | 815 | 208.2 |
| A | 4 | 3 | 222006 | 1062.55 | 836 | 815 | 208.2 |
| A | 5 | 240 | 153799 | 734.9 | 836 | 815 | 208.2 |
| B | 4 | 170 | 2158575 | 12260.31 | 830 | 804 | 176.0 |
| B | 3 | 249 | 455943 | 2586.07 | 830 | 804 | 176.0 |
| B | 10 | 247 | 324194 | 1837.48 | 830 | 804 | 176.0 |
| C | 15 | 224 | 379093 | 1655.47 | 827 | 820 | 228.5 |
| C | 13 | 3 | 360536 | 1574.25 | 827 | 820 | 228.5 |
| C | 15 | 174 | 222832 | 971.61 | 827 | 820 | 228.5 |
| D | 0 | 33 | 433798 | 1909.32 | 810 | 781 | 226.8 |
| D | 15 | 108 | 289825 | 1274.5 | 810 | 781 | 226.8 |
| D | 15 | 154 | 171521 | 752.85 | 810 | 781 | 226.8 |
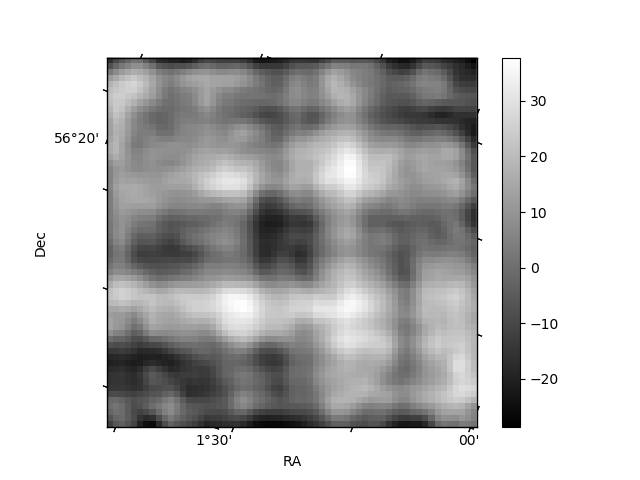
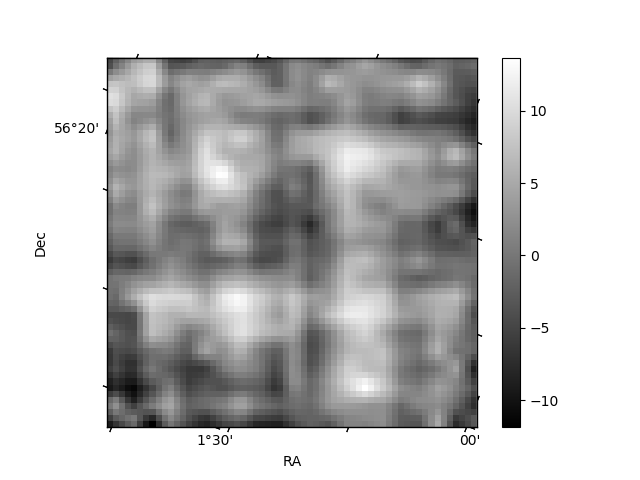
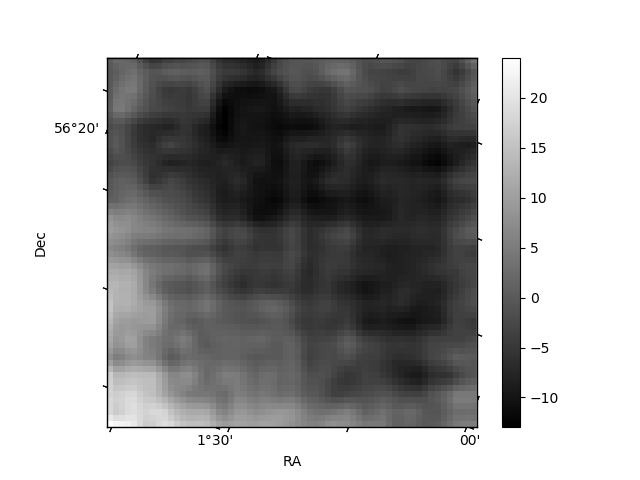
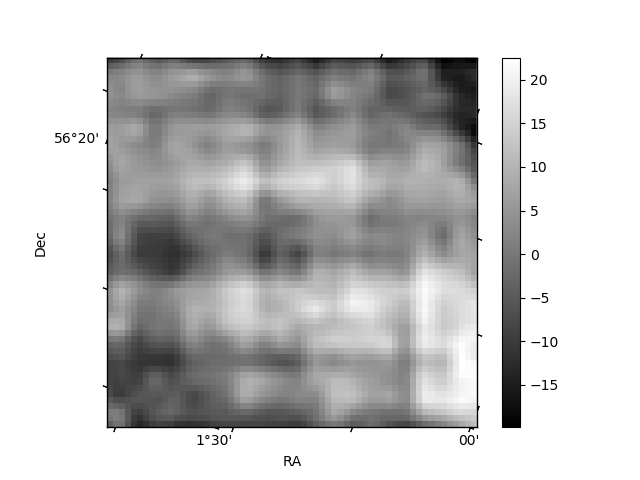
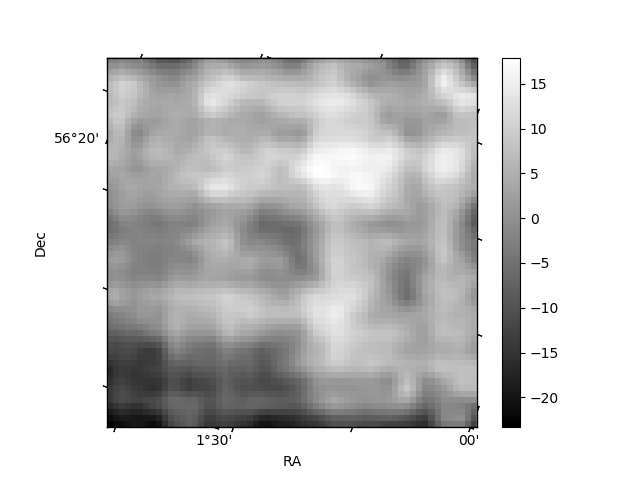
Histogram calculated using DETX and DETY for each event in the final _common_clean file
| Quadrant A | 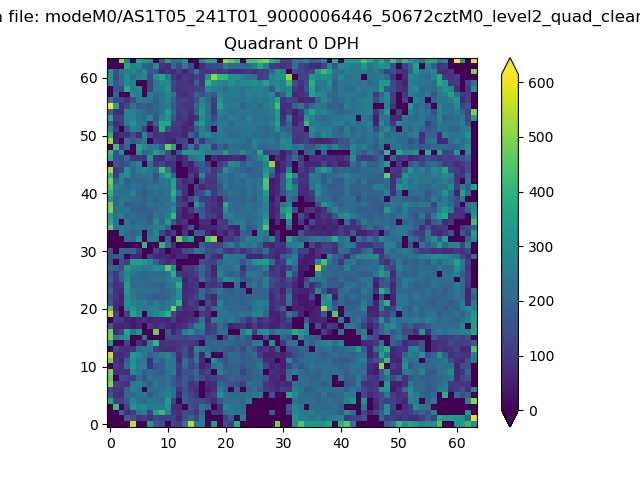 |
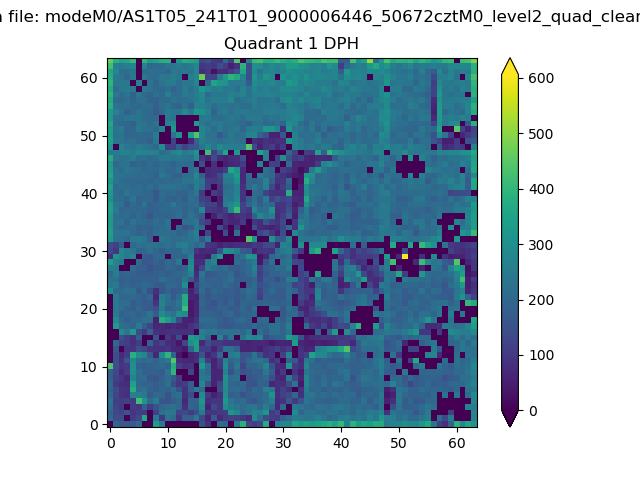 |
Quadrant B |
|---|---|---|---|
| Quadrant D | 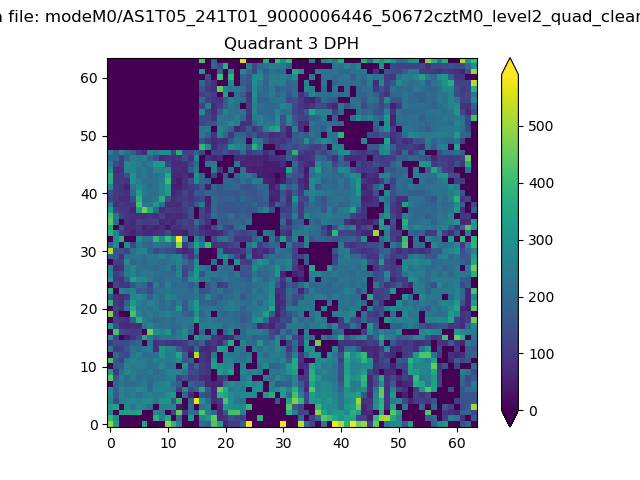 |
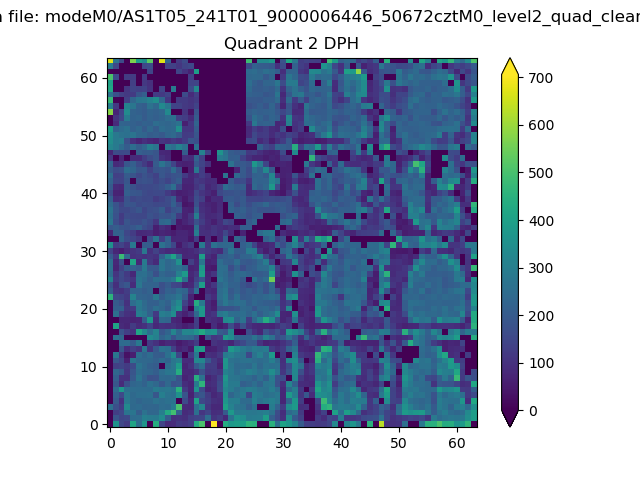 |
Quadrant C |
| Plot type | Count rate plots | Images |
|---|---|---|
| Comparison with Poisson distribution Blue bars denote a histogram of data divided into 1 sec bins. Red curve is a Poisson curve with rate = median count rate of data. |
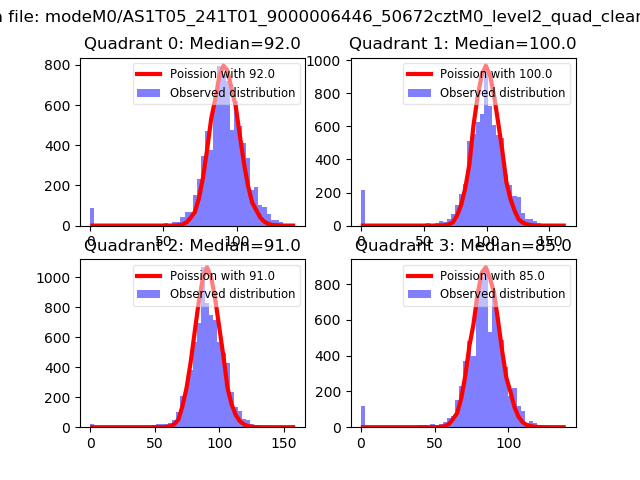 |
 |
| Quadrant-wise count rates Data is divided into 100 sec bins |
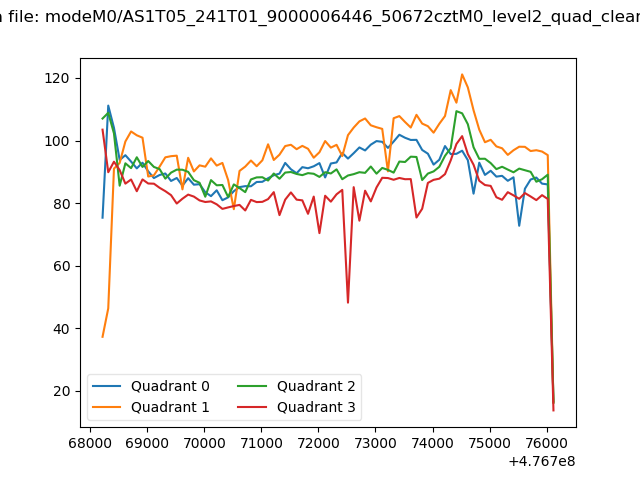 |
|
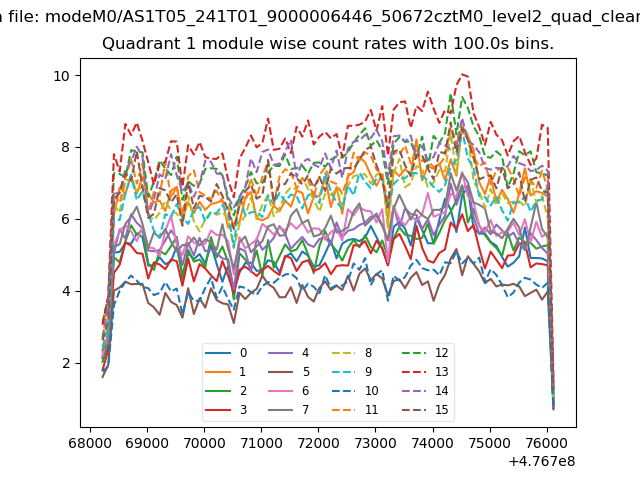
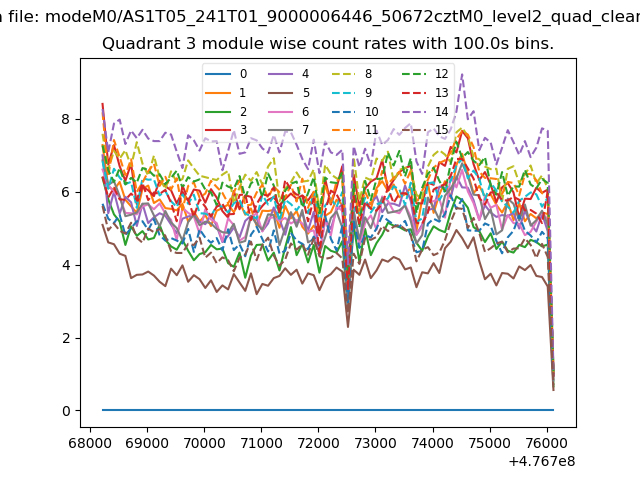
| Module-wise count rates for Quadrant A Data is divided into 100 sec bins |
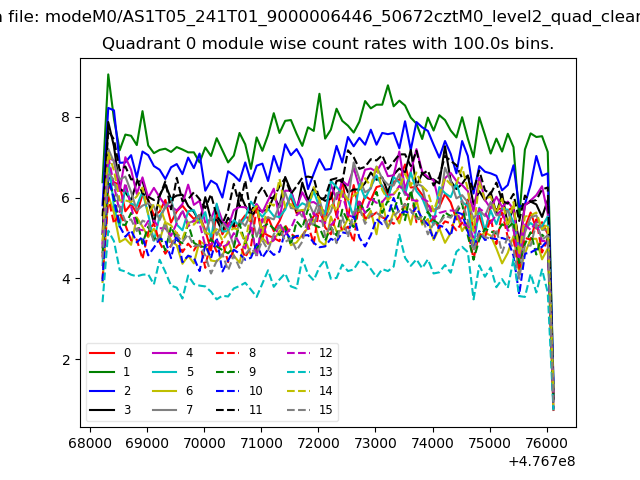 |
 |
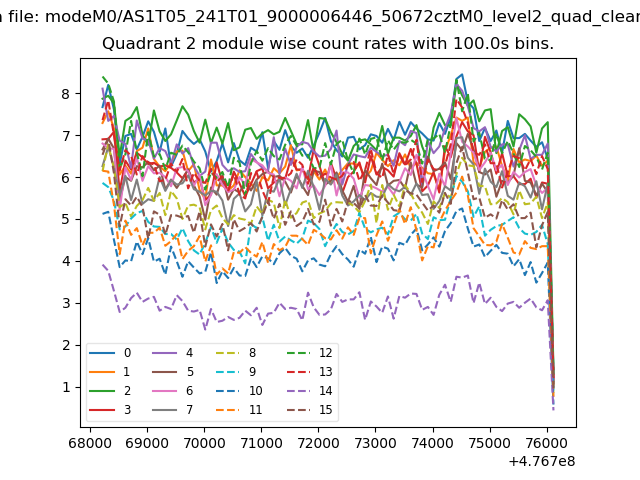
| Module-wise count rates for Quadrant B Data is divided into 100 sec bins |
 |
 |
| Module-wise count rates for Quadrant C Data is divided into 100 sec bins |
 |
 |
| Module-wise count rates for Quadrant D Data is divided into 100 sec bins |
 |
 |
| Parameter | Plot |
|---|---|
| CZT HV Monitor | 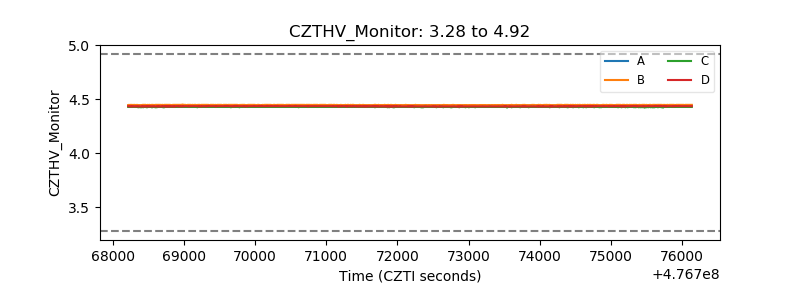 |
| D_VDD | 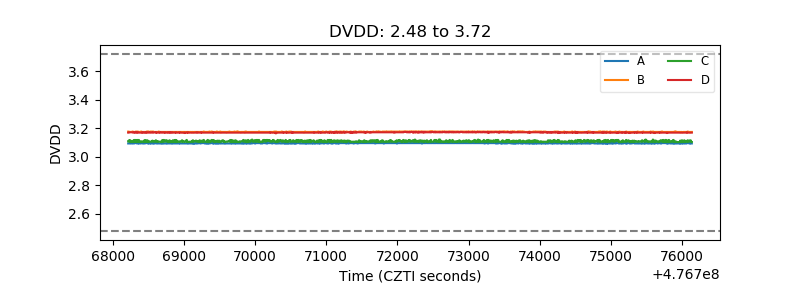 |
| Temperature 1 | 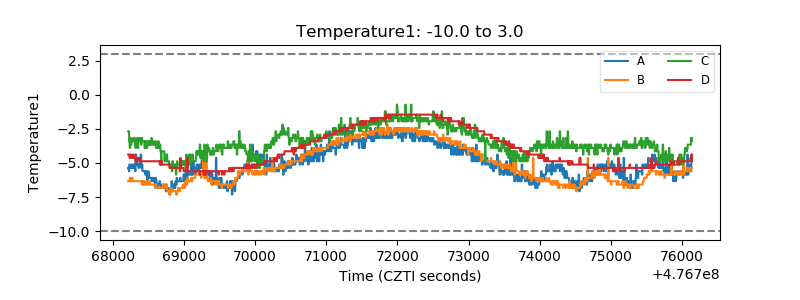 |
| Veto HV Monitor | 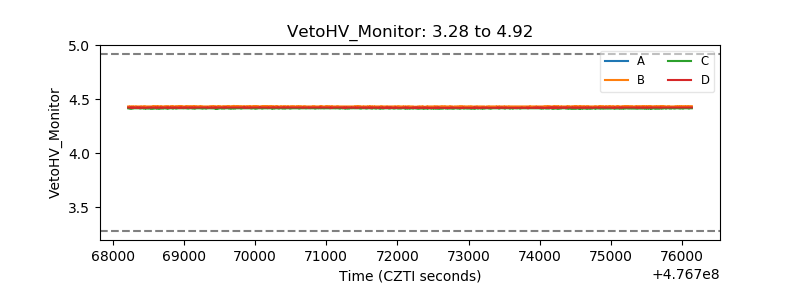 |
| Veto LLD | 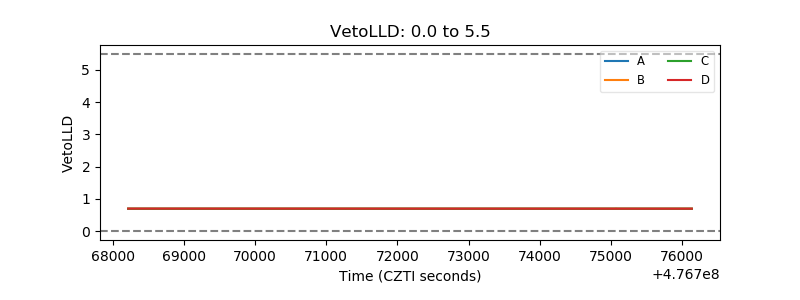 |
| Alpha Counter | 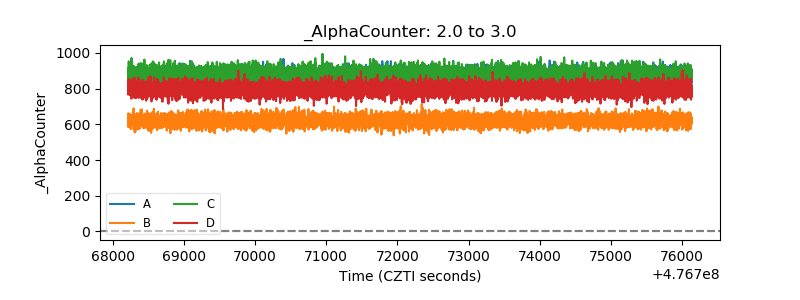 |
| _CPM_Rate | 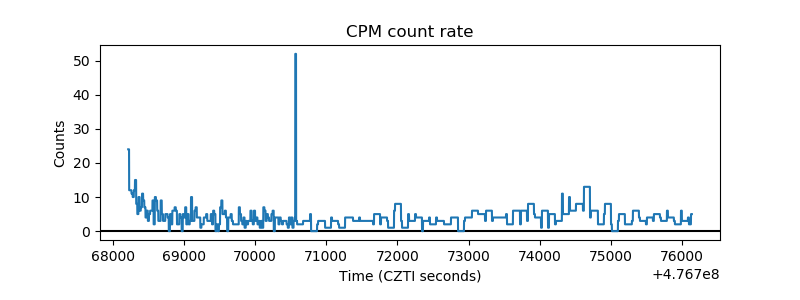 |
| CZT Counter | 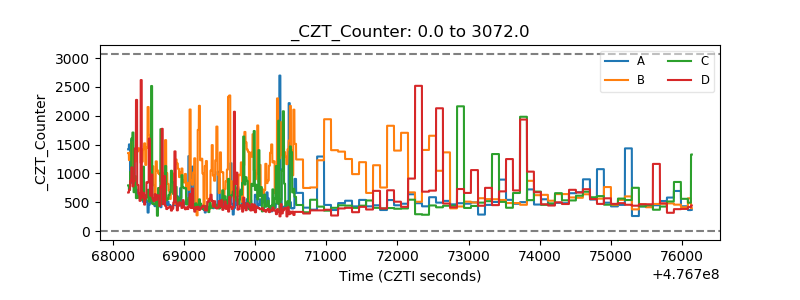 |
| +2.5 Volts monitor | 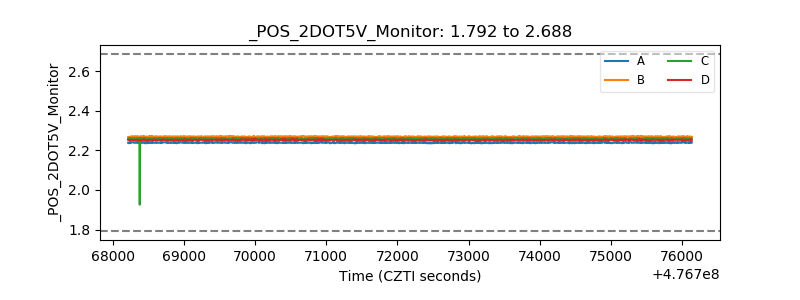 |
| +5 Volts monitor |  |
| _ROLL_ROT | 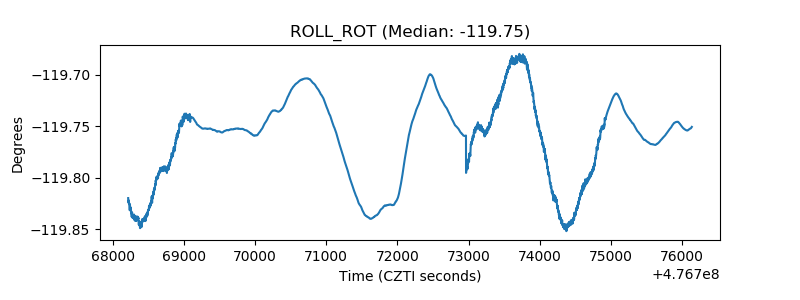 |
| _Roll_DEC | 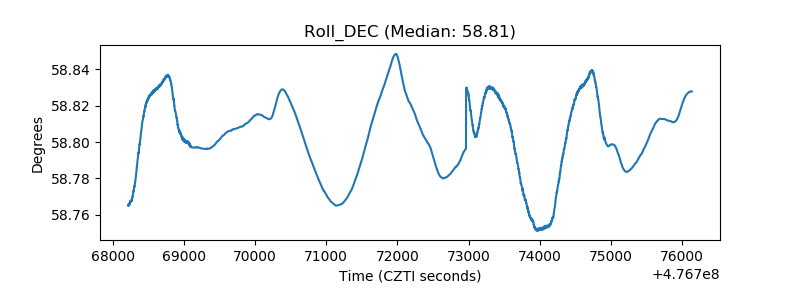 |
| _Roll_RA | 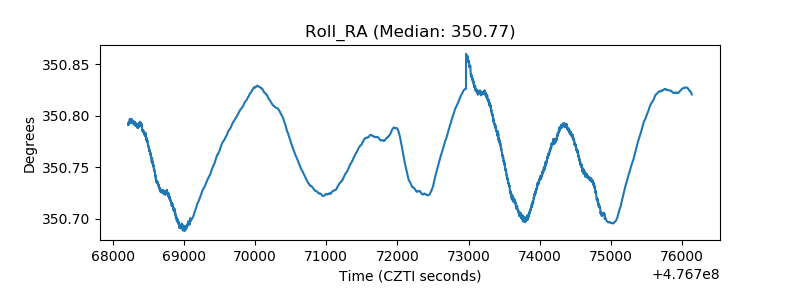 |
| Veto Counter | 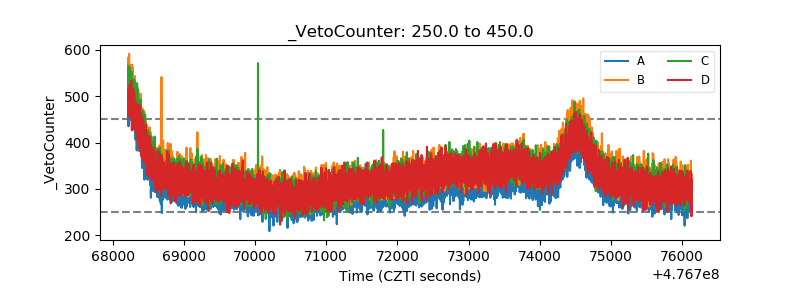 |