| Param | Original file | Final file |
|---|---|---|
| Filename | modeM0/AS1T05_241T01_9000006446_50673cztM0_level2.fits | modeM0/AS1T05_241T01_9000006446_50673cztM0_level2_quad_clean.evt |
| Size (bytes) | 646,191,360 | 102,576,960 |
| Size | 616.3 MB | 97.8 MB |
| Events in quadrant A | 5,722,806 | 660,722 |
| Events in quadrant B | 4,092,436 | 744,014 |
| Events in quadrant C | 7,841,328 | 581,029 |
| Events in quadrant D | 5,687,734 | 602,827 |
| Mode M0 | |||
|---|---|---|---|
| Quadrant | BADHDUFLAG | Total packets | Discarded packets |
| A | 0 | 22119 | 0 |
| B | 0 | 17561 | 0 |
| C | 0 | 28501 | 0 |
| D | 0 | 22406 | 0 |
| Mode SS | |||
|---|---|---|---|
| Quadrant | BADHDUFLAG | Total packets | Discarded packets |
| A | 0 | 148 | 0 |
| B | 0 | 148 | 0 |
| C | 0 | 148 | 0 |
| D | 0 | 148 | 0 |
| Quadrant | Total seconds | Saturated seconds | Saturation percentage |
|---|---|---|---|
| A | 7431 | 336 | 4.521599% |
| B | 7432 | 116 | 1.560818% |
| C | 7432 | 1197 | 16.106028% |
| D | 7432 | 371 | 4.991927% |
Noise dominated data is calculated using 1-second bins in cleaned event files. If a bin has >2000 counts, and if more than 50% of those come from <1% of pixels, then it is considered to be noise-dominated and hence unusable.
| Quadrant | # 1 sec bins | Bins with >0 counts | Bins with >2000 counts | High rate bins dominated by noise | Noise dominated (total time) | Noise dominated (detector-on time) | Marked lightcurve |
|---|---|---|---|---|---|---|---|
| A | 7431 | 7431 | 163 | 163 | 2.19% | 2.19% | 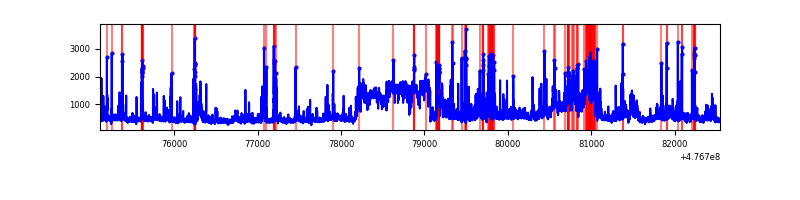 |
| B | 7432 | 7432 | 82 | 82 | 1.10% | 1.10% | 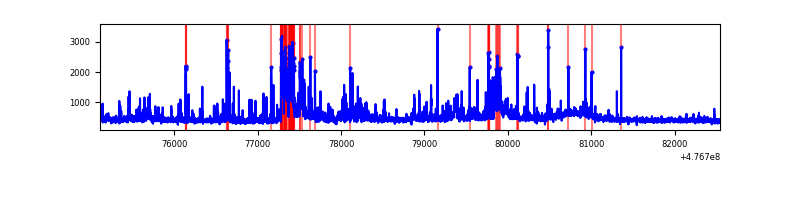 |
| C | 7432 | 7432 | 980 | 980 | 13.19% | 13.19% | 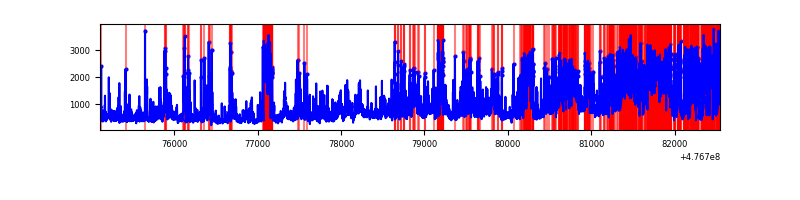 |
| D | 7432 | 7432 | 399 | 399 | 5.37% | 5.37% | 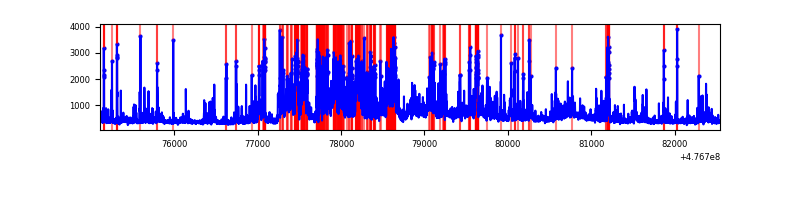 |
Top three noisy pixels from each quadrant. If the there are fewer than three noisy pixels in the level2.evt file, extra rows are filled as -1
| Pixel properties | Quadrant properties | ||||||
|---|---|---|---|---|---|---|---|
| Quadrant | DetID | PixID | Counts | Sigma | Mean | Median | Sigma |
| A | 12 | 80 | 1099322 | 5810.05 | 768 | 749 | 189.1 |
| A | 10 | 253 | 407595 | 2151.7 | 768 | 749 | 189.1 |
| A | 8 | 246 | 208427 | 1098.35 | 768 | 749 | 189.1 |
| B | 0 | 229 | 436091 | 2628.12 | 779 | 752 | 165.6 |
| B | 10 | 247 | 148674 | 893.0 | 779 | 752 | 165.6 |
| B | 4 | 170 | 64161 | 382.8 | 779 | 752 | 165.6 |
| C | 15 | 174 | 3032674 | 15399.75 | 714 | 708 | 196.9 |
| C | 1 | 44 | 1017753 | 5165.7 | 714 | 708 | 196.9 |
| C | 13 | 3 | 209703 | 1061.51 | 714 | 708 | 196.9 |
| D | 15 | 185 | 611734 | 2959.64 | 743 | 716 | 206.5 |
| D | 7 | 110 | 566202 | 2739.09 | 743 | 716 | 206.5 |
| D | 2 | 249 | 285007 | 1377.05 | 743 | 716 | 206.5 |
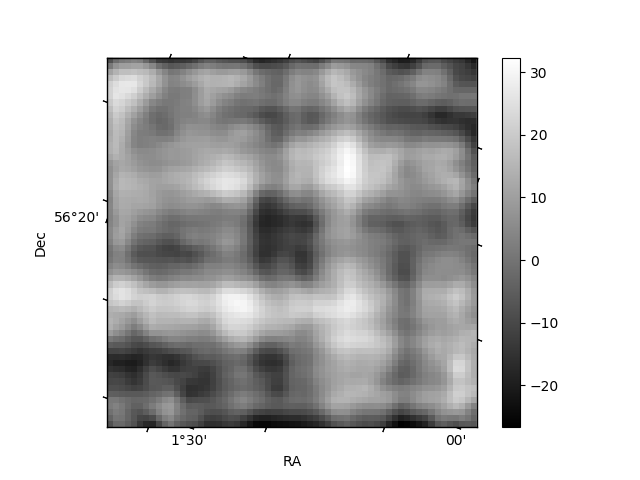
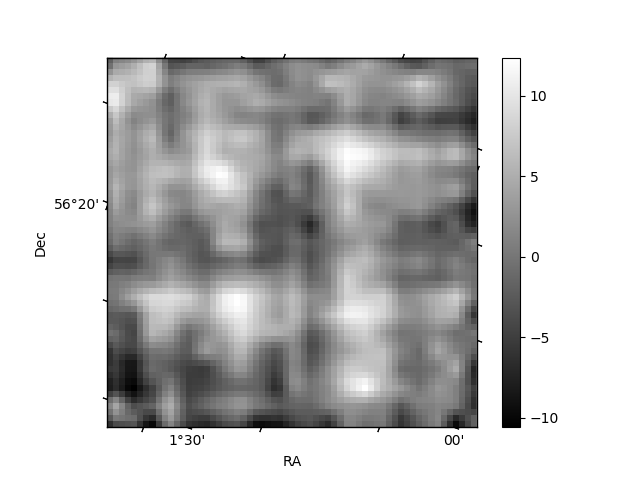
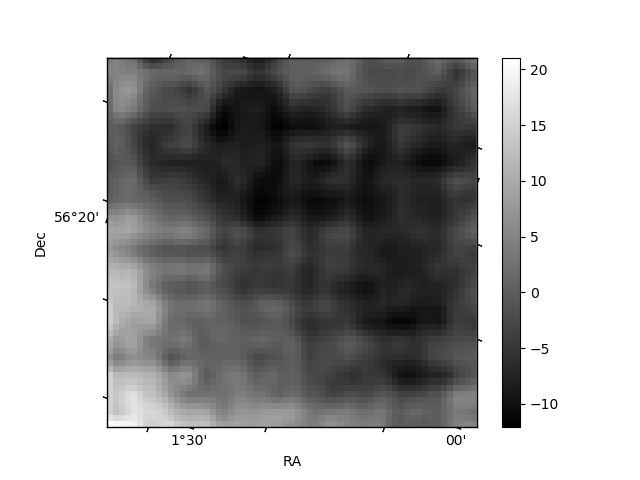
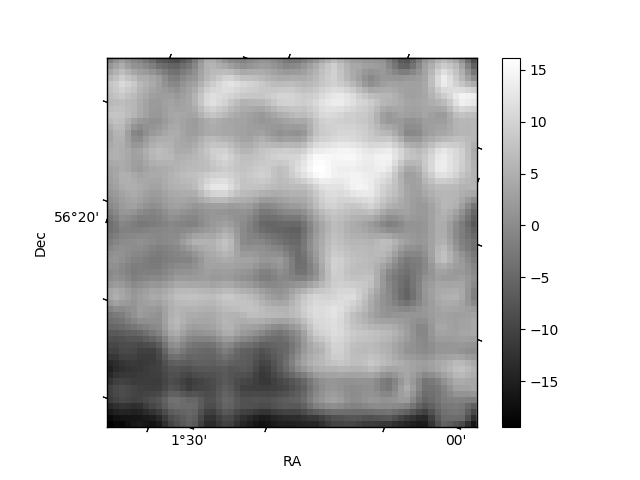
Histogram calculated using DETX and DETY for each event in the final _common_clean file
| Quadrant A | 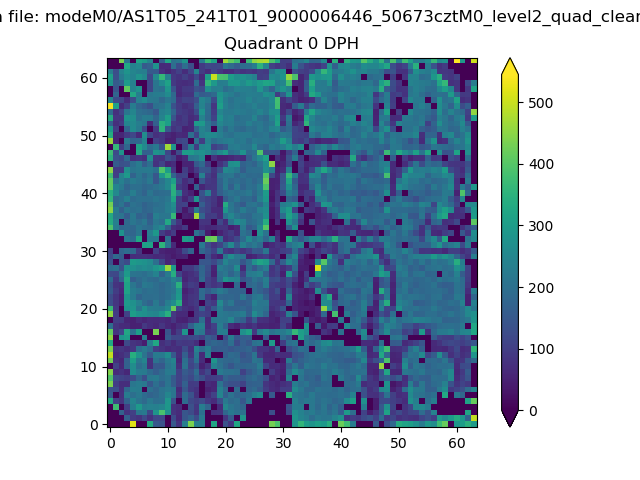 |
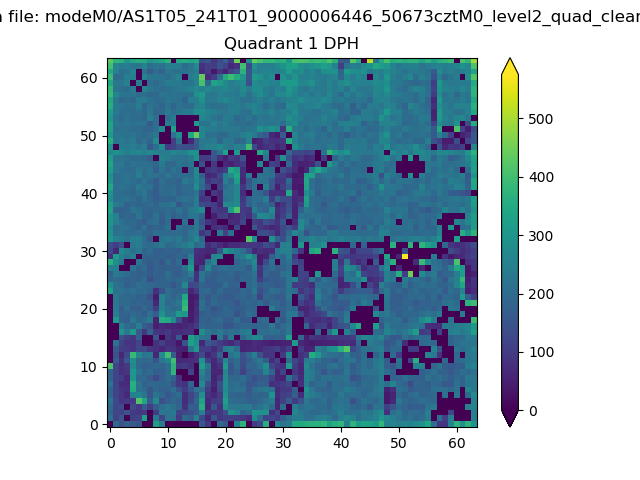 |
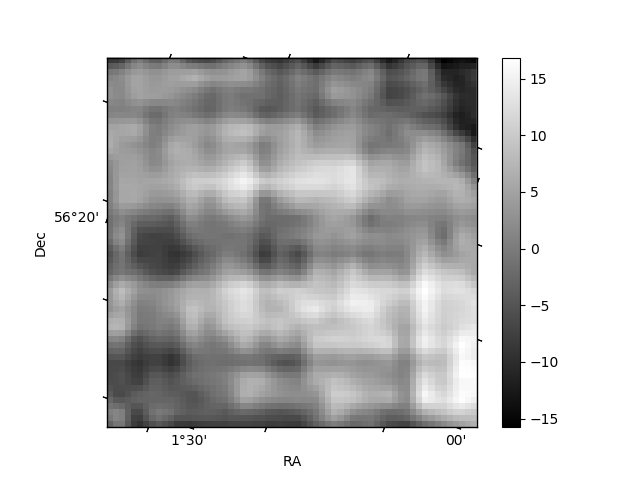
Quadrant B |
|---|---|---|---|
| Quadrant D | 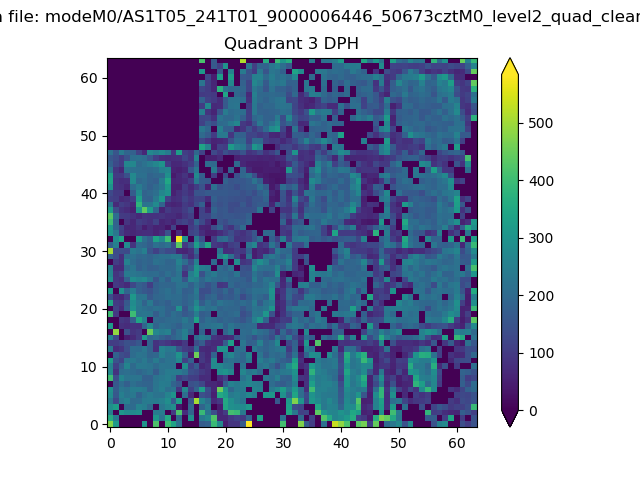 |
 |
Quadrant C |
| Plot type | Count rate plots | Images |
|---|---|---|
| Comparison with Poisson distribution Blue bars denote a histogram of data divided into 1 sec bins. Red curve is a Poisson curve with rate = median count rate of data. |
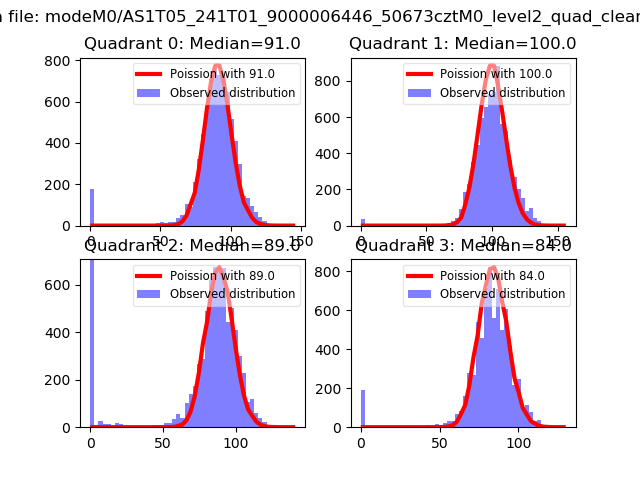 |
 |
| Quadrant-wise count rates Data is divided into 100 sec bins |
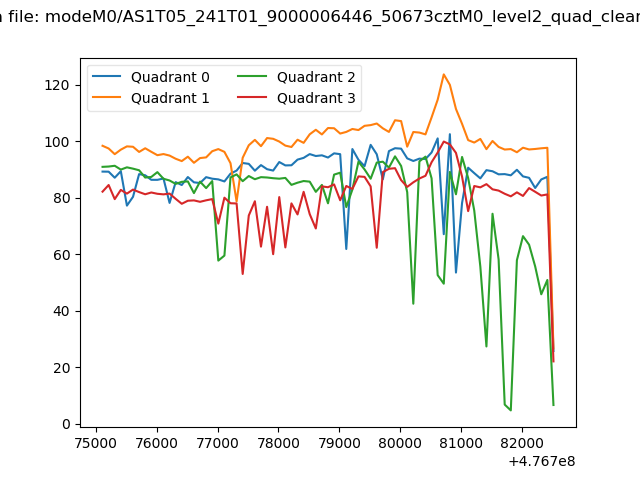 |
|
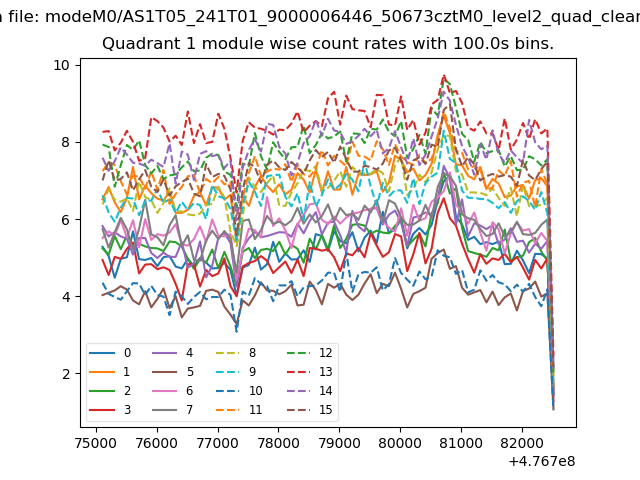
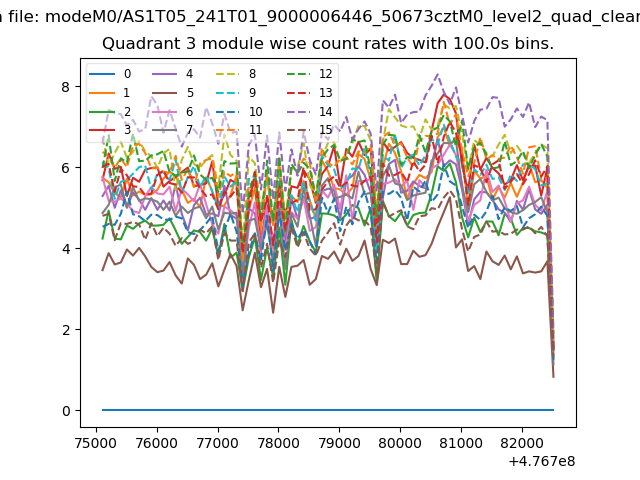
| Module-wise count rates for Quadrant A Data is divided into 100 sec bins |
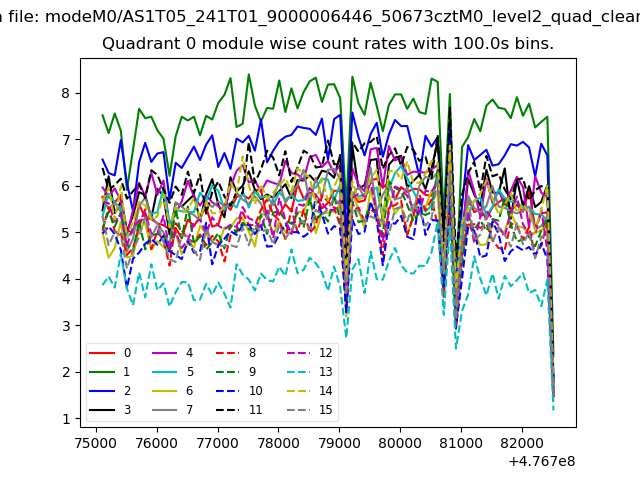 |
 |
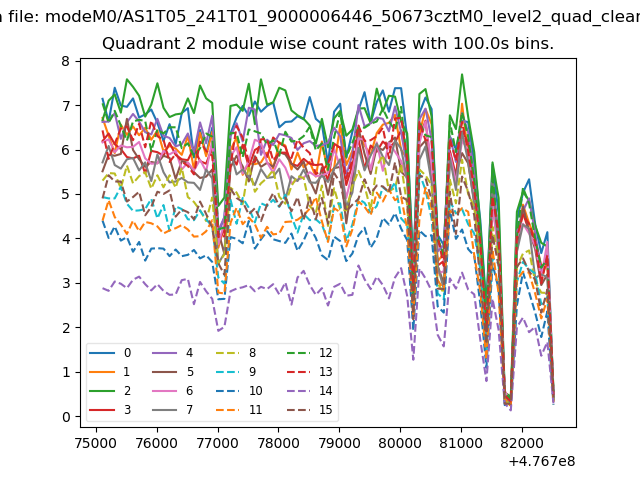
| Module-wise count rates for Quadrant B Data is divided into 100 sec bins |
 |
 |
| Module-wise count rates for Quadrant C Data is divided into 100 sec bins |
 |
 |
| Module-wise count rates for Quadrant D Data is divided into 100 sec bins |
 |
 |
| Parameter | Plot |
|---|---|
| CZT HV Monitor | 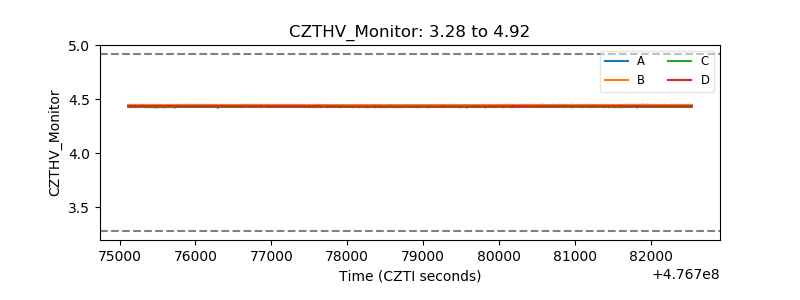 |
| D_VDD | 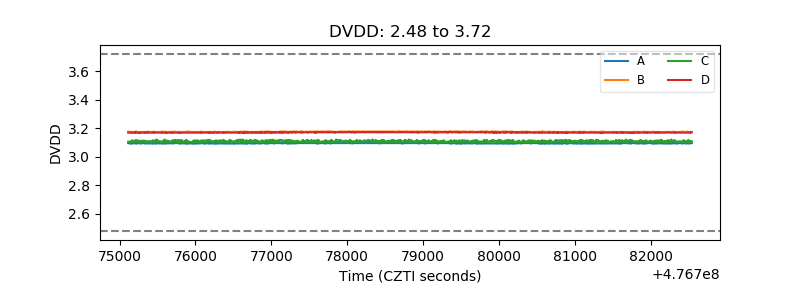 |
| Temperature 1 | 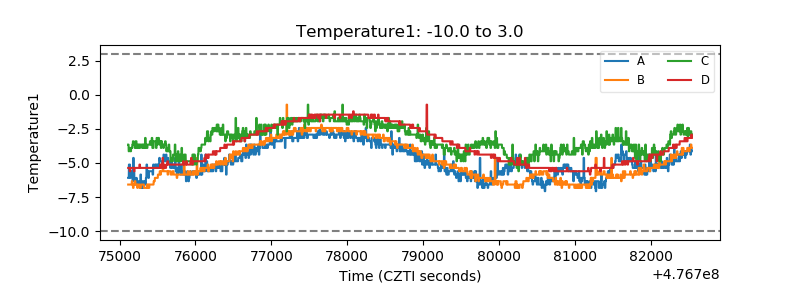 |
| Veto HV Monitor | 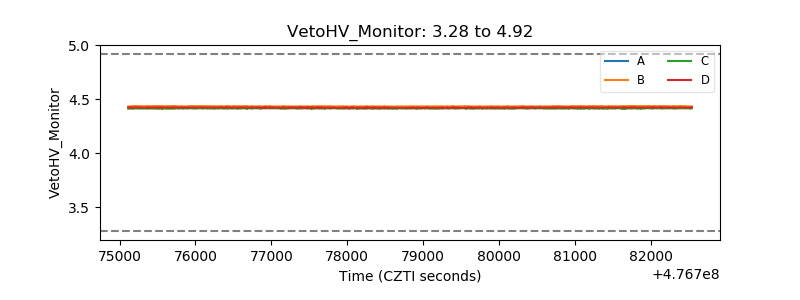 |
| Veto LLD | 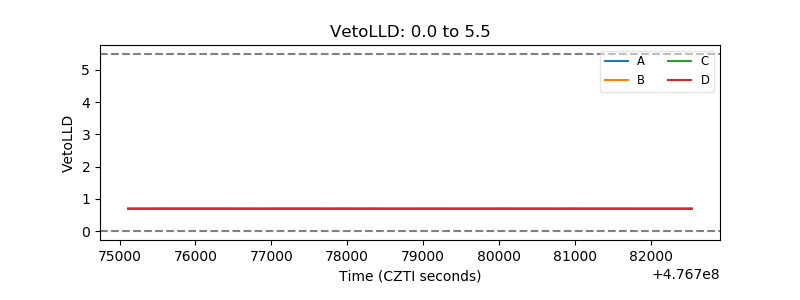 |
| Alpha Counter | 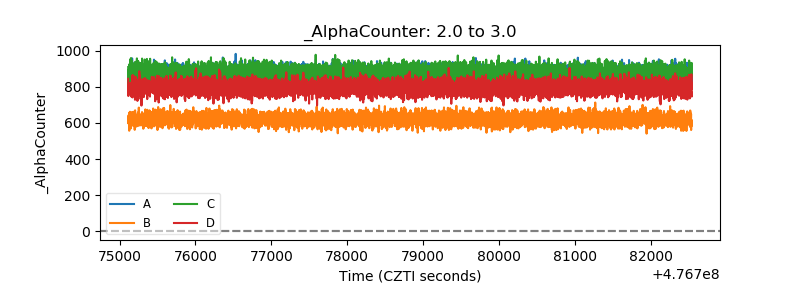 |
| _CPM_Rate | 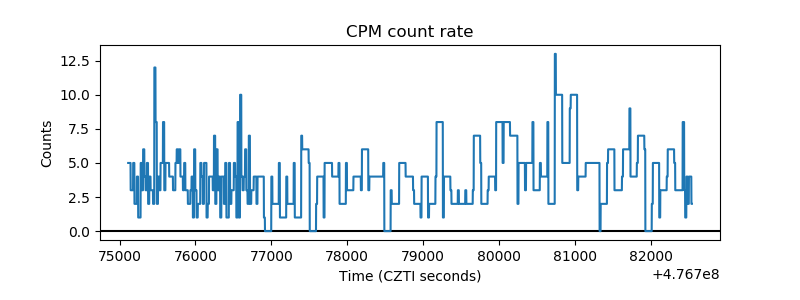 |
| CZT Counter | 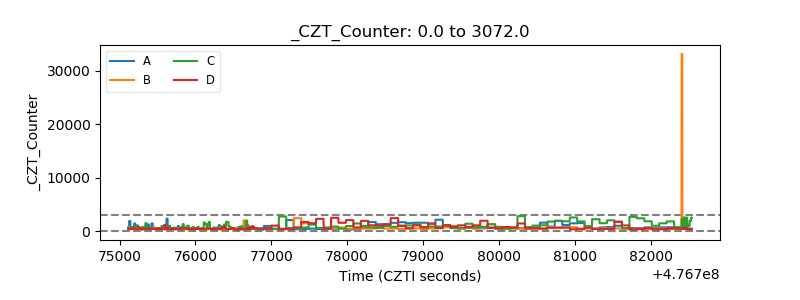 |
| +2.5 Volts monitor | 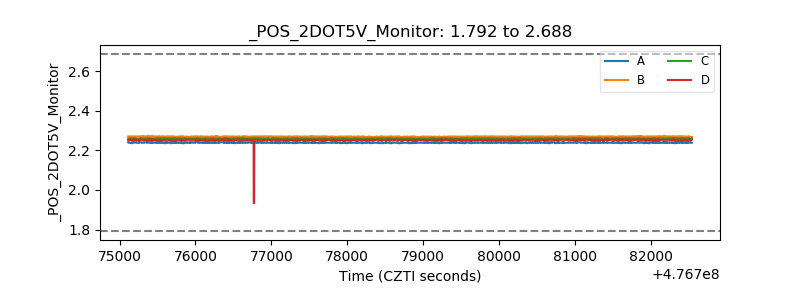 |
| +5 Volts monitor | 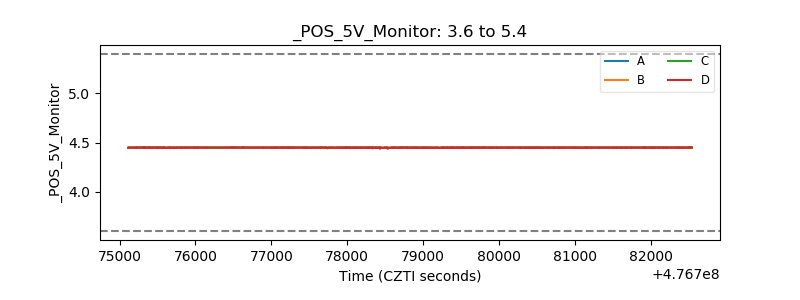 |
| _ROLL_ROT | 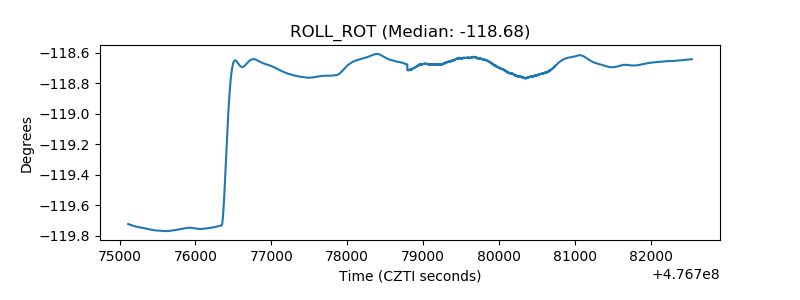 |
| _Roll_DEC | 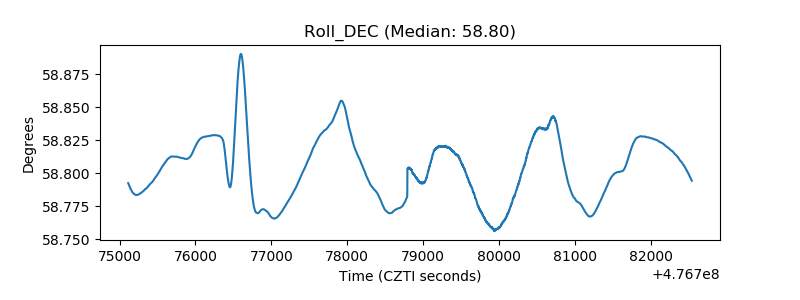 |
| _Roll_RA | 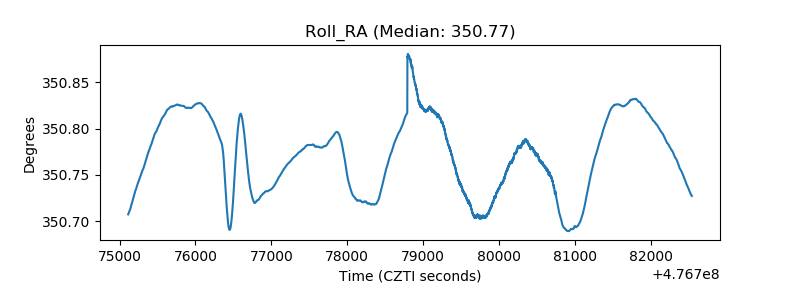 |
| Veto Counter | 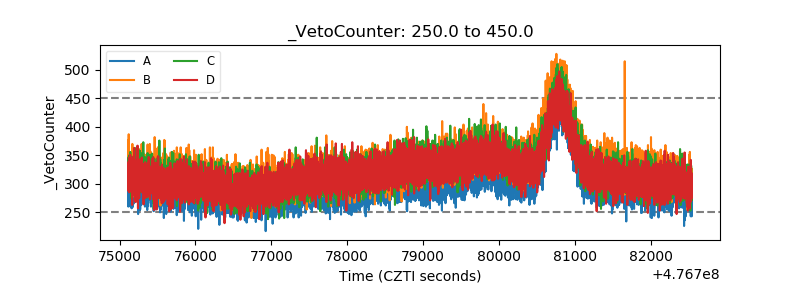 |