| Param | Original file | Final file |
|---|---|---|
| Filename | modeM0/AS1T05_241T01_9000006446_50677cztM0_level2.fits | modeM0/AS1T05_241T01_9000006446_50677cztM0_level2_quad_clean.evt |
| Size (bytes) | 496,987,200 | 93,490,560 |
| Size | 474.0 MB | 89.2 MB |
| Events in quadrant A | 3,779,538 | 614,227 |
| Events in quadrant B | 4,247,848 | 665,498 |
| Events in quadrant C | 5,702,317 | 539,829 |
| Events in quadrant D | 4,152,067 | 549,130 |
| Mode M9 | |||
|---|---|---|---|
| Quadrant | BADHDUFLAG | Total packets | Discarded packets |
| A | 0 | 9 | 0 |
| B | 0 | 9 | 0 |
| C | 0 | 9 | 0 |
| D | 0 | 9 | 0 |
| Mode M0 | |||
|---|---|---|---|
| Quadrant | BADHDUFLAG | Total packets | Discarded packets |
| A | 0 | 15492 | 1 |
| B | 0 | 17275 | 2 |
| C | 0 | 21501 | 1 |
| D | 0 | 16906 | 1 |
| Mode SS | |||
|---|---|---|---|
| Quadrant | BADHDUFLAG | Total packets | Discarded packets |
| A | 0 | 132 | 0 |
| B | 0 | 132 | 0 |
| C | 0 | 132 | 0 |
| D | 0 | 134 | 0 |
| Quadrant | Total seconds | Saturated seconds | Saturation percentage |
|---|---|---|---|
| A | 6631 | 158 | 2.382748% |
| B | 6630 | 203 | 3.061840% |
| C | 6630 | 806 | 12.156863% |
| D | 6630 | 257 | 3.876320% |
Noise dominated data is calculated using 1-second bins in cleaned event files. If a bin has >2000 counts, and if more than 50% of those come from <1% of pixels, then it is considered to be noise-dominated and hence unusable.
| Quadrant | # 1 sec bins | Bins with >0 counts | Bins with >2000 counts | High rate bins dominated by noise | Noise dominated (total time) | Noise dominated (detector-on time) | Marked lightcurve |
|---|---|---|---|---|---|---|---|
| A | 7446 | 6631 | 99 | 99 | 1.33% | 1.49% | 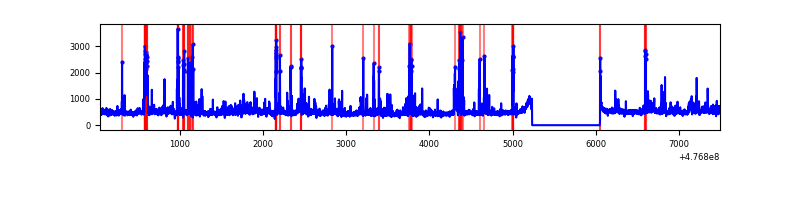 |
| B | 7445 | 6630 | 112 | 112 | 1.50% | 1.69% | 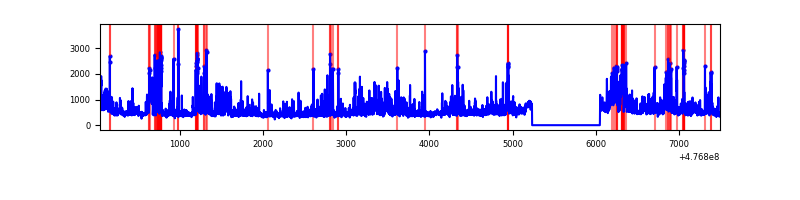 |
| C | 7445 | 6630 | 705 | 705 | 9.47% | 10.63% | 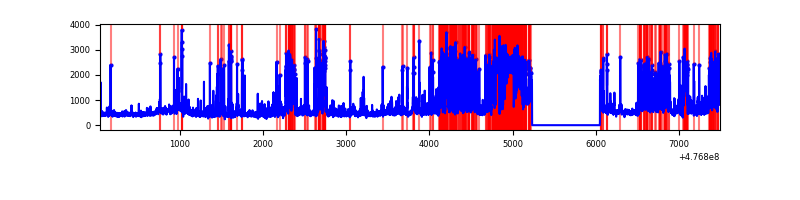 |
| D | 7445 | 6630 | 211 | 211 | 2.83% | 3.18% | 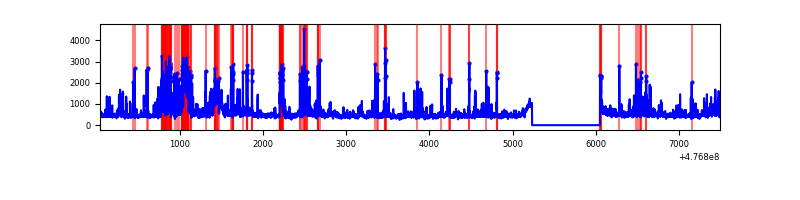 |
Top three noisy pixels from each quadrant. If the there are fewer than three noisy pixels in the level2.evt file, extra rows are filled as -1
| Pixel properties | Quadrant properties | ||||||
|---|---|---|---|---|---|---|---|
| Quadrant | DetID | PixID | Counts | Sigma | Mean | Median | Sigma |
| A | 9 | 191 | 176847 | 1022.33 | 699 | 681 | 172.3 |
| A | 4 | 3 | 154582 | 893.12 | 699 | 681 | 172.3 |
| A | 8 | 38 | 104359 | 601.67 | 699 | 681 | 172.3 |
| B | 0 | 229 | 829767 | 5629.9 | 692 | 666 | 147.3 |
| B | 8 | 128 | 135084 | 912.75 | 692 | 666 | 147.3 |
| B | 10 | 60 | 70681 | 475.43 | 692 | 666 | 147.3 |
| C | 1 | 44 | 1571029 | 8765.28 | 648 | 643 | 179.2 |
| C | 15 | 174 | 386851 | 2155.66 | 648 | 643 | 179.2 |
| C | 13 | 113 | 209812 | 1167.5 | 648 | 643 | 179.2 |
| D | 2 | 249 | 520966 | 2784.32 | 676 | 653 | 186.9 |
| D | 8 | 246 | 245300 | 1309.16 | 676 | 653 | 186.9 |
| D | 15 | 185 | 111260 | 591.88 | 676 | 653 | 186.9 |
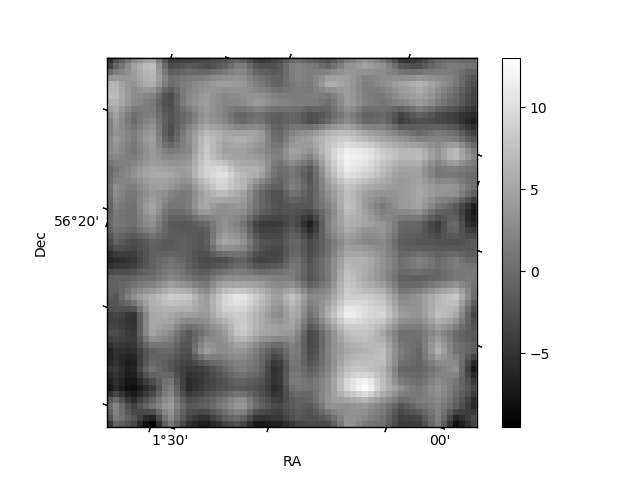
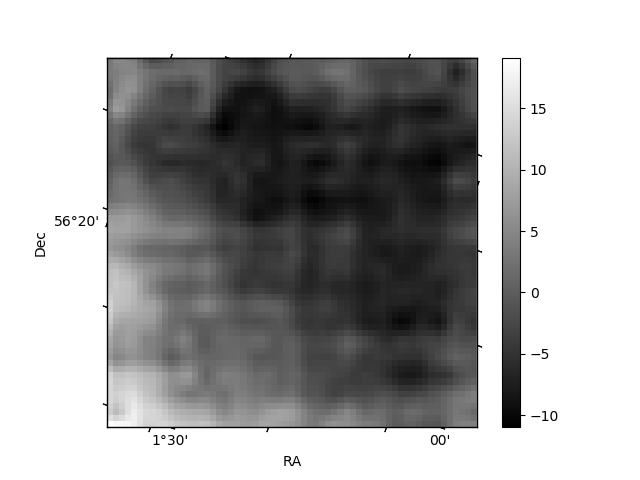
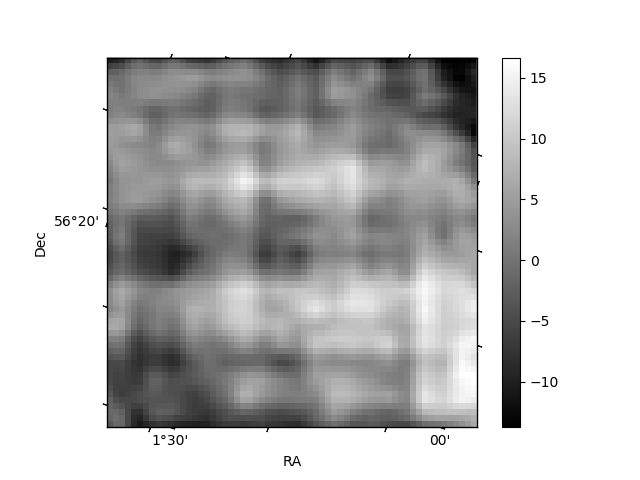
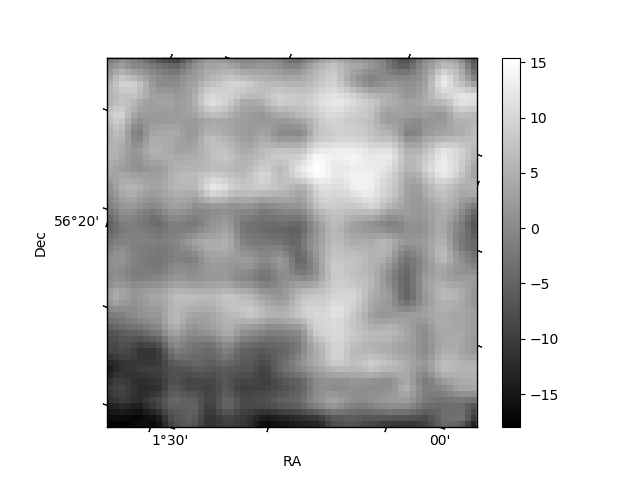
Histogram calculated using DETX and DETY for each event in the final _common_clean file
| Quadrant A | 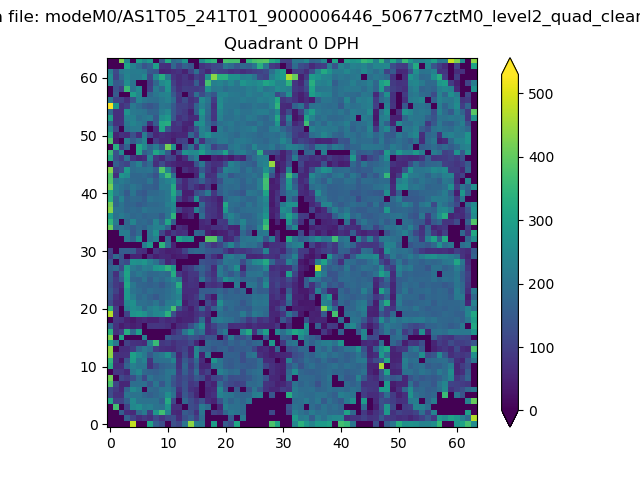 |
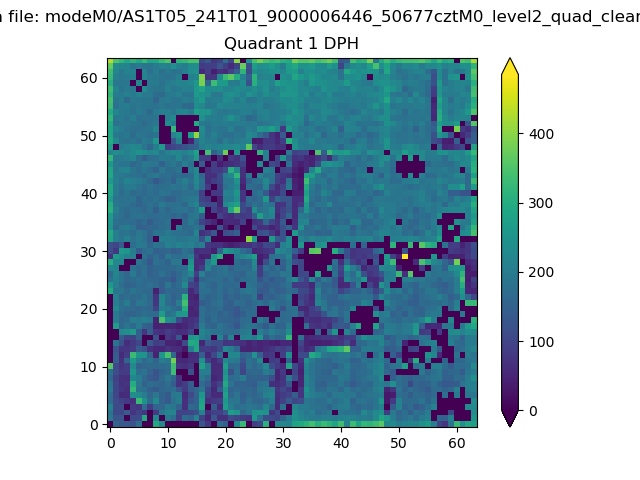 |
Quadrant B |
|---|---|---|---|
| Quadrant D | 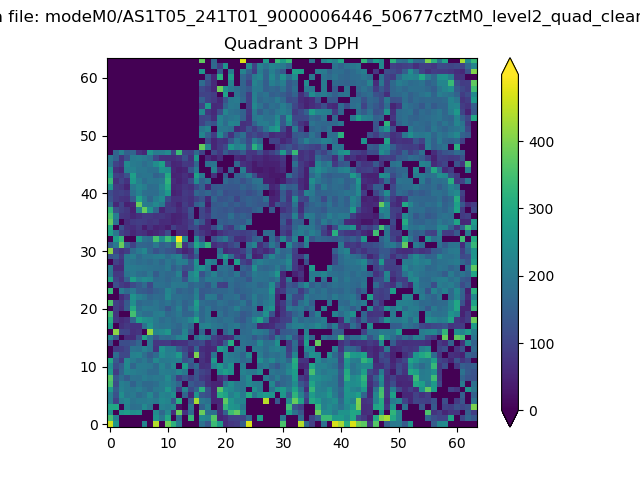 |
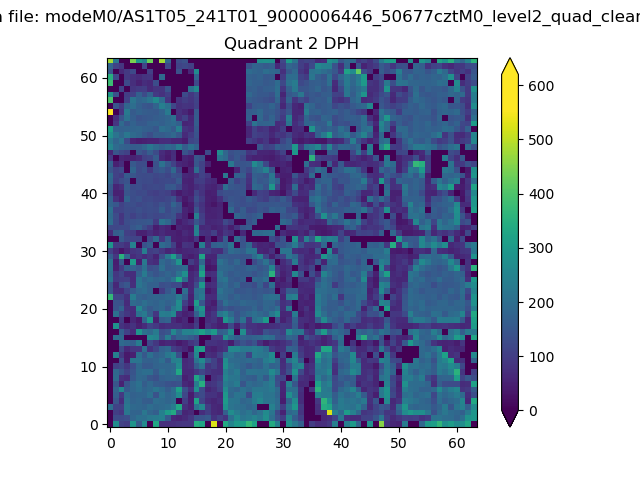 |
Quadrant C |
| Plot type | Count rate plots | Images |
|---|---|---|
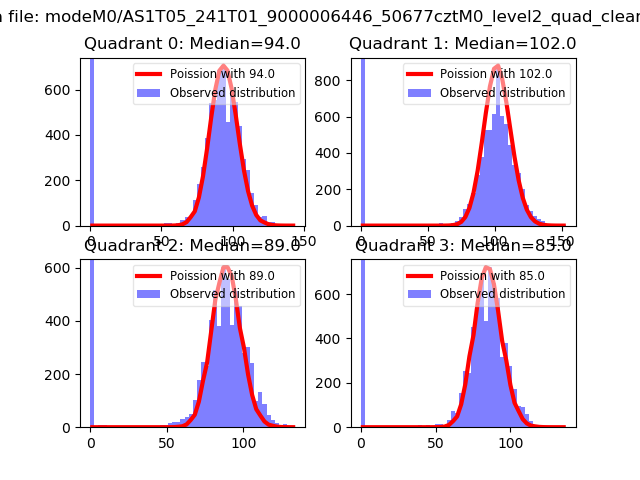
| Comparison with Poisson distribution Blue bars denote a histogram of data divided into 1 sec bins. Red curve is a Poisson curve with rate = median count rate of data. |
 |
 |
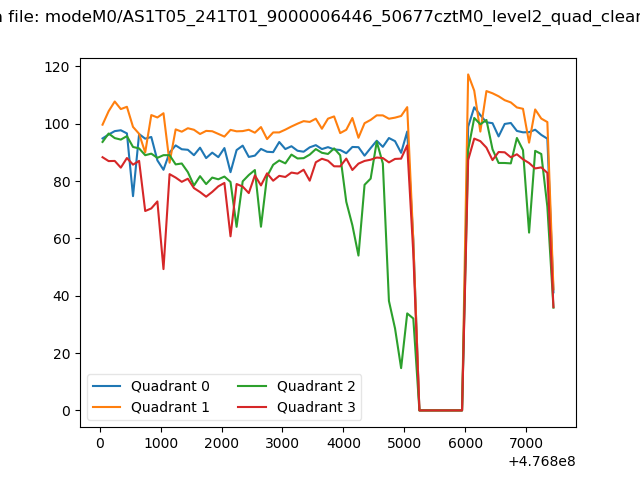
| Quadrant-wise count rates Data is divided into 100 sec bins |
 |
|
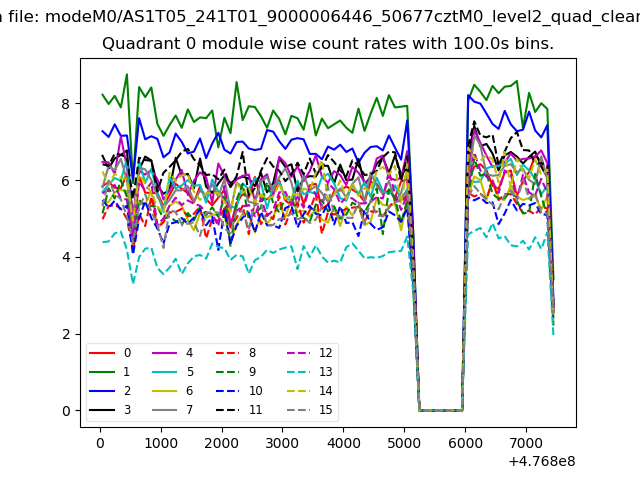
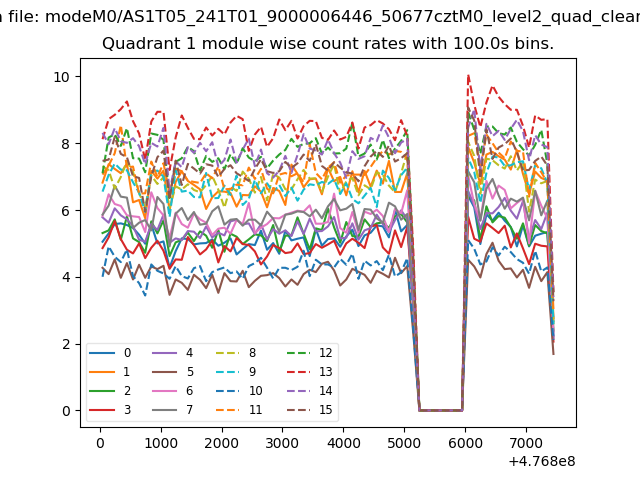
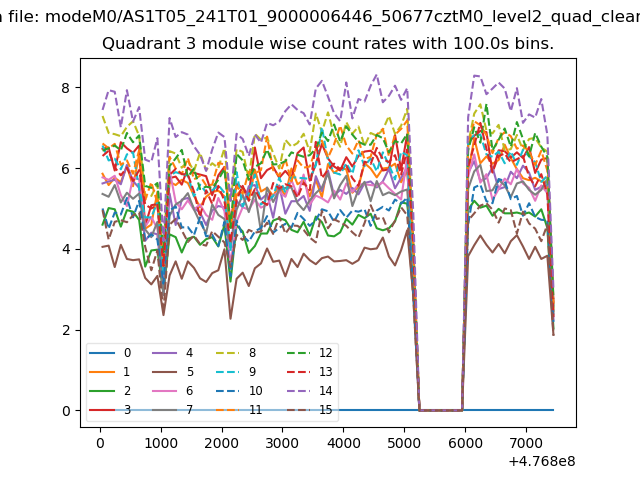
| Module-wise count rates for Quadrant A Data is divided into 100 sec bins |
 |
 |
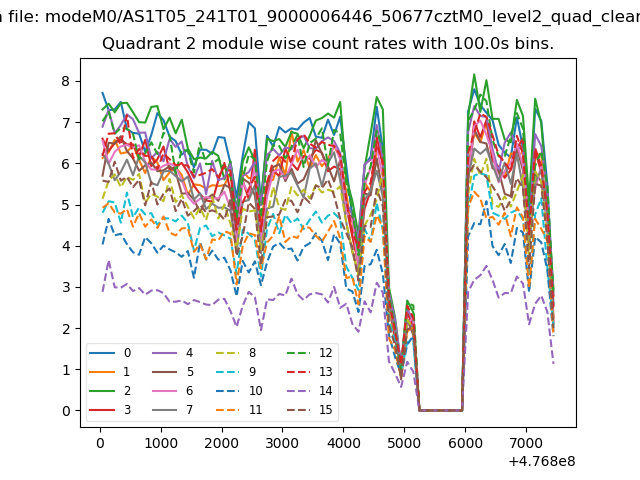
| Module-wise count rates for Quadrant B Data is divided into 100 sec bins |
 |
 |
| Module-wise count rates for Quadrant C Data is divided into 100 sec bins |
 |
 |
| Module-wise count rates for Quadrant D Data is divided into 100 sec bins |
 |
 |
| Parameter | Plot |
|---|---|
| CZT HV Monitor | 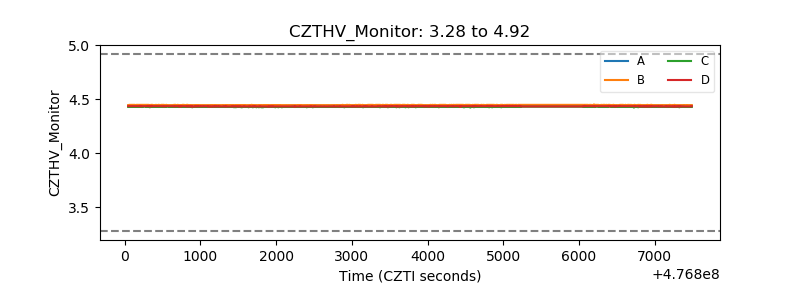 |
| D_VDD | 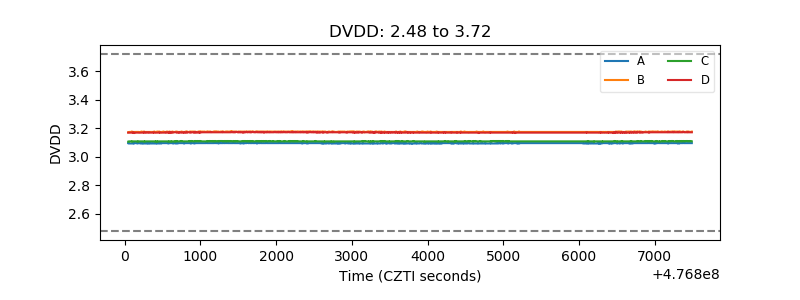 |
| Temperature 1 | 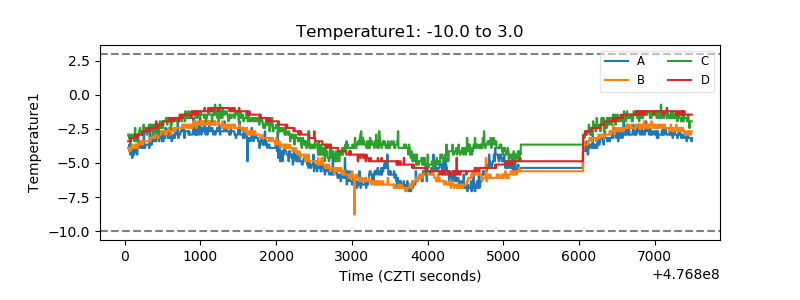 |
| Veto HV Monitor | 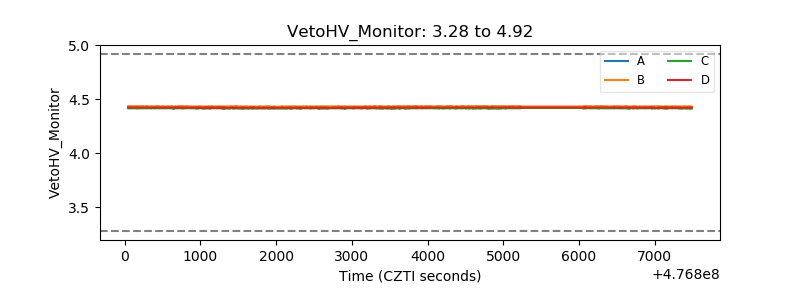 |
| Veto LLD | 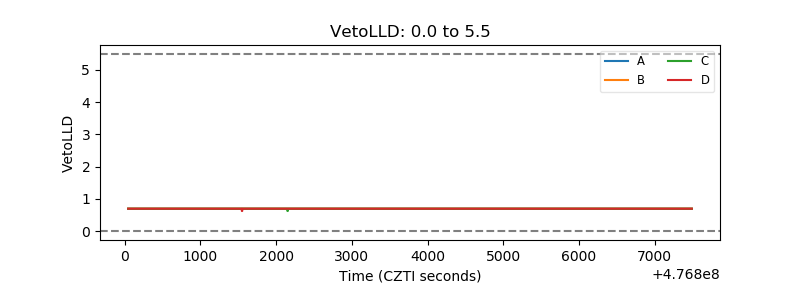 |
| Alpha Counter | 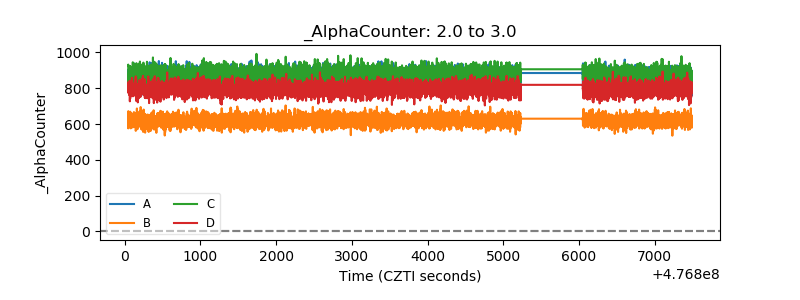 |
| _CPM_Rate | 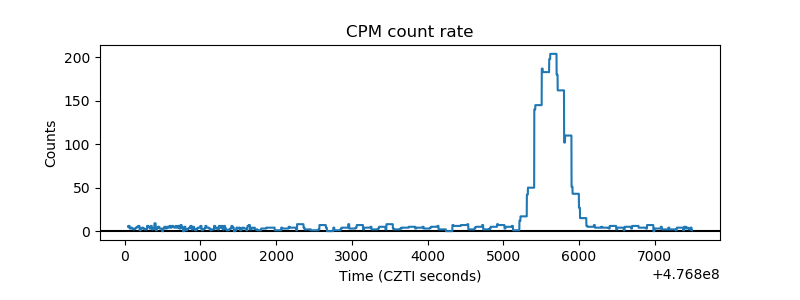 |
| CZT Counter | 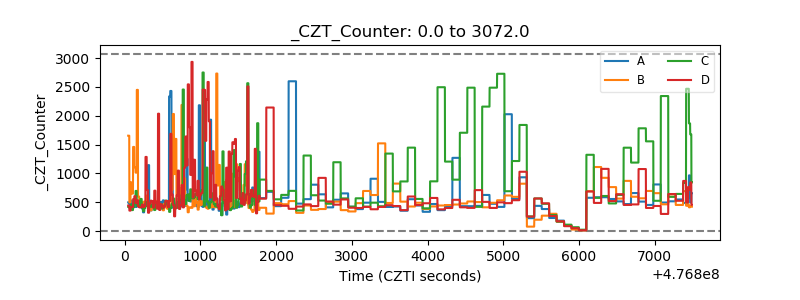 |
| +2.5 Volts monitor |  |
| +5 Volts monitor | 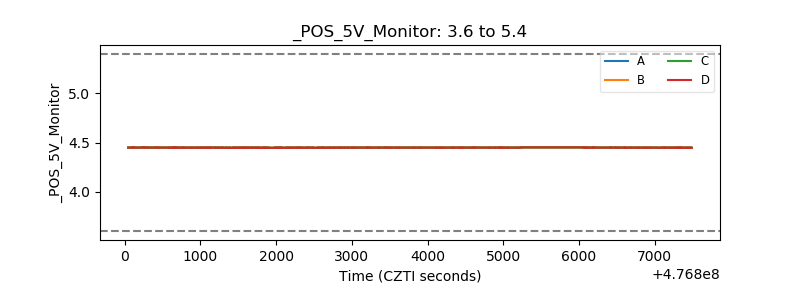 |
| _ROLL_ROT | 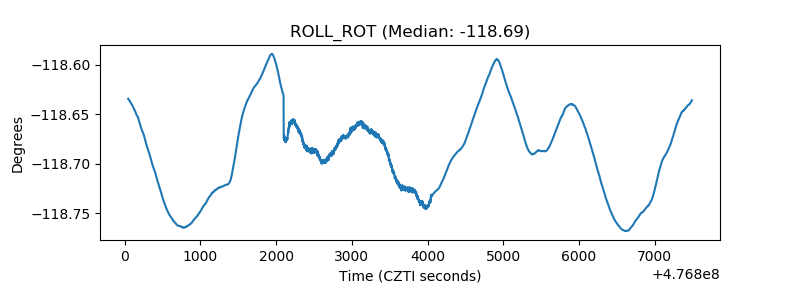 |
| _Roll_DEC | 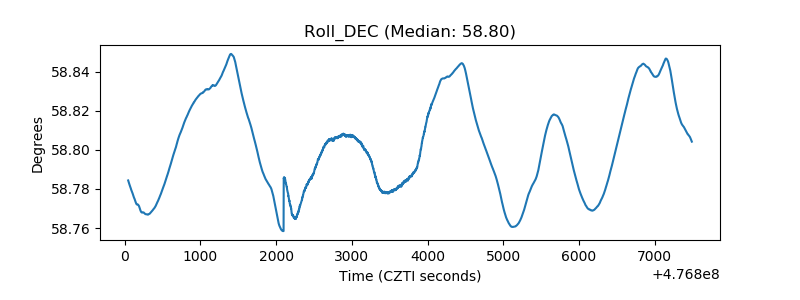 |
| _Roll_RA | 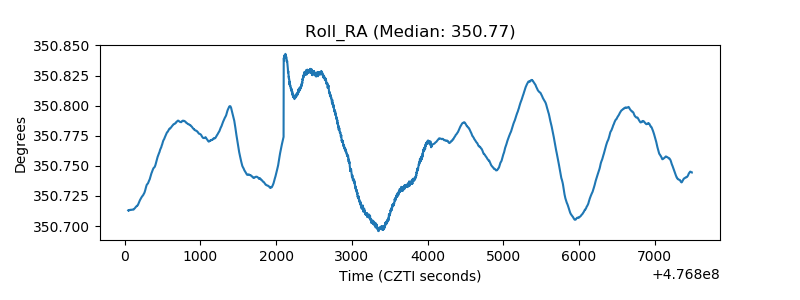 |
| Veto Counter | 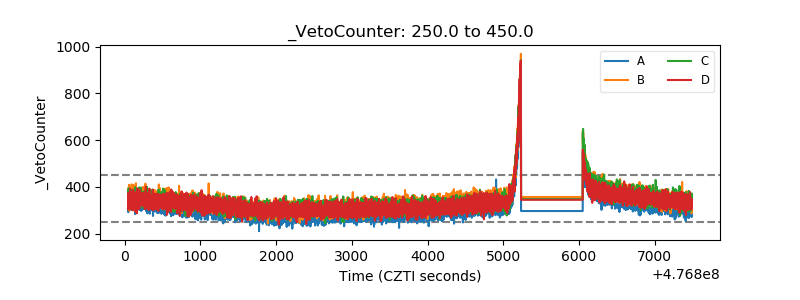 |