| Param | Original file | Final file |
|---|---|---|
| Filename | modeM0/AS1T05_241T01_9000006446_50679cztM0_level2.fits | modeM0/AS1T05_241T01_9000006446_50679cztM0_level2_quad_clean.evt |
| Size (bytes) | 550,448,640 | 99,276,480 |
| Size | 524.9 MB | 94.7 MB |
| Events in quadrant A | 4,054,250 | 652,488 |
| Events in quadrant B | 4,275,744 | 710,377 |
| Events in quadrant C | 7,148,944 | 573,814 |
| Events in quadrant D | 4,357,911 | 584,997 |
| Mode M9 | |||
|---|---|---|---|
| Quadrant | BADHDUFLAG | Total packets | Discarded packets |
| A | 0 | 9 | 0 |
| B | 0 | 10 | 0 |
| C | 0 | 10 | 0 |
| D | 0 | 10 | 0 |
| Mode M0 | |||
|---|---|---|---|
| Quadrant | BADHDUFLAG | Total packets | Discarded packets |
| A | 0 | 16512 | 2 |
| B | 0 | 17560 | 2 |
| C | 0 | 26023 | 4 |
| D | 0 | 17842 | 2 |
| Mode SS | |||
|---|---|---|---|
| Quadrant | BADHDUFLAG | Total packets | Discarded packets |
| A | 0 | 142 | 0 |
| B | 0 | 142 | 0 |
| C | 0 | 142 | 0 |
| D | 0 | 142 | 0 |
| Quadrant | Total seconds | Saturated seconds | Saturation percentage |
|---|---|---|---|
| A | 6948 | 152 | 2.187680% |
| B | 6948 | 199 | 2.864134% |
| C | 6947 | 923 | 13.286311% |
| D | 6947 | 235 | 3.382755% |
Noise dominated data is calculated using 1-second bins in cleaned event files. If a bin has >2000 counts, and if more than 50% of those come from <1% of pixels, then it is considered to be noise-dominated and hence unusable.
| Quadrant | # 1 sec bins | Bins with >0 counts | Bins with >2000 counts | High rate bins dominated by noise | Noise dominated (total time) | Noise dominated (detector-on time) | Marked lightcurve |
|---|---|---|---|---|---|---|---|
| A | 7918 | 6948 | 92 | 92 | 1.16% | 1.32% | 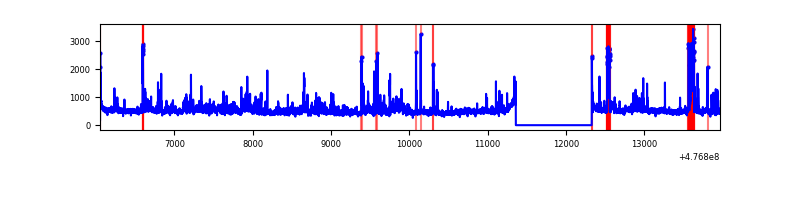 |
| B | 7918 | 6948 | 111 | 111 | 1.40% | 1.60% | 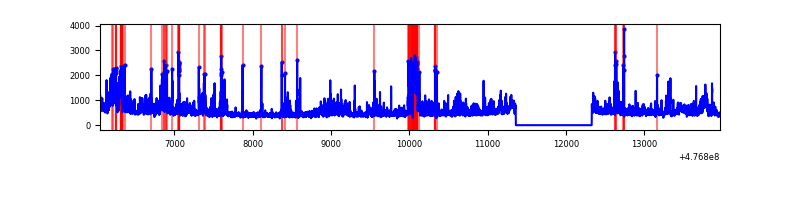 |
| C | 7917 | 6947 | 829 | 829 | 10.47% | 11.93% | 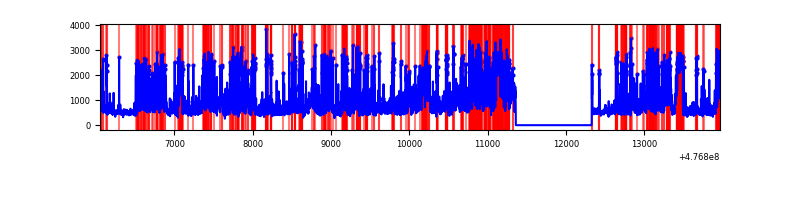 |
| D | 7917 | 6947 | 202 | 202 | 2.55% | 2.91% | 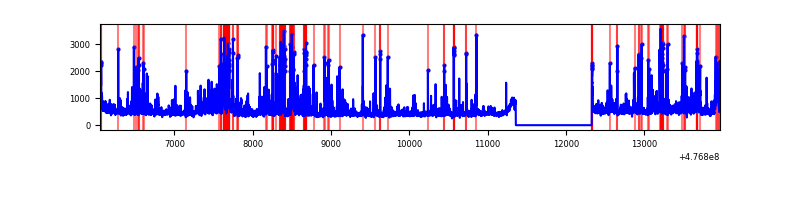 |
Top three noisy pixels from each quadrant. If the there are fewer than three noisy pixels in the level2.evt file, extra rows are filled as -1
| Pixel properties | Quadrant properties | ||||||
|---|---|---|---|---|---|---|---|
| Quadrant | DetID | PixID | Counts | Sigma | Mean | Median | Sigma |
| A | 10 | 253 | 368238 | 2028.34 | 736 | 717 | 181.2 |
| A | 4 | 3 | 219316 | 1206.45 | 736 | 717 | 181.2 |
| A | 8 | 38 | 180513 | 992.29 | 736 | 717 | 181.2 |
| B | 0 | 229 | 895378 | 5751.92 | 736 | 710 | 155.5 |
| B | 3 | 249 | 80585 | 513.53 | 736 | 710 | 155.5 |
| B | 10 | 246 | 55199 | 350.32 | 736 | 710 | 155.5 |
| C | 1 | 44 | 1691956 | 8870.43 | 691 | 686 | 190.7 |
| C | 15 | 174 | 565295 | 2961.28 | 691 | 686 | 190.7 |
| C | 12 | 252 | 515804 | 2701.71 | 691 | 686 | 190.7 |
| D | 7 | 96 | 595851 | 2976.26 | 719 | 694 | 200.0 |
| D | 2 | 249 | 219110 | 1092.26 | 719 | 694 | 200.0 |
| D | 1 | 47 | 71594 | 354.56 | 719 | 694 | 200.0 |
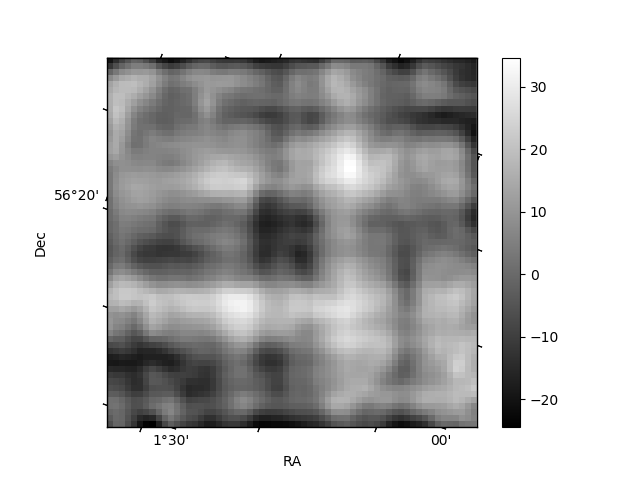
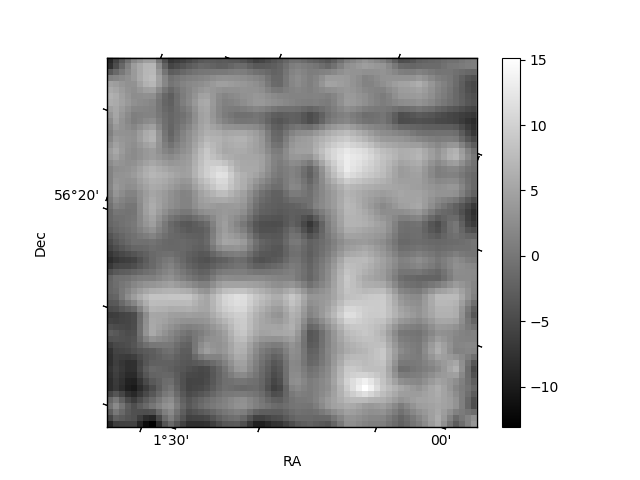
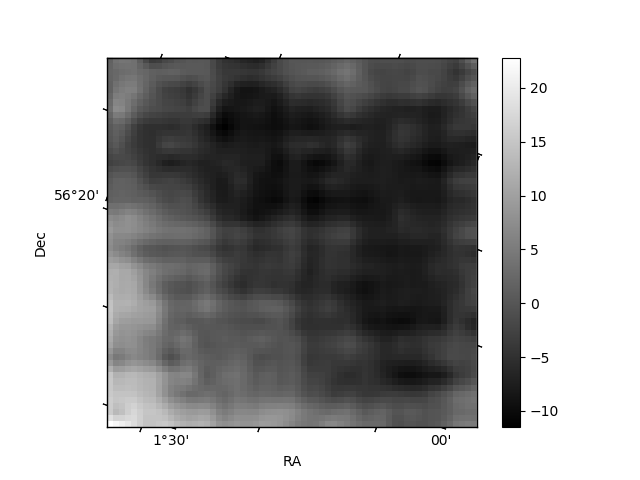
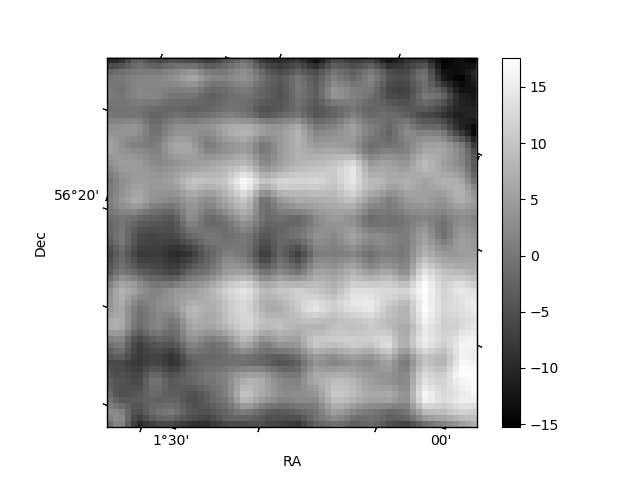
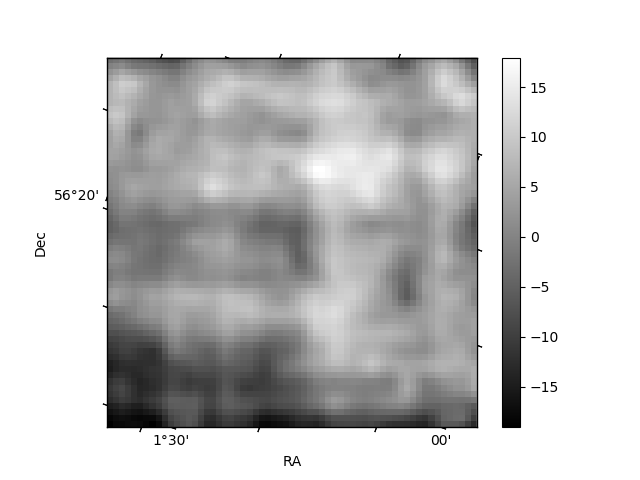
Histogram calculated using DETX and DETY for each event in the final _common_clean file
| Quadrant A | 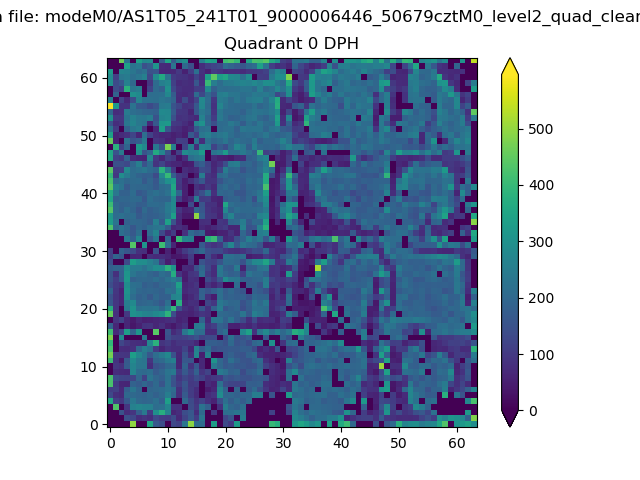 |
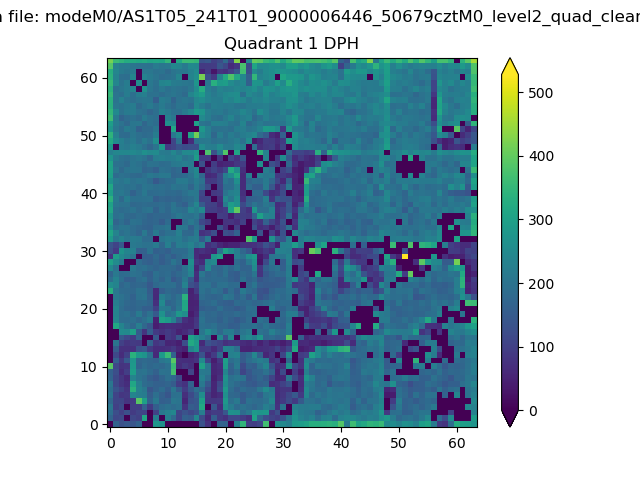 |
Quadrant B |
|---|---|---|---|
| Quadrant D | 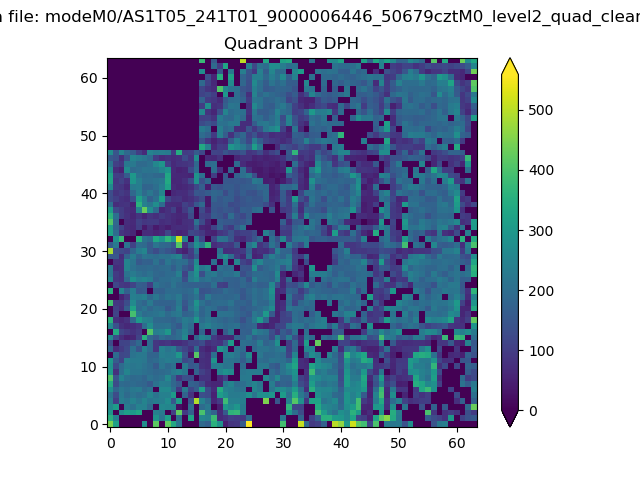 |
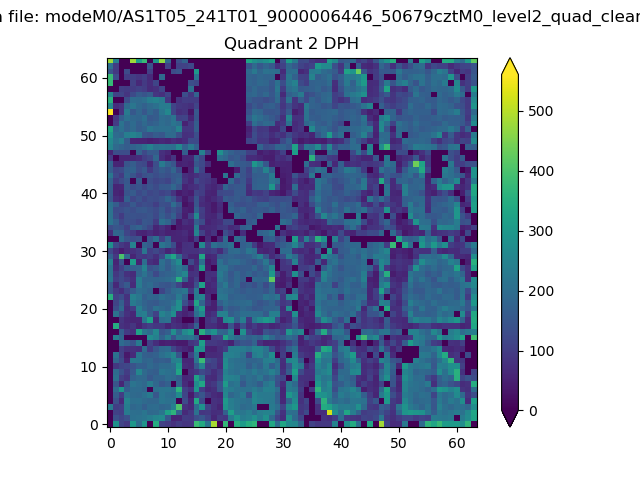 |
Quadrant C |
| Plot type | Count rate plots | Images |
|---|---|---|
| Comparison with Poisson distribution Blue bars denote a histogram of data divided into 1 sec bins. Red curve is a Poisson curve with rate = median count rate of data. |
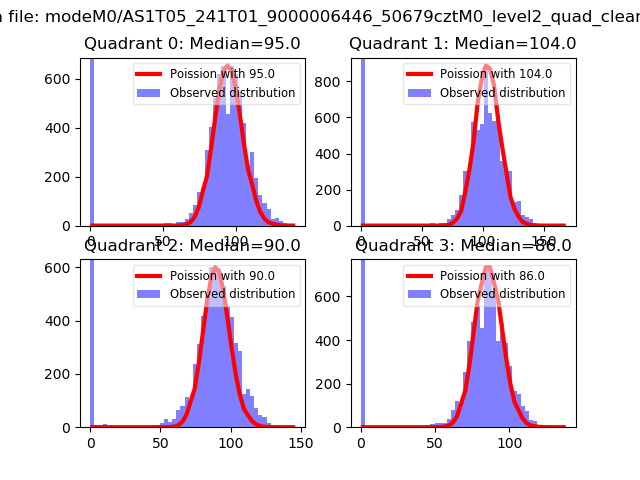 |
 |
| Quadrant-wise count rates Data is divided into 100 sec bins |
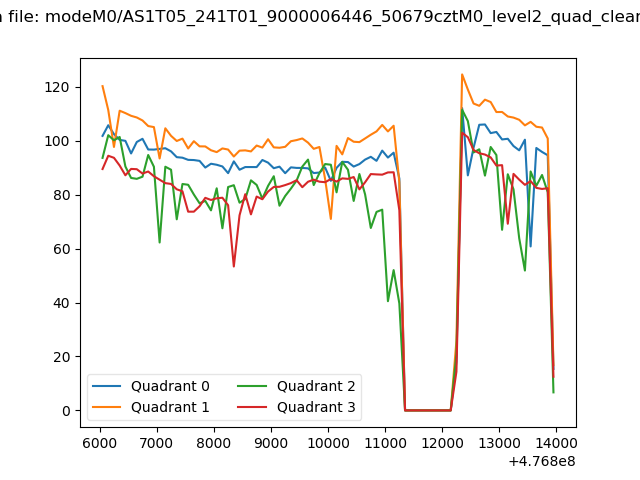 |
|
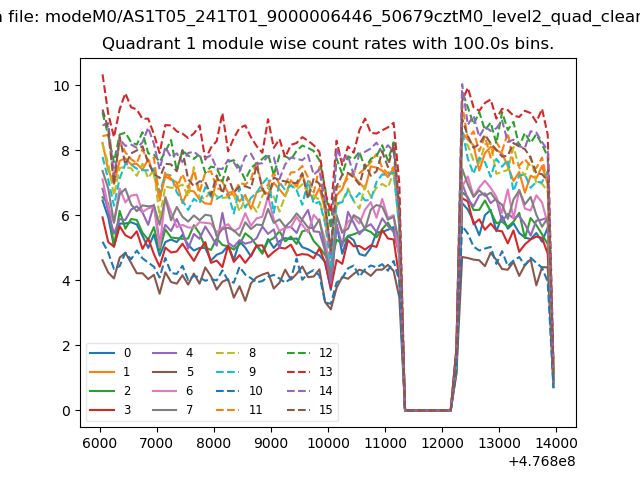
| Module-wise count rates for Quadrant A Data is divided into 100 sec bins |
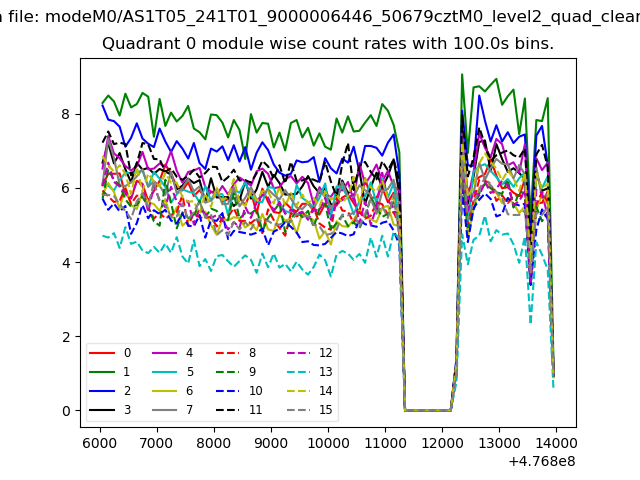 |
 |
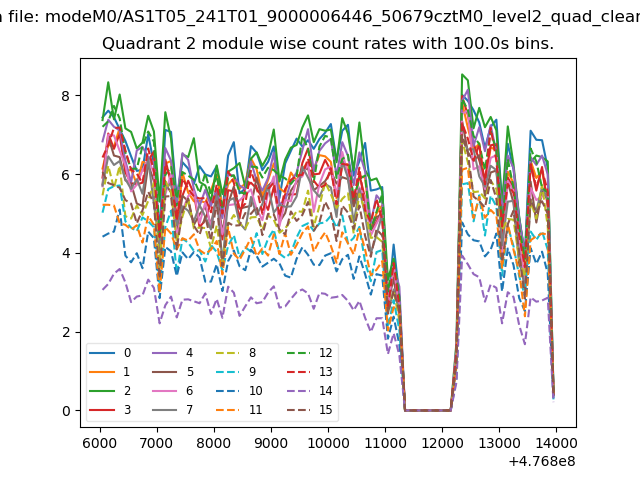
| Module-wise count rates for Quadrant B Data is divided into 100 sec bins |
 |
 |
| Module-wise count rates for Quadrant C Data is divided into 100 sec bins |
 |
 |
| Module-wise count rates for Quadrant D Data is divided into 100 sec bins |
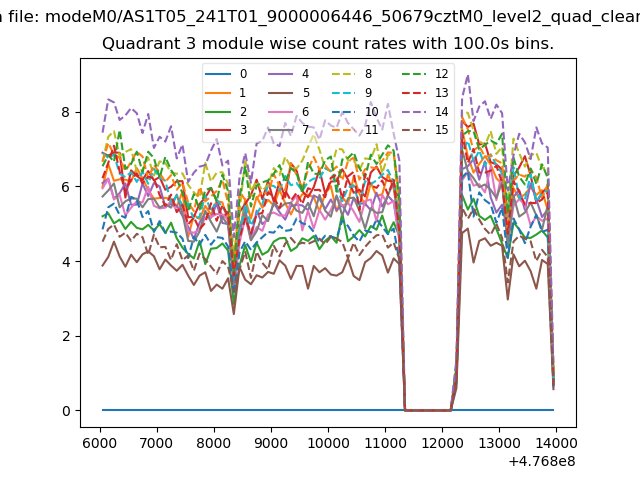 |
 |
| Parameter | Plot |
|---|---|
| CZT HV Monitor | 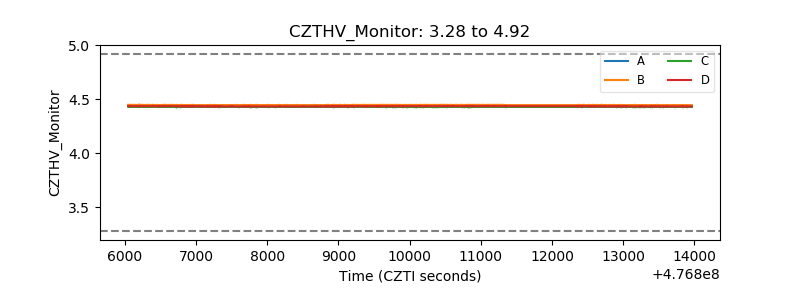 |
| D_VDD | 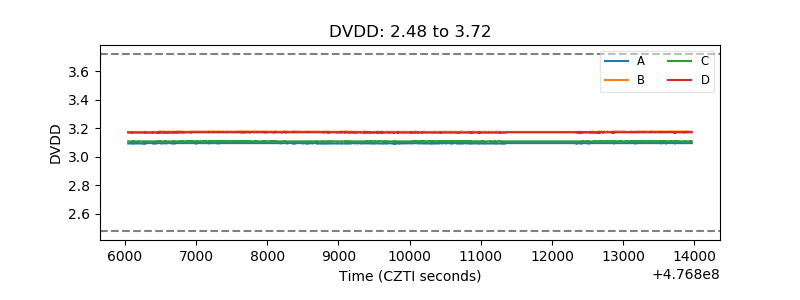 |
| Temperature 1 | 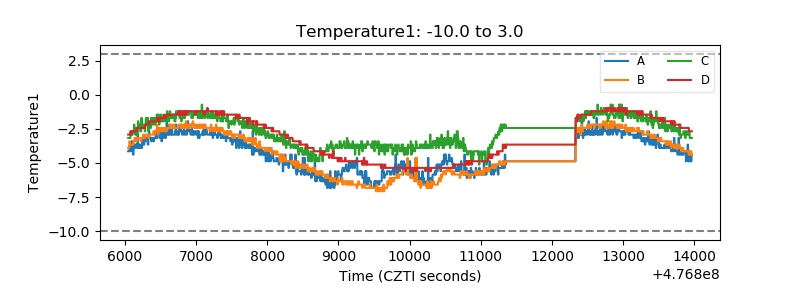 |
| Veto HV Monitor | 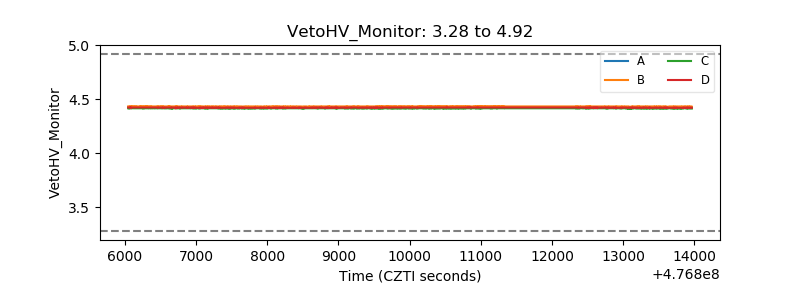 |
| Veto LLD | 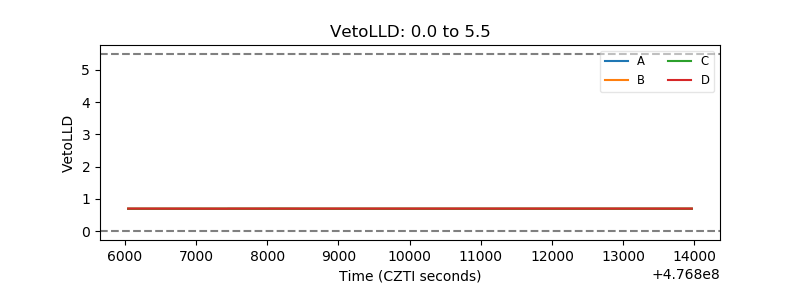 |
| Alpha Counter | 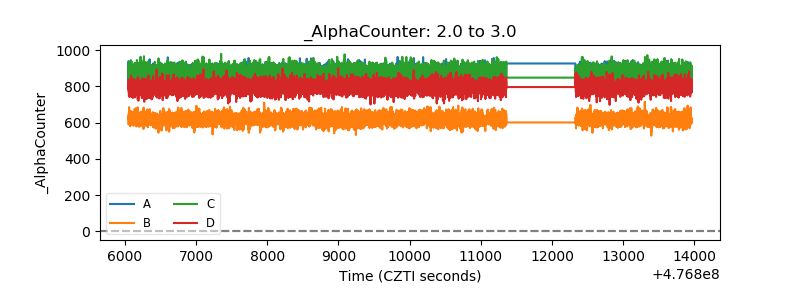 |
| _CPM_Rate | 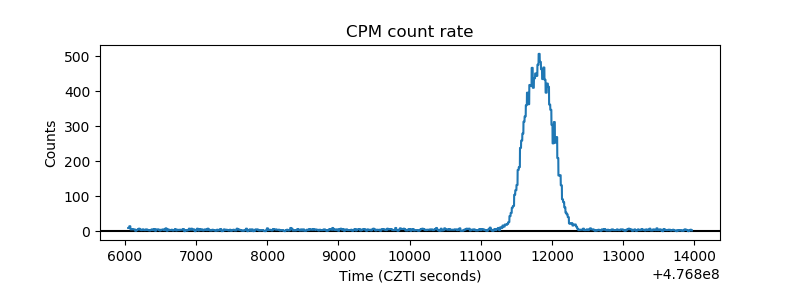 |
| CZT Counter | 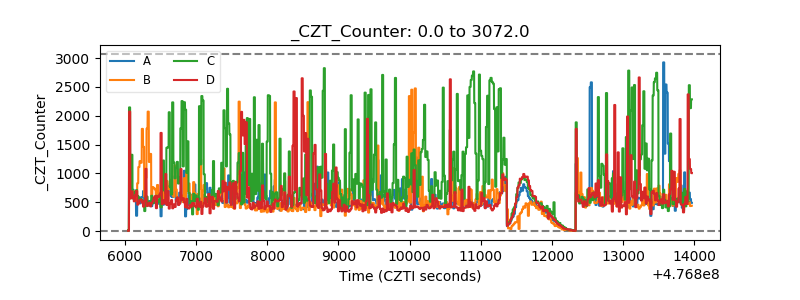 |
| +2.5 Volts monitor | 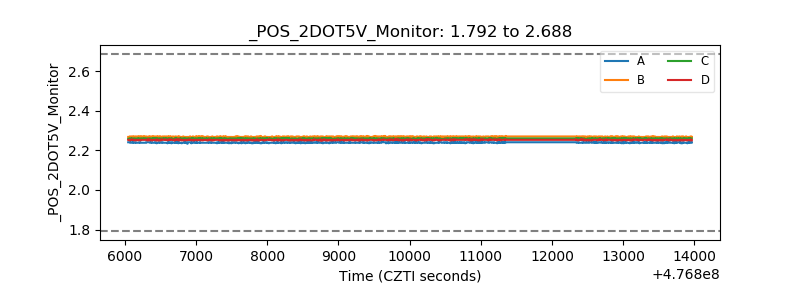 |
| +5 Volts monitor | 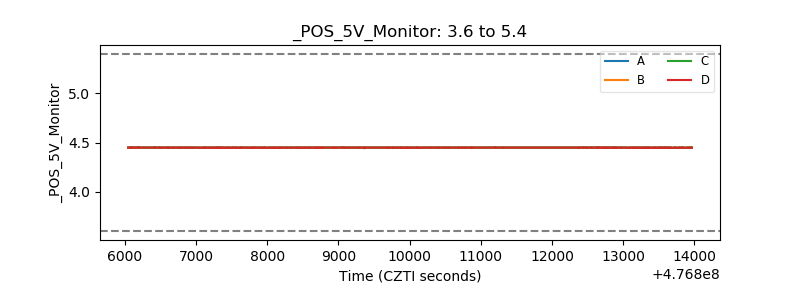 |
| _ROLL_ROT | 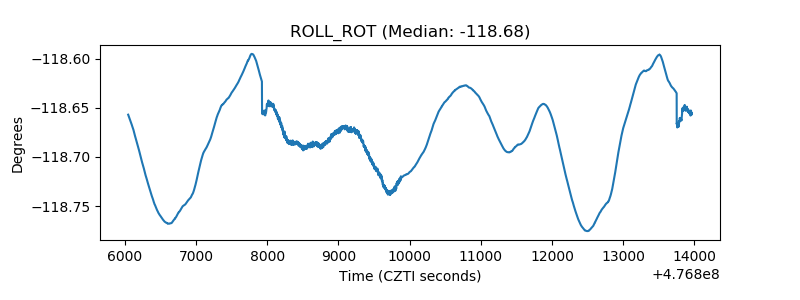 |
| _Roll_DEC | 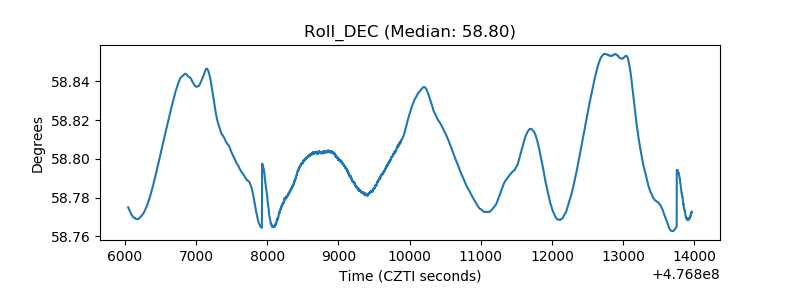 |
| _Roll_RA | 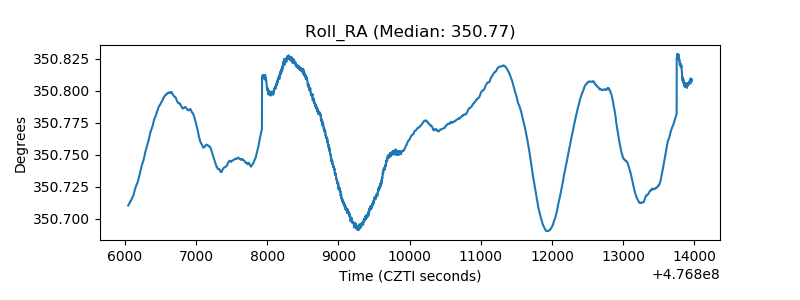 |
| Veto Counter | 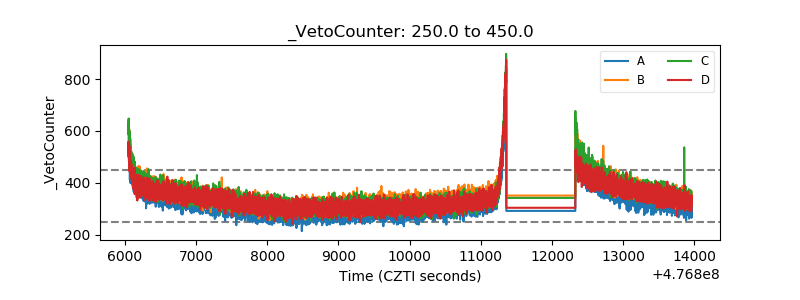 |