| Param | Original file | Final file |
|---|---|---|
| Filename | modeM0/AS1T05_241T01_9000006446_50680cztM0_level2.fits | modeM0/AS1T05_241T01_9000006446_50680cztM0_level2_quad_clean.evt |
| Size (bytes) | 455,636,160 | 91,054,080 |
| Size | 434.5 MB | 86.8 MB |
| Events in quadrant A | 3,798,378 | 581,386 |
| Events in quadrant B | 3,433,802 | 654,556 |
| Events in quadrant C | 5,039,788 | 552,022 |
| Events in quadrant D | 4,111,048 | 535,026 |
| Mode M9 | |||
|---|---|---|---|
| Quadrant | BADHDUFLAG | Total packets | Discarded packets |
| A | 0 | 11 | 0 |
| B | 0 | 11 | 0 |
| C | 0 | 11 | 0 |
| D | 0 | 11 | 0 |
| Mode M0 | |||
|---|---|---|---|
| Quadrant | BADHDUFLAG | Total packets | Discarded packets |
| A | 0 | 15341 | 1 |
| B | 0 | 14524 | 1 |
| C | 0 | 19176 | 1 |
| D | 0 | 16501 | 1 |
| Mode SS | |||
|---|---|---|---|
| Quadrant | BADHDUFLAG | Total packets | Discarded packets |
| A | 0 | 126 | 0 |
| B | 0 | 126 | 0 |
| C | 0 | 126 | 0 |
| D | 0 | 126 | 0 |
| Quadrant | Total seconds | Saturated seconds | Saturation percentage |
|---|---|---|---|
| A | 6221 | 262 | 4.211542% |
| B | 6221 | 70 | 1.125221% |
| C | 6221 | 430 | 6.912072% |
| D | 6222 | 194 | 3.117968% |
Noise dominated data is calculated using 1-second bins in cleaned event files. If a bin has >2000 counts, and if more than 50% of those come from <1% of pixels, then it is considered to be noise-dominated and hence unusable.
| Quadrant | # 1 sec bins | Bins with >0 counts | Bins with >2000 counts | High rate bins dominated by noise | Noise dominated (total time) | Noise dominated (detector-on time) | Marked lightcurve |
|---|---|---|---|---|---|---|---|
| A | 7281 | 6221 | 226 | 226 | 3.10% | 3.63% | 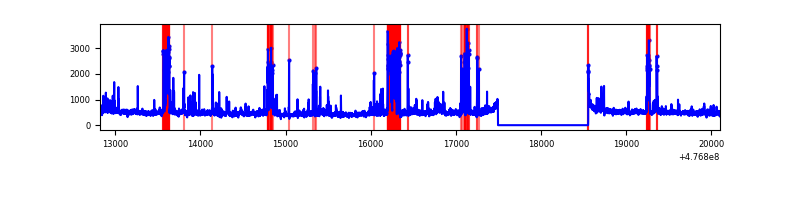 |
| B | 7281 | 6221 | 24 | 24 | 0.33% | 0.39% | 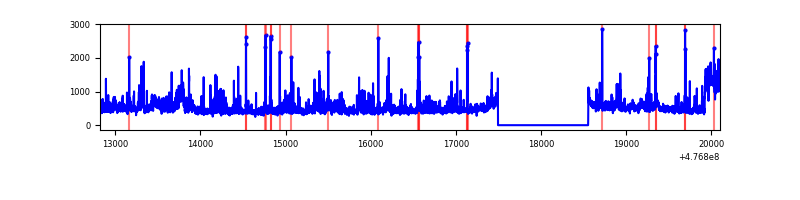 |
| C | 7281 | 6221 | 381 | 381 | 5.23% | 6.12% | 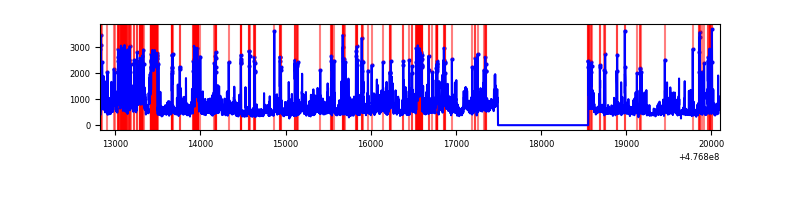 |
| D | 7282 | 6222 | 148 | 148 | 2.03% | 2.38% | 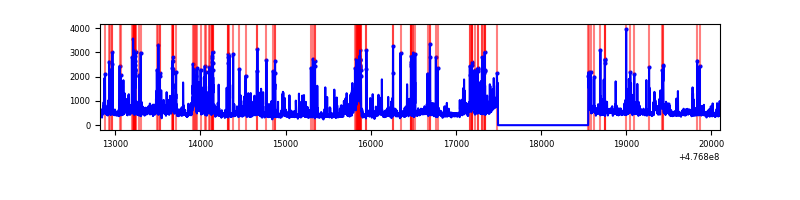 |
Top three noisy pixels from each quadrant. If the there are fewer than three noisy pixels in the level2.evt file, extra rows are filled as -1
| Pixel properties | Quadrant properties | ||||||
|---|---|---|---|---|---|---|---|
| Quadrant | DetID | PixID | Counts | Sigma | Mean | Median | Sigma |
| A | 3 | 46 | 245165 | 1525.02 | 651 | 635 | 160.3 |
| A | 8 | 38 | 229042 | 1424.47 | 651 | 635 | 160.3 |
| A | 4 | 3 | 195534 | 1215.49 | 651 | 635 | 160.3 |
| B | 0 | 229 | 290755 | 2068.27 | 660 | 637 | 140.3 |
| B | 4 | 170 | 156959 | 1114.43 | 660 | 637 | 140.3 |
| B | 3 | 249 | 96371 | 682.49 | 660 | 637 | 140.3 |
| C | 13 | 113 | 535296 | 3083.81 | 637 | 633 | 173.4 |
| C | 12 | 252 | 383223 | 2206.69 | 637 | 633 | 173.4 |
| C | 1 | 44 | 270719 | 1557.79 | 637 | 633 | 173.4 |
| D | 7 | 96 | 476042 | 2668.19 | 641 | 619 | 178.2 |
| D | 2 | 249 | 247318 | 1384.53 | 641 | 619 | 178.2 |
| D | 1 | 47 | 204472 | 1144.07 | 641 | 619 | 178.2 |
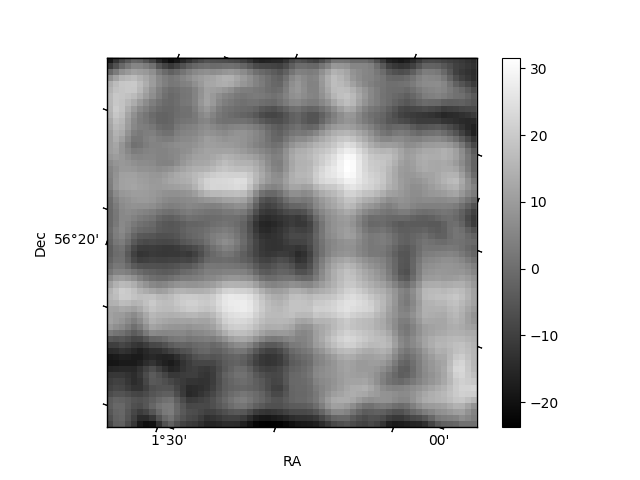
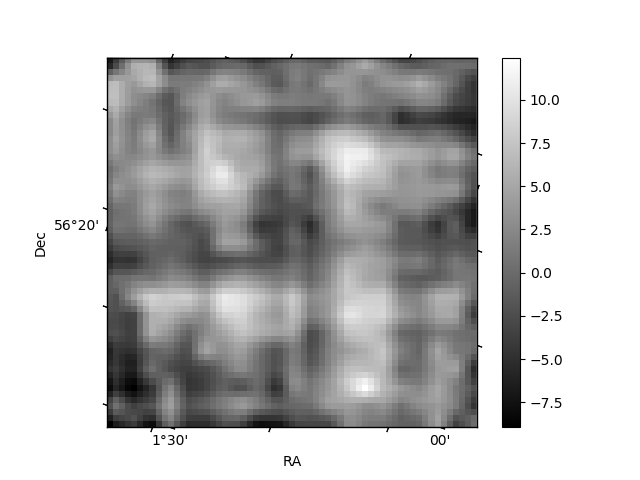
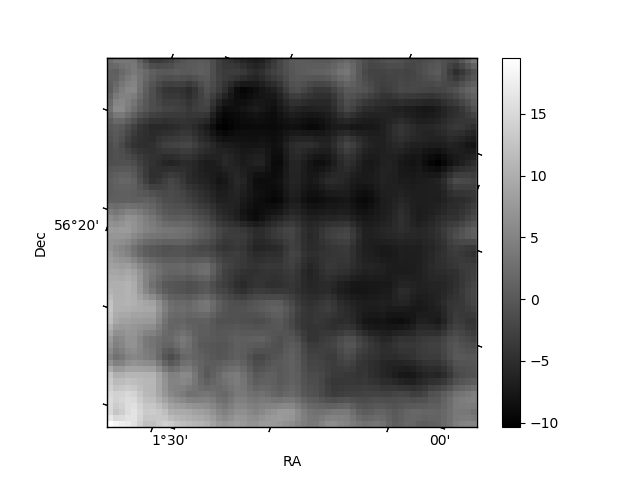
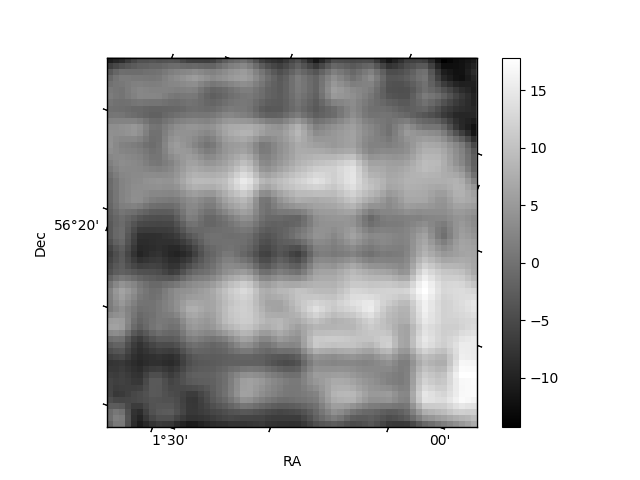
Histogram calculated using DETX and DETY for each event in the final _common_clean file
| Quadrant A | 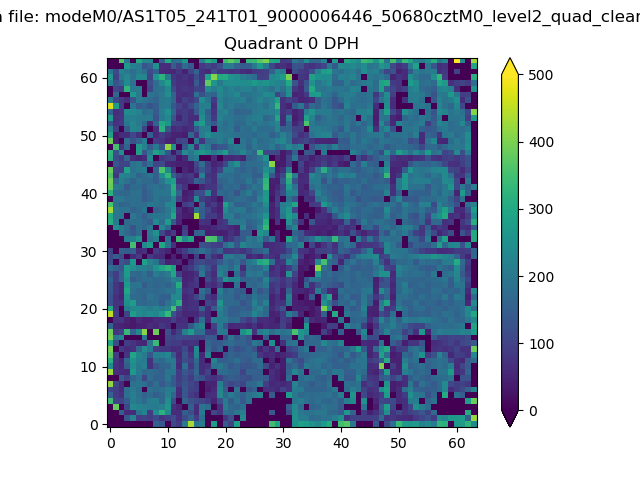 |
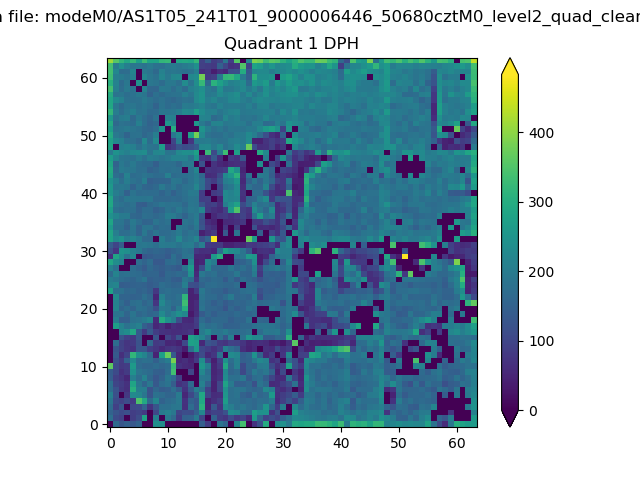 |
Quadrant B |
|---|---|---|---|
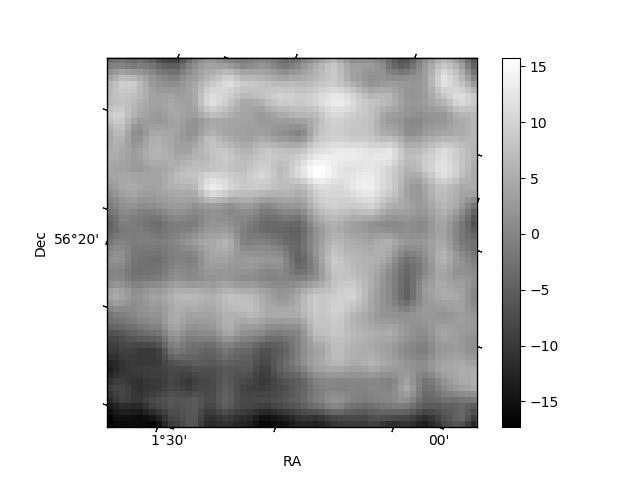
| Quadrant D | 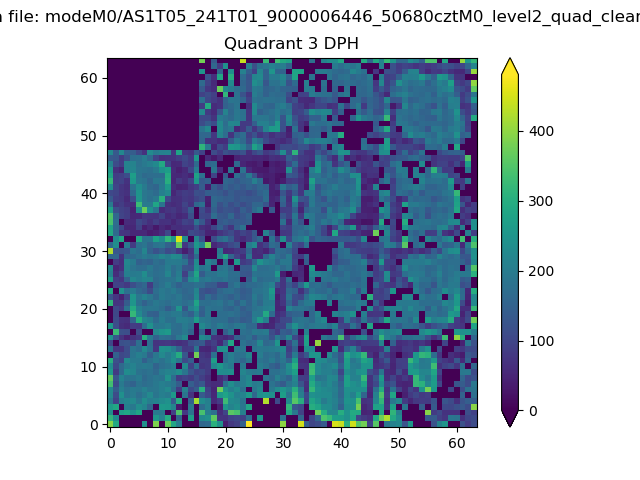 |
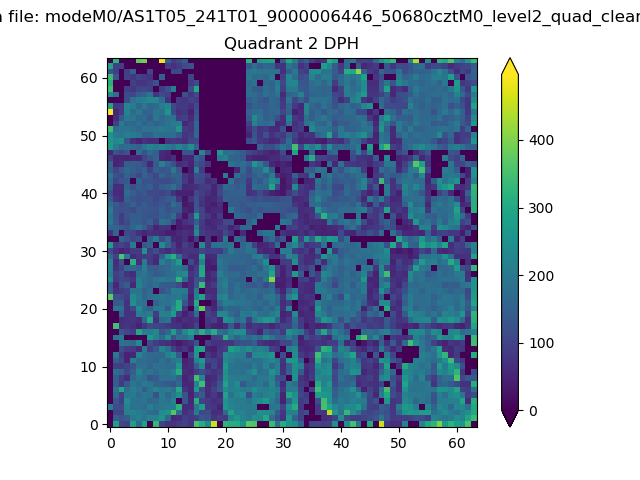 |
Quadrant C |
| Plot type | Count rate plots | Images |
|---|---|---|
| Comparison with Poisson distribution Blue bars denote a histogram of data divided into 1 sec bins. Red curve is a Poisson curve with rate = median count rate of data. |
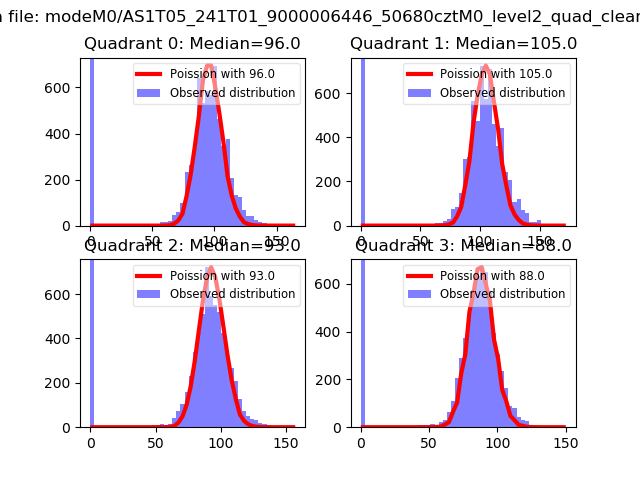 |
 |
| Quadrant-wise count rates Data is divided into 100 sec bins |
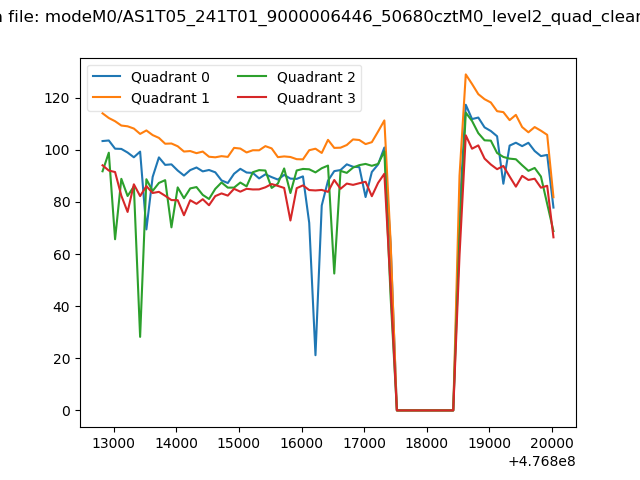 |
|
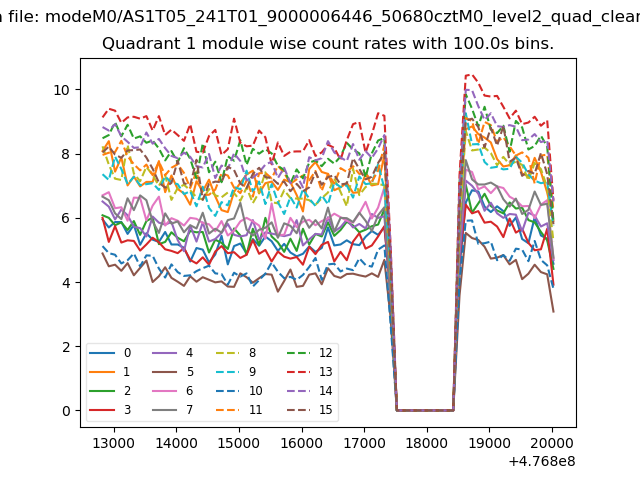
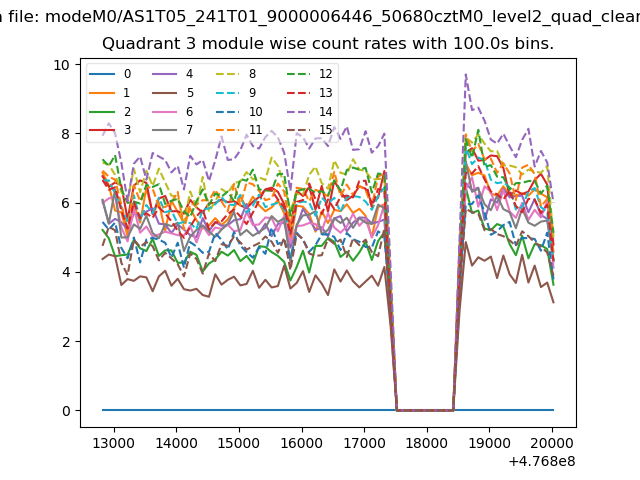
| Module-wise count rates for Quadrant A Data is divided into 100 sec bins |
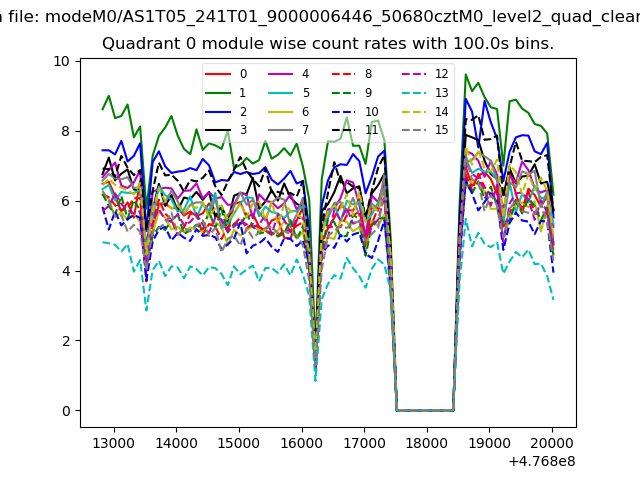 |
 |
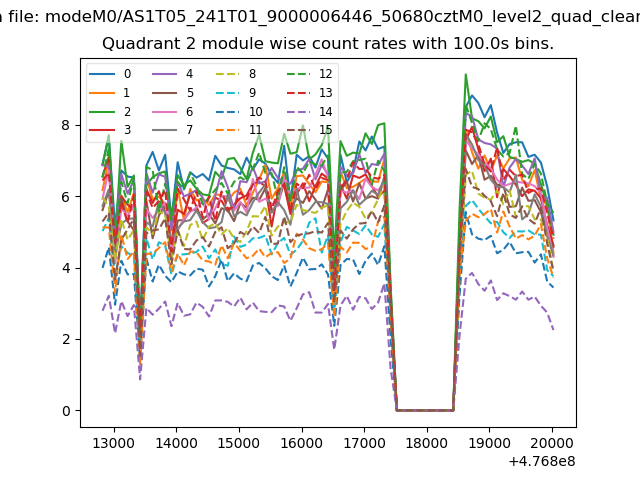
| Module-wise count rates for Quadrant B Data is divided into 100 sec bins |
 |
 |
| Module-wise count rates for Quadrant C Data is divided into 100 sec bins |
 |
 |
| Module-wise count rates for Quadrant D Data is divided into 100 sec bins |
 |
 |
| Parameter | Plot |
|---|---|
| CZT HV Monitor | 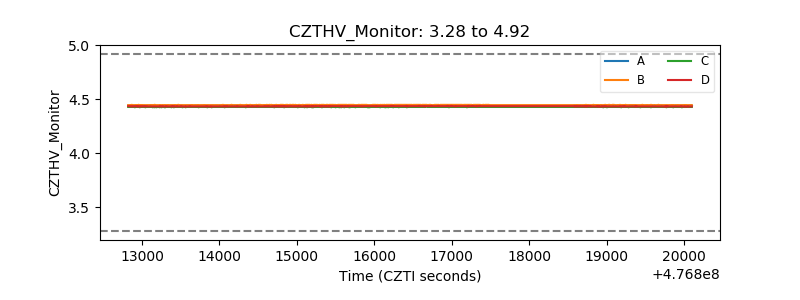 |
| D_VDD | 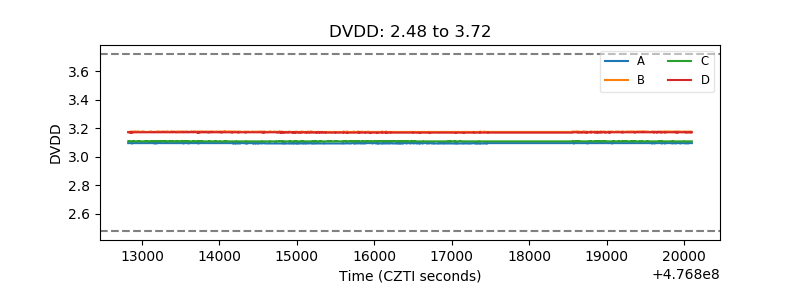 |
| Temperature 1 | 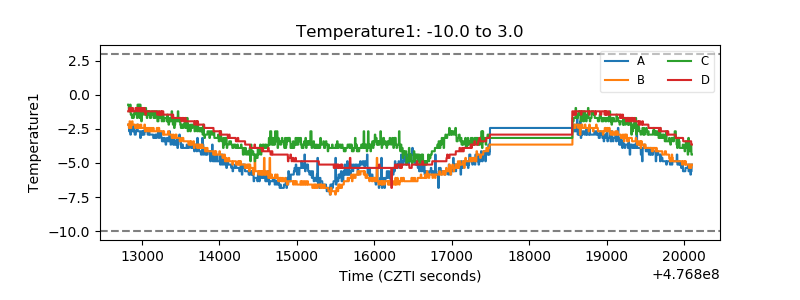 |
| Veto HV Monitor |  |
| Veto LLD | 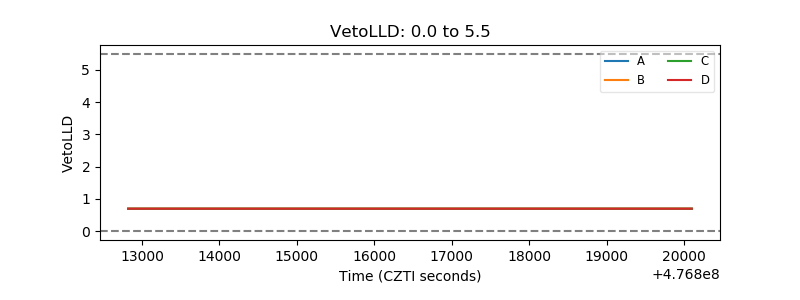 |
| Alpha Counter | 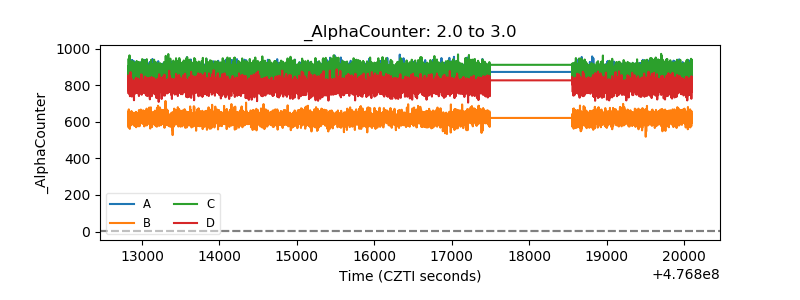 |
| _CPM_Rate | 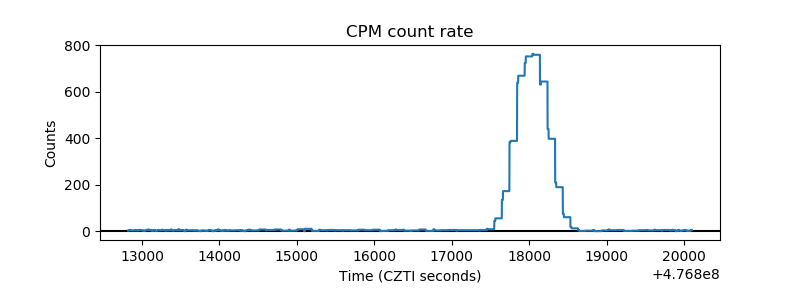 |
| CZT Counter | 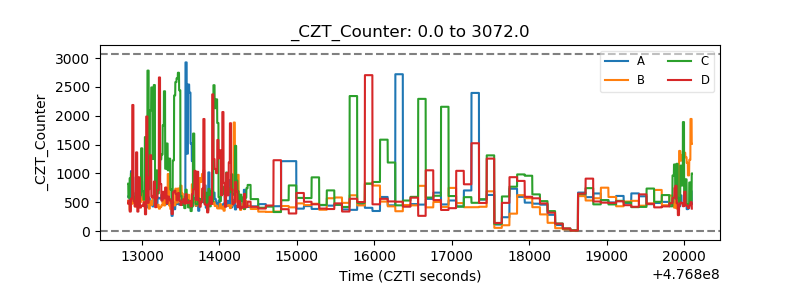 |
| +2.5 Volts monitor | 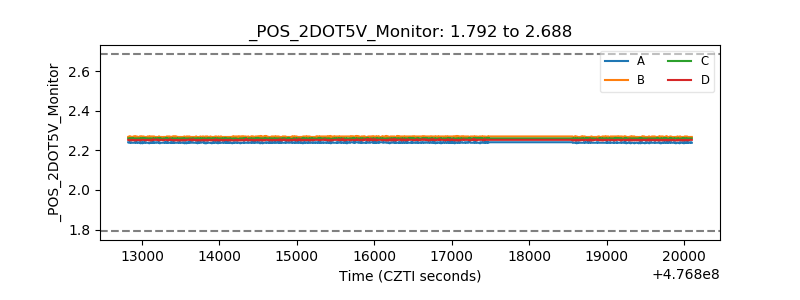 |
| +5 Volts monitor | 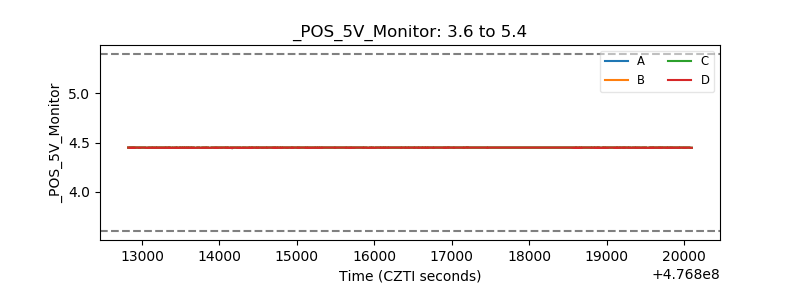 |
| _ROLL_ROT | 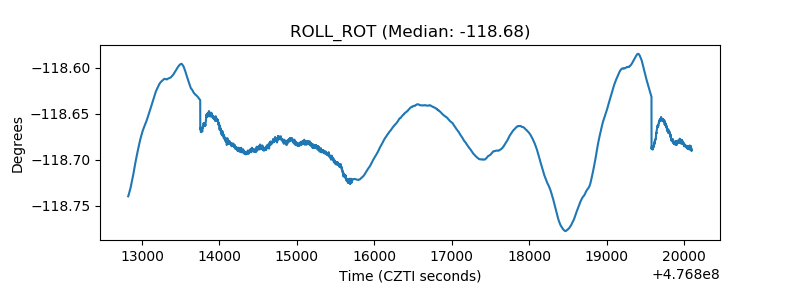 |
| _Roll_DEC | 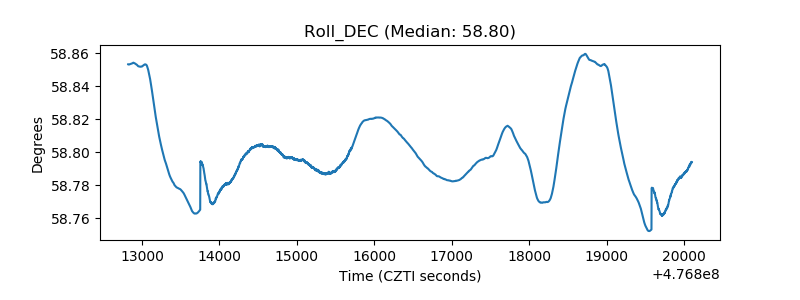 |
| _Roll_RA | 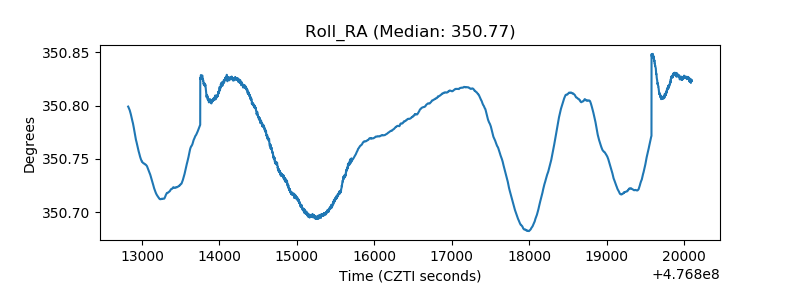 |
| Veto Counter | 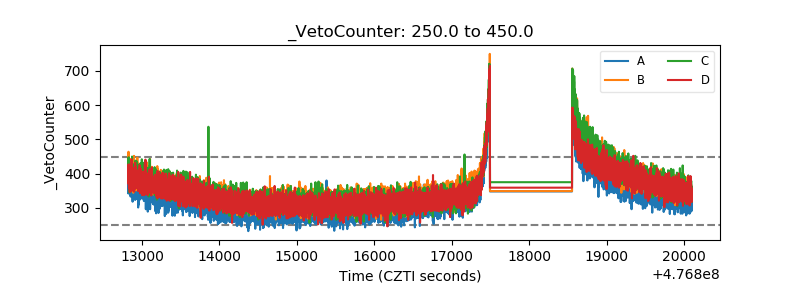 |