| Param | Original file | Final file |
|---|---|---|
| Filename | modeM0/AS1T05_241T01_9000006446_50681cztM0_level2.fits | modeM0/AS1T05_241T01_9000006446_50681cztM0_level2_quad_clean.evt |
| Size (bytes) | 465,451,200 | 91,416,960 |
| Size | 443.9 MB | 87.2 MB |
| Events in quadrant A | 3,554,569 | 597,559 |
| Events in quadrant B | 4,535,576 | 638,647 |
| Events in quadrant C | 5,160,802 | 559,406 |
| Events in quadrant D | 3,503,479 | 545,285 |
| Mode M9 | |||
|---|---|---|---|
| Quadrant | BADHDUFLAG | Total packets | Discarded packets |
| A | 0 | 12 | 0 |
| B | 0 | 12 | 0 |
| C | 0 | 12 | 0 |
| D | 0 | 12 | 0 |
| Mode M0 | |||
|---|---|---|---|
| Quadrant | BADHDUFLAG | Total packets | Discarded packets |
| A | 0 | 14747 | 1 |
| B | 0 | 17659 | 1 |
| C | 0 | 19483 | 1 |
| D | 0 | 14599 | 7 |
| Mode SS | |||
|---|---|---|---|
| Quadrant | BADHDUFLAG | Total packets | Discarded packets |
| A | 0 | 124 | 0 |
| B | 0 | 124 | 0 |
| C | 0 | 124 | 0 |
| D | 0 | 124 | 0 |
| Quadrant | Total seconds | Saturated seconds | Saturation percentage |
|---|---|---|---|
| A | 6120 | 96 | 1.568627% |
| B | 6120 | 211 | 3.447712% |
| C | 6121 | 414 | 6.763601% |
| D | 6120 | 100 | 1.633987% |
Noise dominated data is calculated using 1-second bins in cleaned event files. If a bin has >2000 counts, and if more than 50% of those come from <1% of pixels, then it is considered to be noise-dominated and hence unusable.
| Quadrant | # 1 sec bins | Bins with >0 counts | Bins with >2000 counts | High rate bins dominated by noise | Noise dominated (total time) | Noise dominated (detector-on time) | Marked lightcurve |
|---|---|---|---|---|---|---|---|
| A | 7275 | 6120 | 78 | 78 | 1.07% | 1.27% | 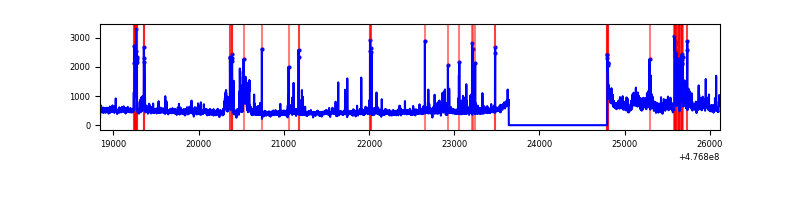 |
| B | 7275 | 6121 | 134 | 134 | 1.84% | 2.19% | 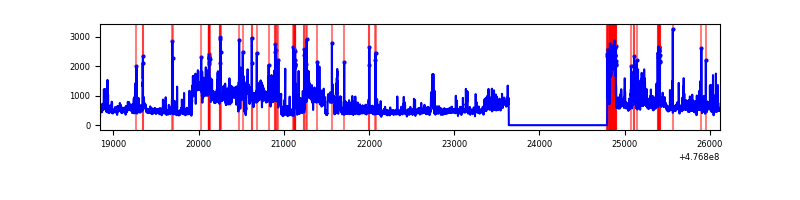 |
| C | 7276 | 6121 | 364 | 364 | 5.00% | 5.95% | 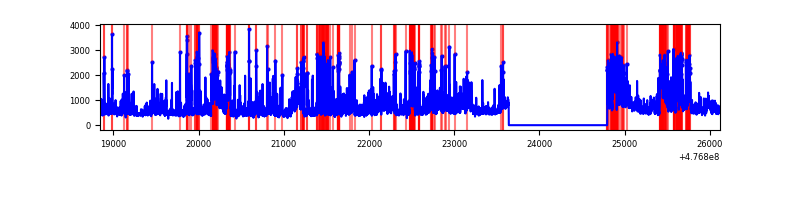 |
| D | 7275 | 6121 | 68 | 68 | 0.93% | 1.11% | 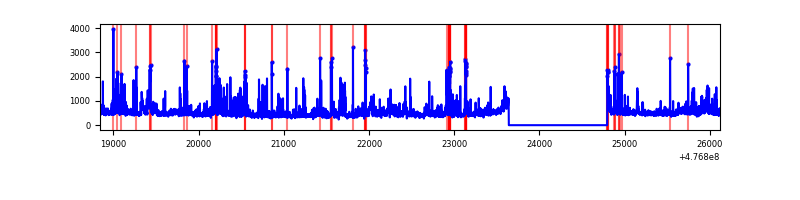 |
Top three noisy pixels from each quadrant. If the there are fewer than three noisy pixels in the level2.evt file, extra rows are filled as -1
| Pixel properties | Quadrant properties | ||||||
|---|---|---|---|---|---|---|---|
| Quadrant | DetID | PixID | Counts | Sigma | Mean | Median | Sigma |
| A | 4 | 3 | 218688 | 1367.44 | 650 | 634 | 159.5 |
| A | 8 | 38 | 161955 | 1011.66 | 650 | 634 | 159.5 |
| A | 10 | 253 | 161331 | 1007.74 | 650 | 634 | 159.5 |
| B | 4 | 170 | 1072621 | 7940.29 | 641 | 621 | 135.0 |
| B | 0 | 229 | 324566 | 2399.46 | 641 | 621 | 135.0 |
| B | 5 | 185 | 222252 | 1641.62 | 641 | 621 | 135.0 |
| C | 13 | 113 | 775357 | 4471.4 | 632 | 626 | 173.3 |
| C | 4 | 5 | 506688 | 2920.76 | 632 | 626 | 173.3 |
| C | 1 | 44 | 345382 | 1989.78 | 632 | 626 | 173.3 |
| D | 2 | 249 | 256273 | 1451.08 | 637 | 614 | 176.2 |
| D | 7 | 96 | 138098 | 780.34 | 637 | 614 | 176.2 |
| D | 15 | 185 | 137162 | 775.03 | 637 | 614 | 176.2 |
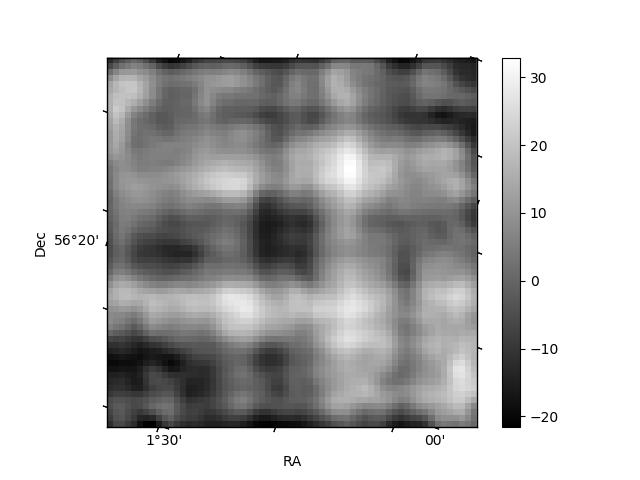
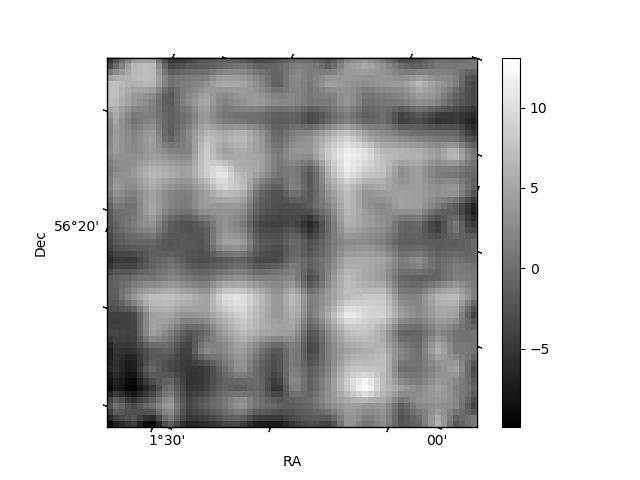
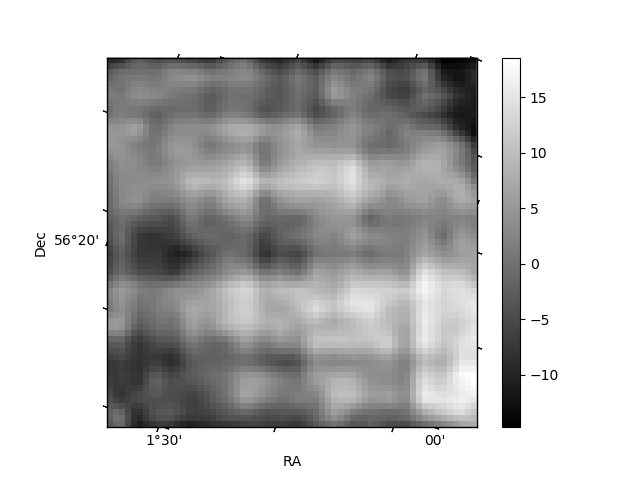
Histogram calculated using DETX and DETY for each event in the final _common_clean file
| Quadrant A | 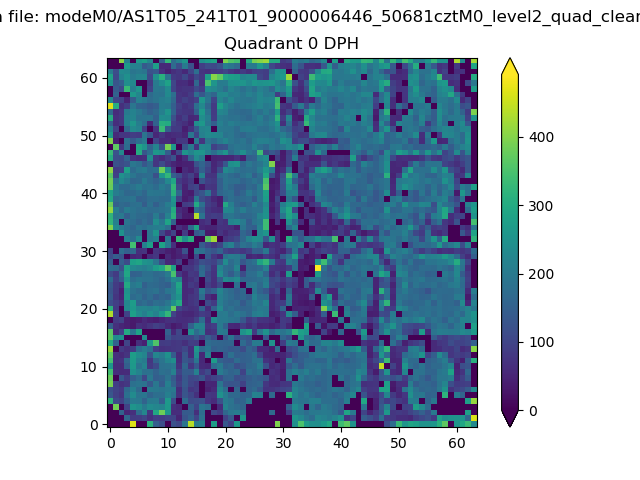 |
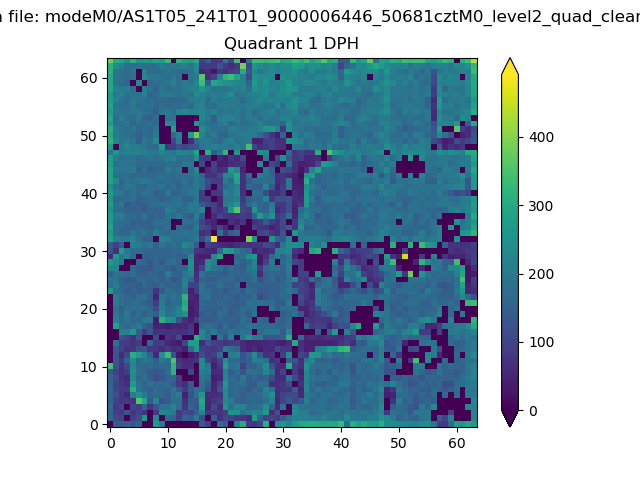 |
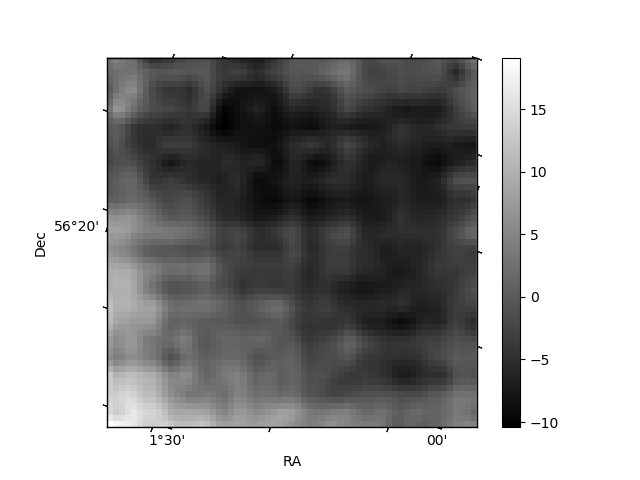
Quadrant B |
|---|---|---|---|
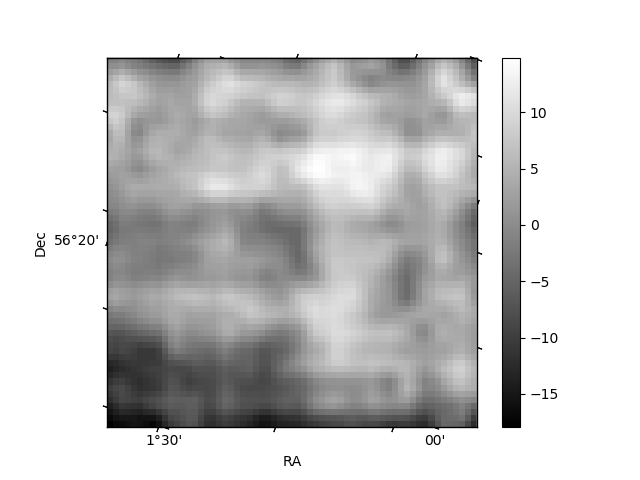
| Quadrant D | 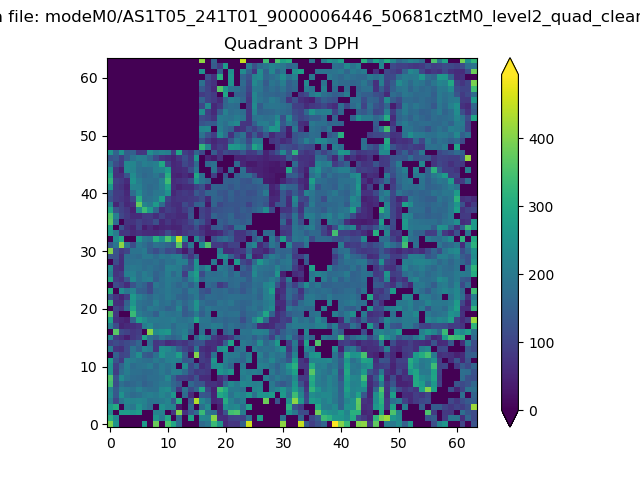 |
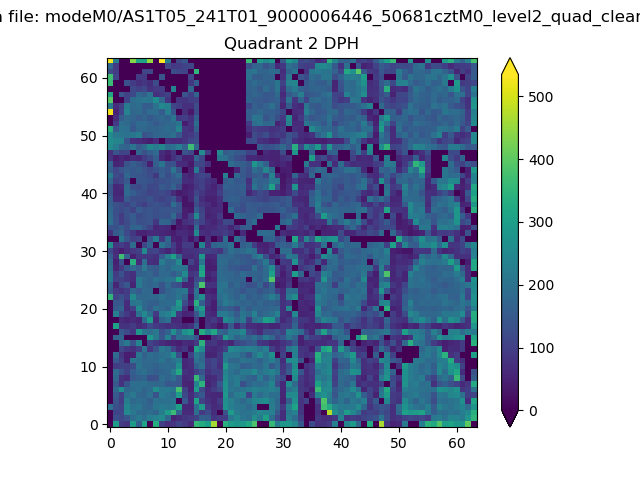 |
Quadrant C |
| Plot type | Count rate plots | Images |
|---|---|---|
| Comparison with Poisson distribution Blue bars denote a histogram of data divided into 1 sec bins. Red curve is a Poisson curve with rate = median count rate of data. |
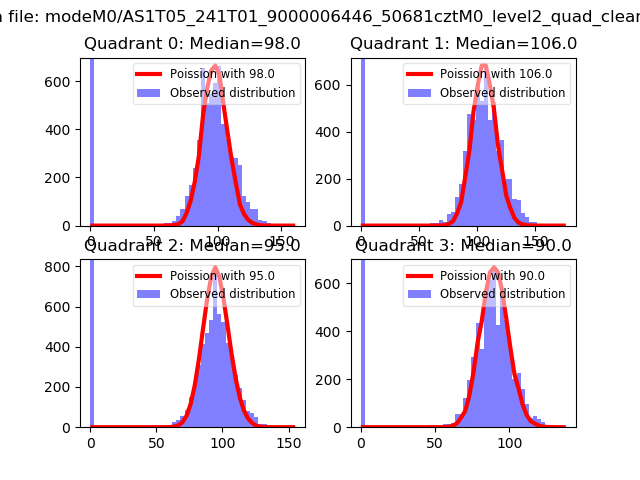 |
 |
| Quadrant-wise count rates Data is divided into 100 sec bins |
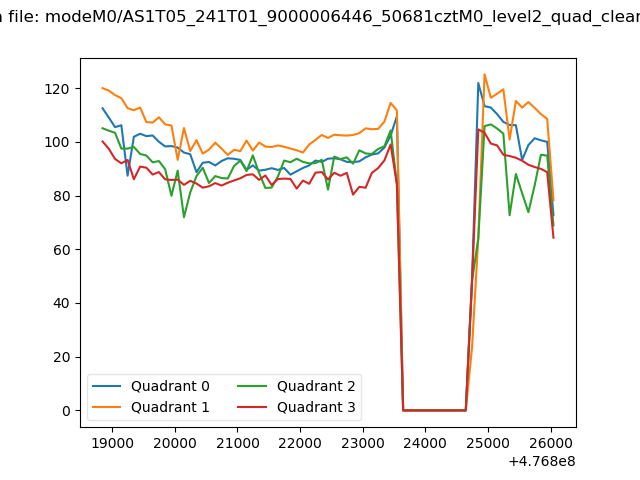 |
|
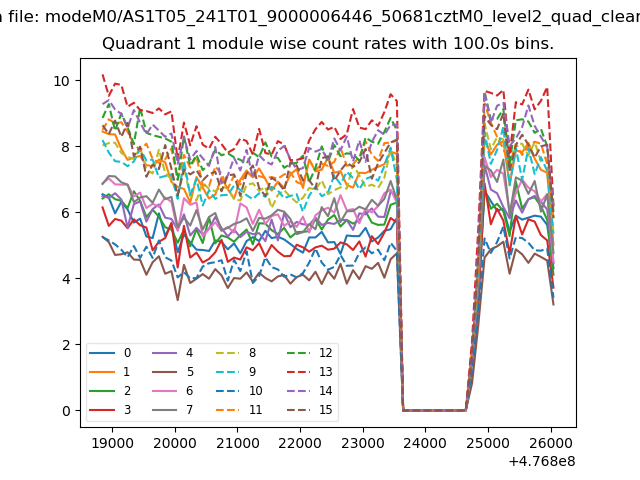
| Module-wise count rates for Quadrant A Data is divided into 100 sec bins |
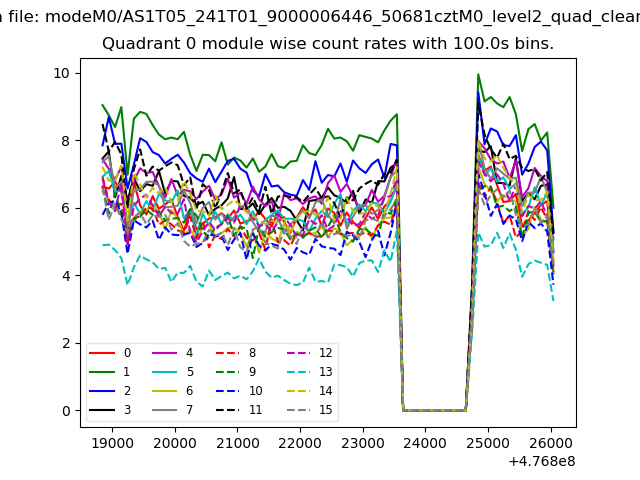 |
 |
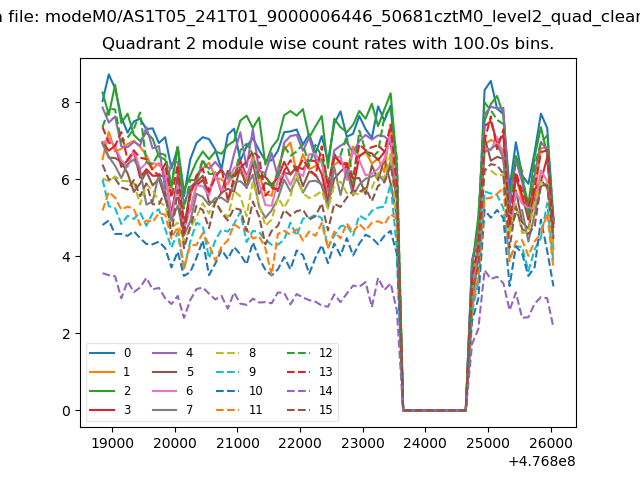
| Module-wise count rates for Quadrant B Data is divided into 100 sec bins |
 |
 |
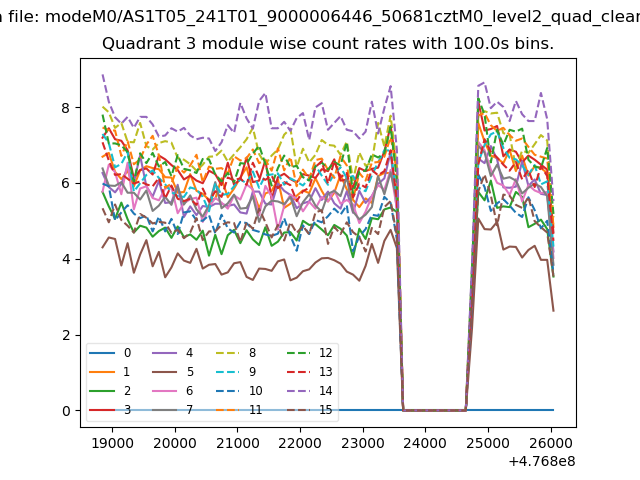
| Module-wise count rates for Quadrant C Data is divided into 100 sec bins |
 |
 |
| Module-wise count rates for Quadrant D Data is divided into 100 sec bins |
 |
 |
| Parameter | Plot |
|---|---|
| CZT HV Monitor |  |
| D_VDD | 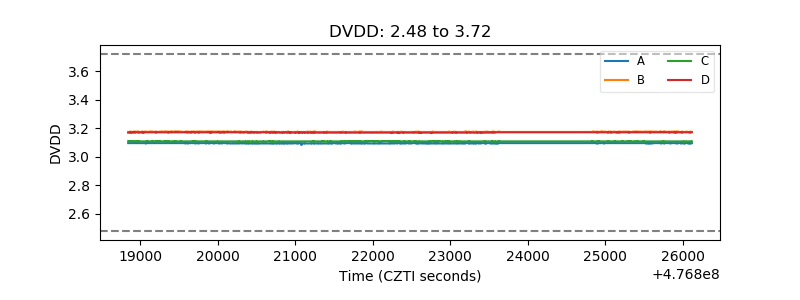 |
| Temperature 1 | 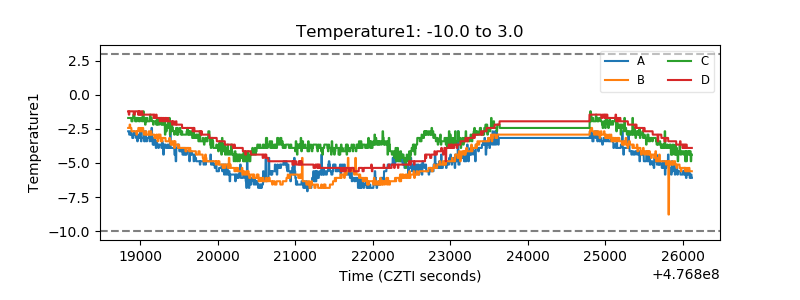 |
| Veto HV Monitor | 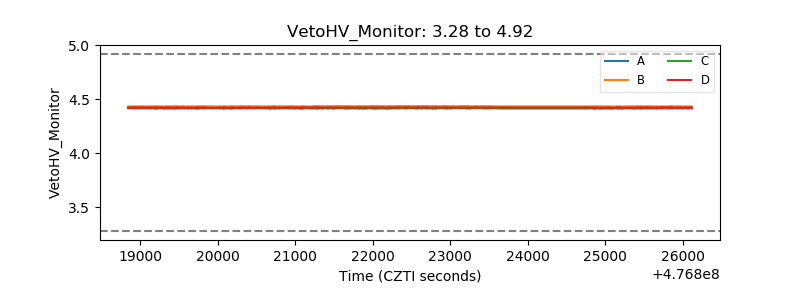 |
| Veto LLD | 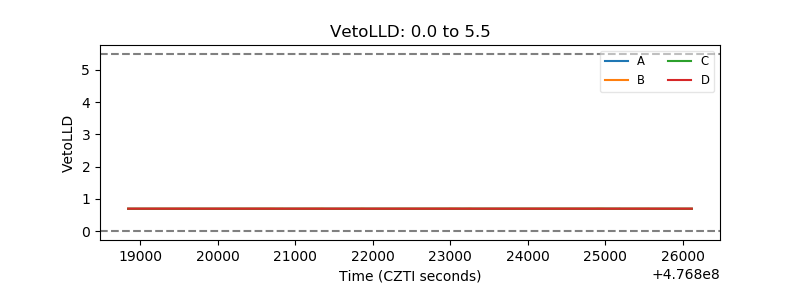 |
| Alpha Counter | 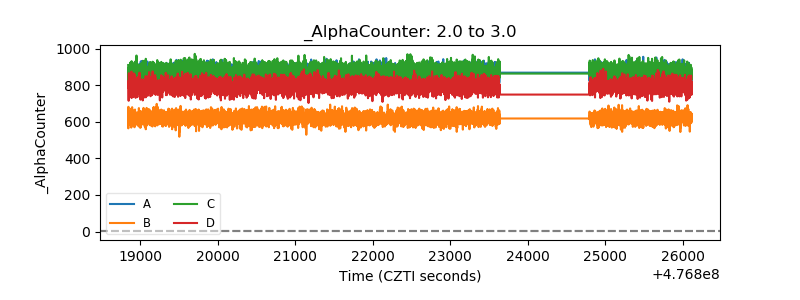 |
| _CPM_Rate | 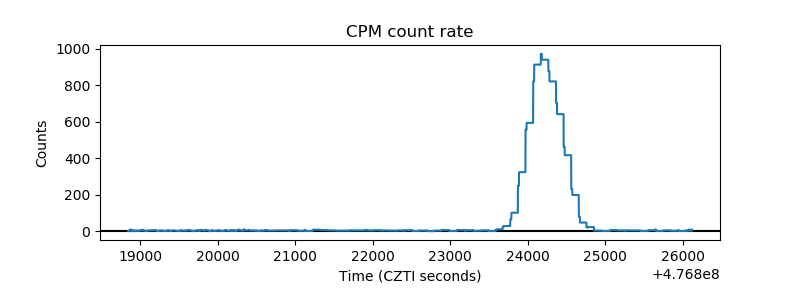 |
| CZT Counter | 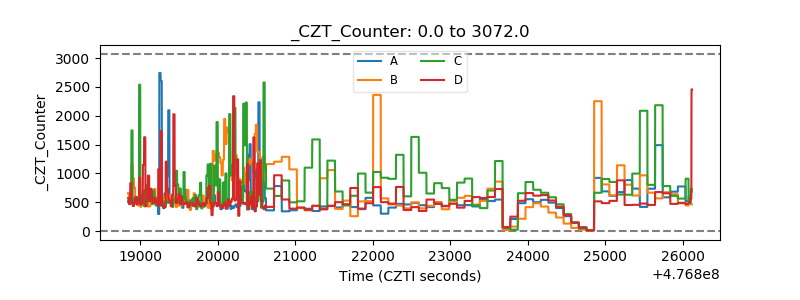 |
| +2.5 Volts monitor | 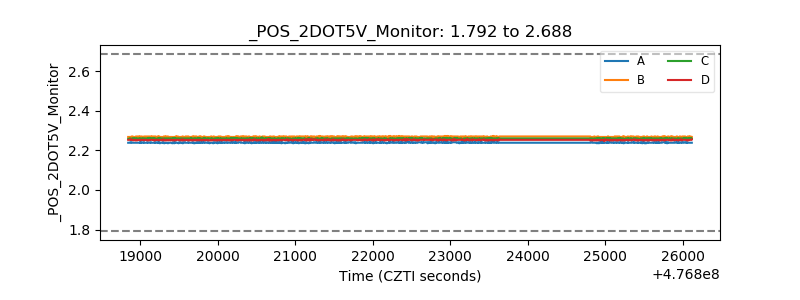 |
| +5 Volts monitor | 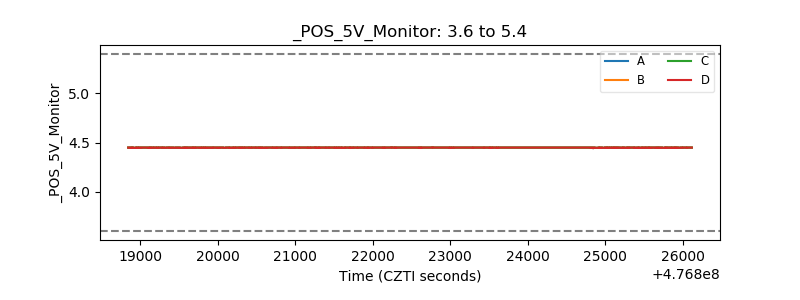 |
| _ROLL_ROT | 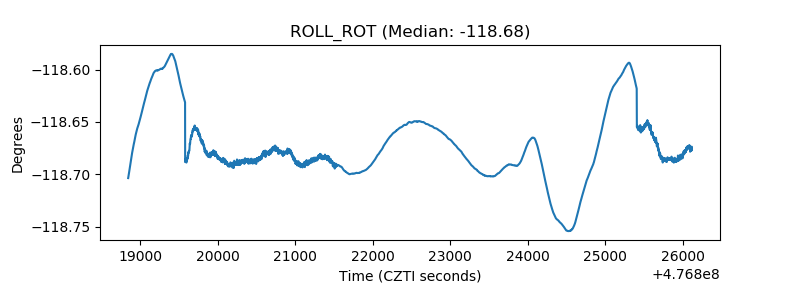 |
| _Roll_DEC | 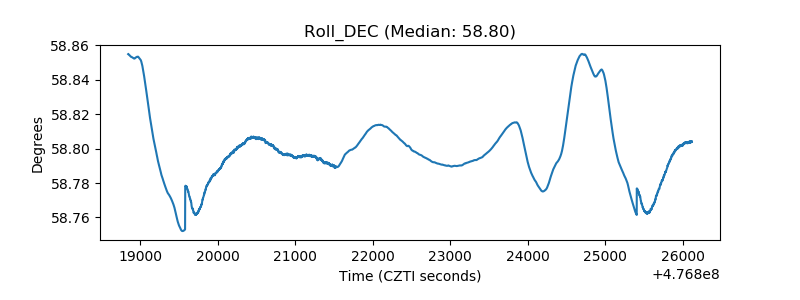 |
| _Roll_RA | 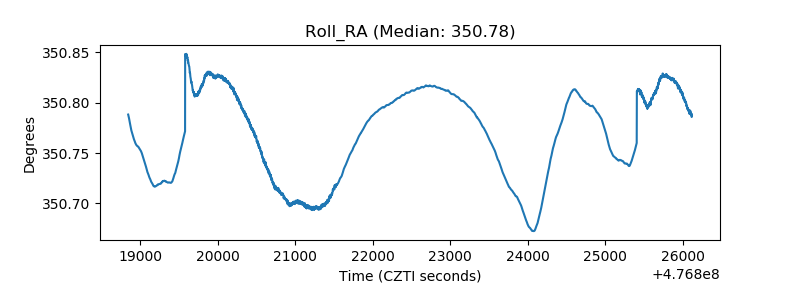 |
| Veto Counter | 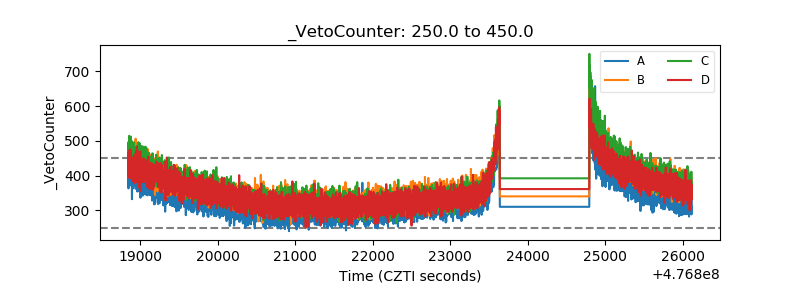 |