| Param | Original file | Final file |
|---|---|---|
| Filename | modeM0/AS1T05_241T01_9000006446_50682cztM0_level2.fits | modeM0/AS1T05_241T01_9000006446_50682cztM0_level2_quad_clean.evt |
| Size (bytes) | 498,421,440 | 94,250,880 |
| Size | 475.3 MB | 89.9 MB |
| Events in quadrant A | 3,959,528 | 620,013 |
| Events in quadrant B | 4,348,083 | 669,679 |
| Events in quadrant C | 6,039,472 | 568,450 |
| Events in quadrant D | 3,613,472 | 555,221 |
| Mode M9 | |||
|---|---|---|---|
| Quadrant | BADHDUFLAG | Total packets | Discarded packets |
| A | 0 | 12 | 0 |
| B | 0 | 12 | 0 |
| C | 0 | 12 | 0 |
| D | 0 | 12 | 0 |
| Mode M0 | |||
|---|---|---|---|
| Quadrant | BADHDUFLAG | Total packets | Discarded packets |
| A | 0 | 15895 | 3 |
| B | 0 | 17252 | 2 |
| C | 0 | 22305 | 2 |
| D | 0 | 15136 | 2 |
| Mode SS | |||
|---|---|---|---|
| Quadrant | BADHDUFLAG | Total packets | Discarded packets |
| A | 0 | 130 | 0 |
| B | 0 | 130 | 0 |
| C | 0 | 130 | 0 |
| D | 0 | 130 | 0 |
| Quadrant | Total seconds | Saturated seconds | Saturation percentage |
|---|---|---|---|
| A | 6307 | 99 | 1.569684% |
| B | 6307 | 195 | 3.091803% |
| C | 6308 | 613 | 9.717819% |
| D | 6308 | 186 | 2.948637% |
Noise dominated data is calculated using 1-second bins in cleaned event files. If a bin has >2000 counts, and if more than 50% of those come from <1% of pixels, then it is considered to be noise-dominated and hence unusable.
| Quadrant | # 1 sec bins | Bins with >0 counts | Bins with >2000 counts | High rate bins dominated by noise | Noise dominated (total time) | Noise dominated (detector-on time) | Marked lightcurve |
|---|---|---|---|---|---|---|---|
| A | 7522 | 6307 | 76 | 76 | 1.01% | 1.21% | 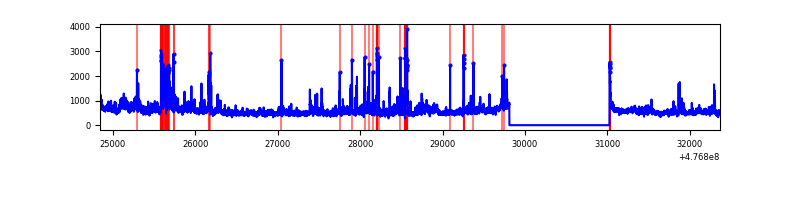 |
| B | 7522 | 6307 | 125 | 125 | 1.66% | 1.98% | 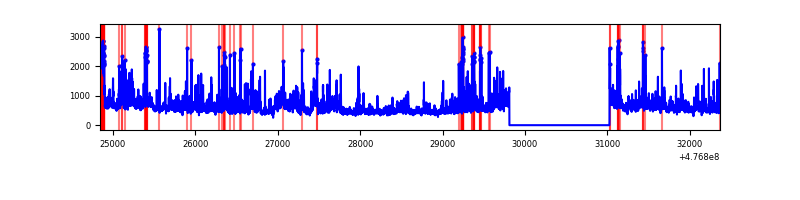 |
| C | 7523 | 6308 | 561 | 561 | 7.46% | 8.89% | 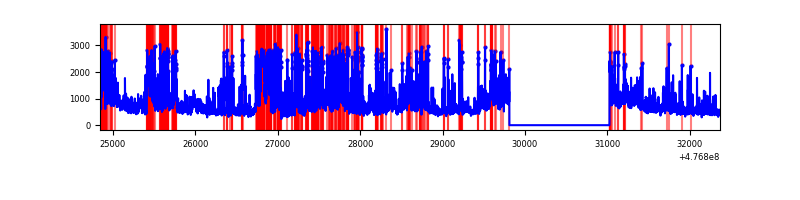 |
| D | 7523 | 6308 | 114 | 114 | 1.52% | 1.81% | 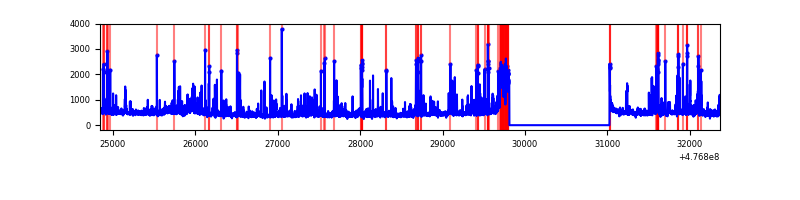 |
Top three noisy pixels from each quadrant. If the there are fewer than three noisy pixels in the level2.evt file, extra rows are filled as -1
| Pixel properties | Quadrant properties | ||||||
|---|---|---|---|---|---|---|---|
| Quadrant | DetID | PixID | Counts | Sigma | Mean | Median | Sigma |
| A | 10 | 253 | 293049 | 1764.75 | 671 | 654 | 165.7 |
| A | 4 | 3 | 226283 | 1361.79 | 671 | 654 | 165.7 |
| A | 4 | 4 | 160997 | 967.75 | 671 | 654 | 165.7 |
| B | 4 | 170 | 533139 | 3786.01 | 668 | 646 | 140.6 |
| B | 0 | 229 | 461802 | 3278.81 | 668 | 646 | 140.6 |
| B | 5 | 185 | 157321 | 1113.96 | 668 | 646 | 140.6 |
| C | 13 | 113 | 951076 | 5322.08 | 648 | 642 | 178.6 |
| C | 4 | 5 | 508816 | 2845.59 | 648 | 642 | 178.6 |
| C | 13 | 3 | 357340 | 1997.38 | 648 | 642 | 178.6 |
| D | 2 | 249 | 224829 | 1232.94 | 655 | 632 | 181.8 |
| D | 7 | 110 | 147027 | 805.08 | 655 | 632 | 181.8 |
| D | 2 | 153 | 134089 | 733.93 | 655 | 632 | 181.8 |
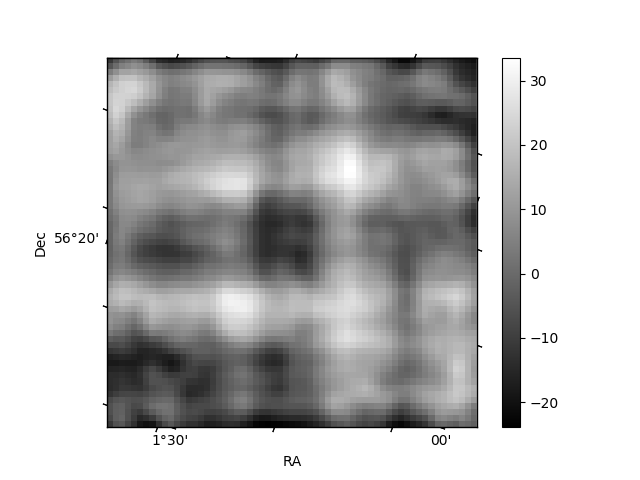
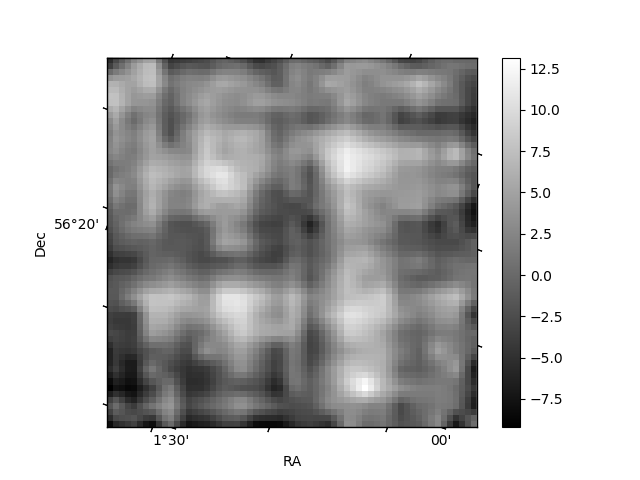
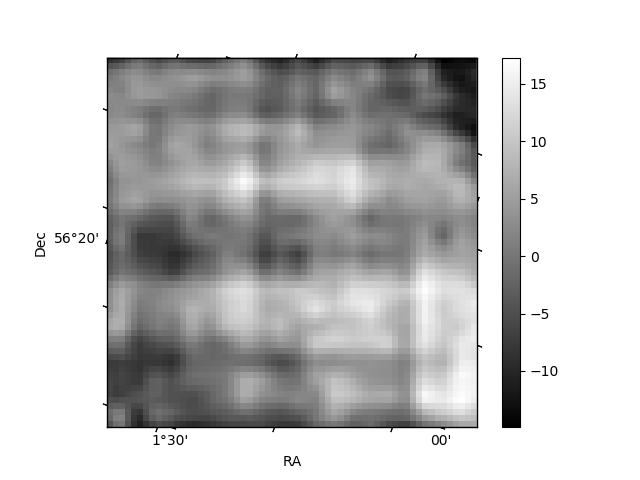
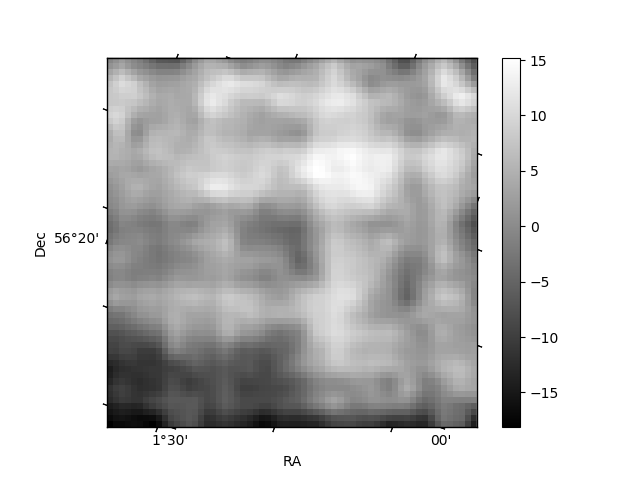
Histogram calculated using DETX and DETY for each event in the final _common_clean file
| Quadrant A | 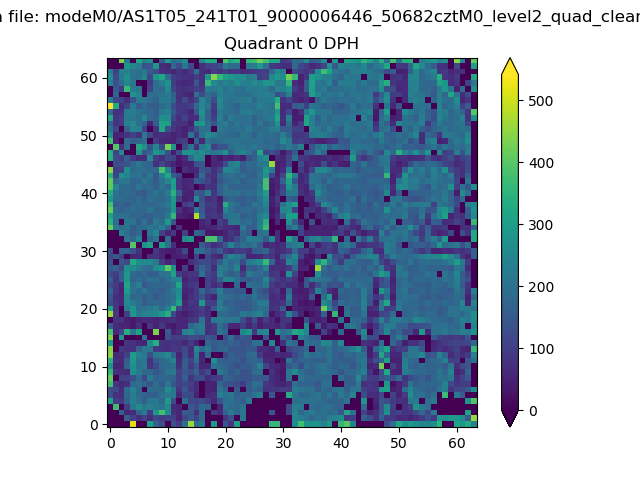 |
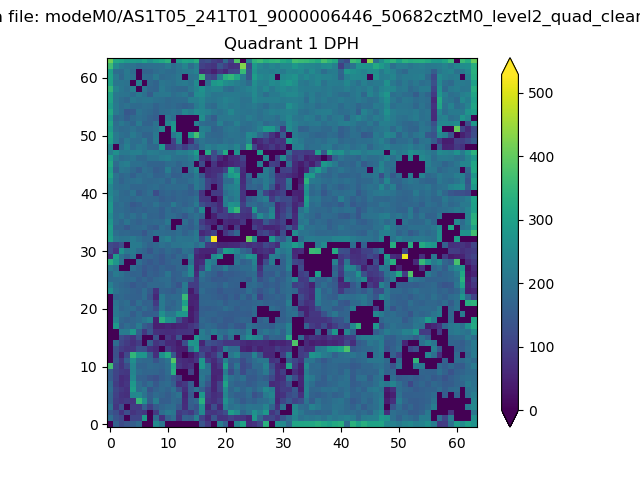 |
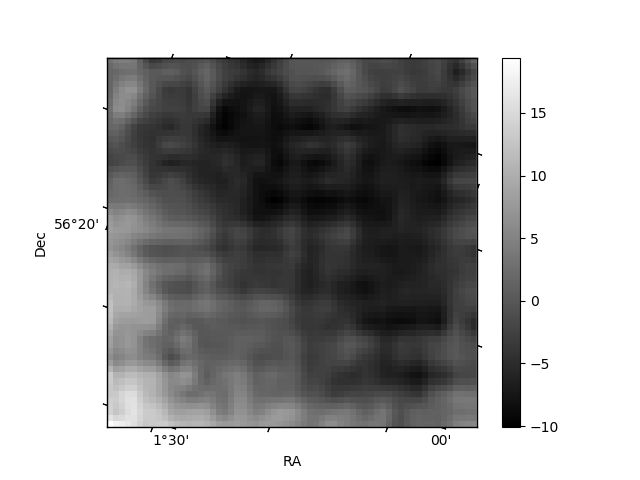
Quadrant B |
|---|---|---|---|
| Quadrant D | 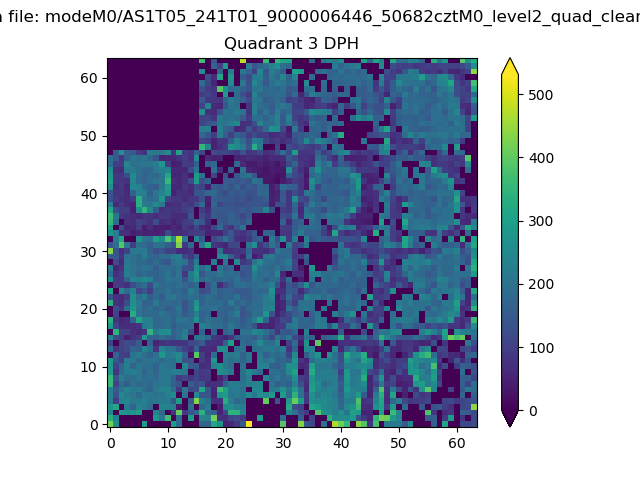 |
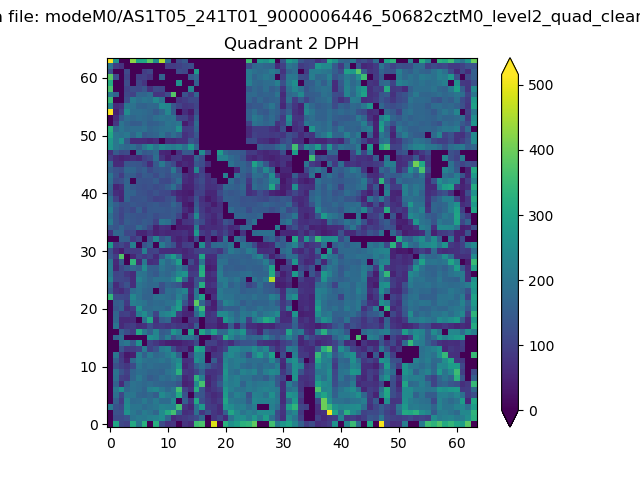 |
Quadrant C |
| Plot type | Count rate plots | Images |
|---|---|---|
| Comparison with Poisson distribution Blue bars denote a histogram of data divided into 1 sec bins. Red curve is a Poisson curve with rate = median count rate of data. |
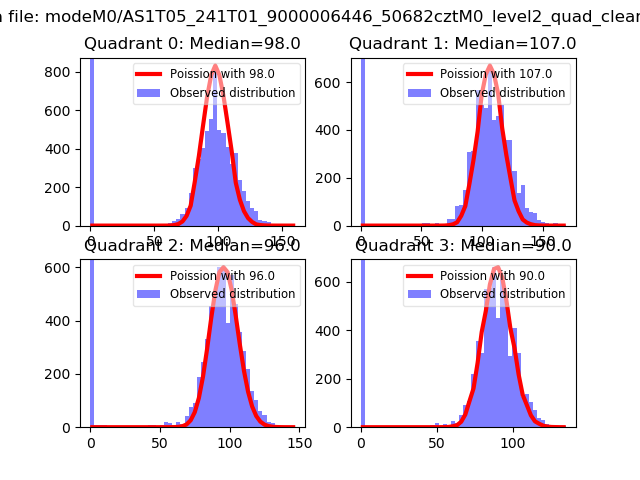 |
 |
| Quadrant-wise count rates Data is divided into 100 sec bins |
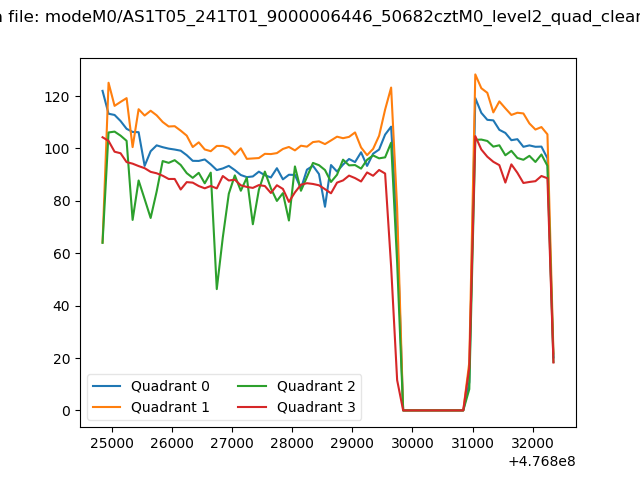 |
|
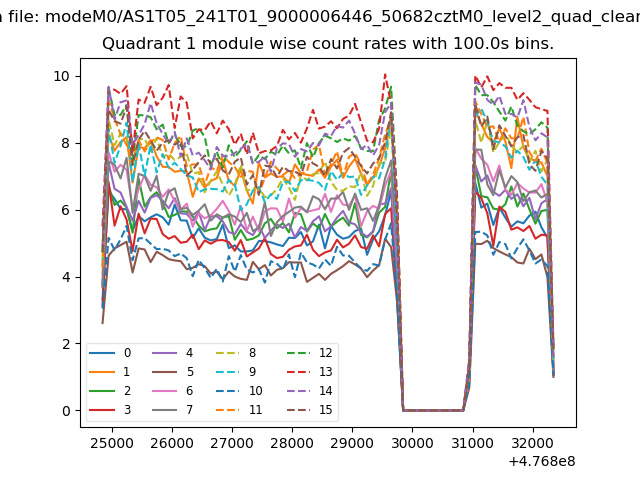
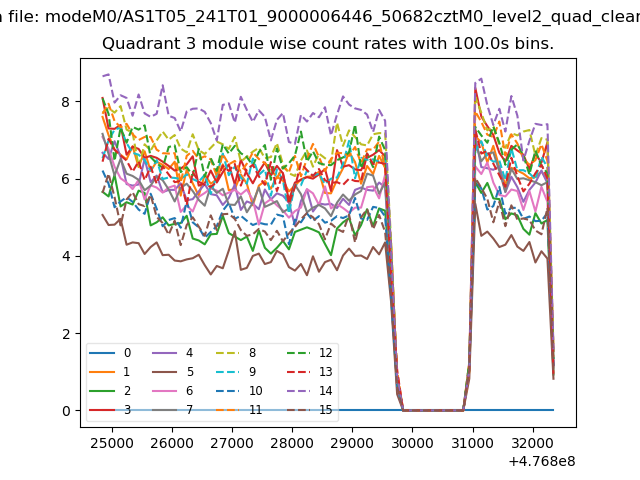
| Module-wise count rates for Quadrant A Data is divided into 100 sec bins |
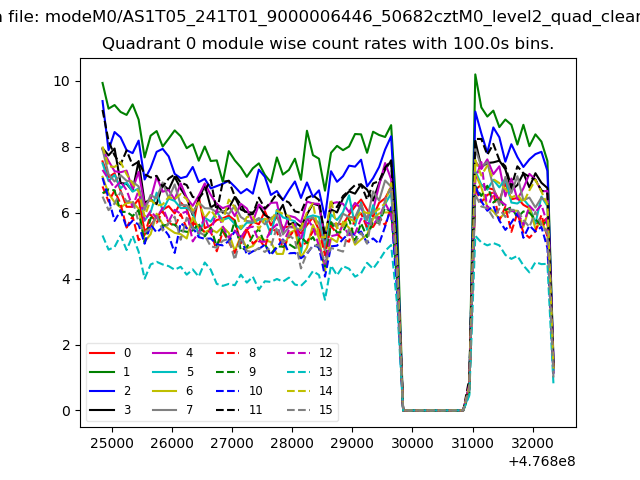 |
 |
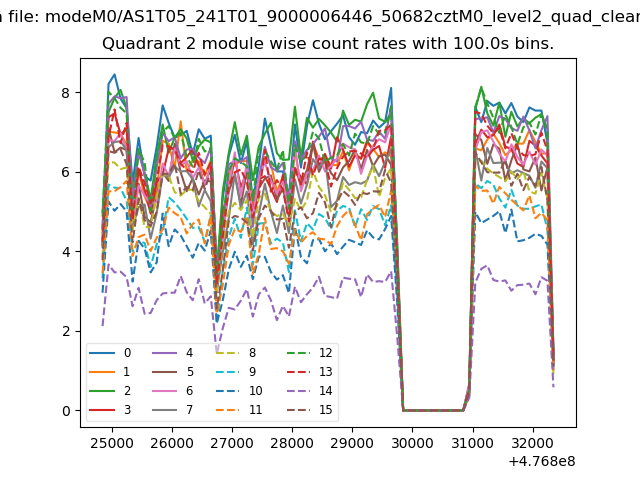
| Module-wise count rates for Quadrant B Data is divided into 100 sec bins |
 |
 |
| Module-wise count rates for Quadrant C Data is divided into 100 sec bins |
 |
 |
| Module-wise count rates for Quadrant D Data is divided into 100 sec bins |
 |
 |
| Parameter | Plot |
|---|---|
| CZT HV Monitor | 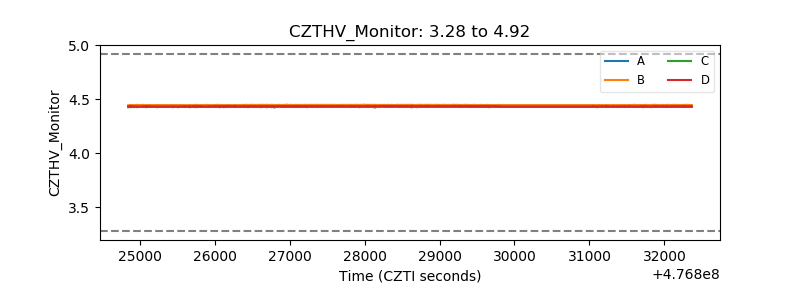 |
| D_VDD | 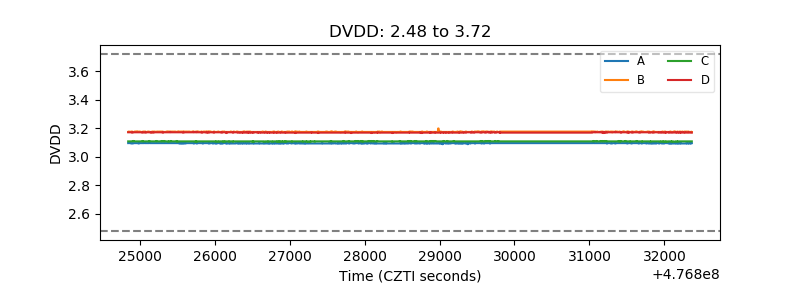 |
| Temperature 1 | 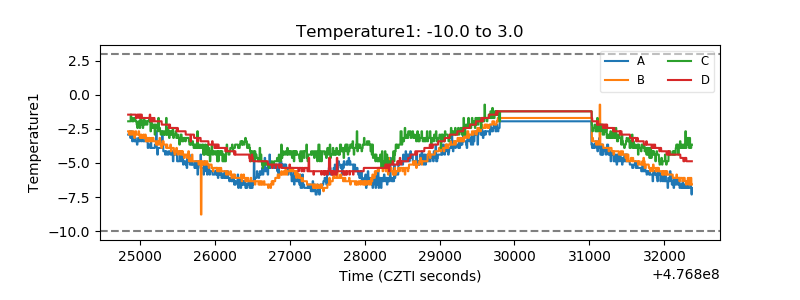 |
| Veto HV Monitor |  |
| Veto LLD | 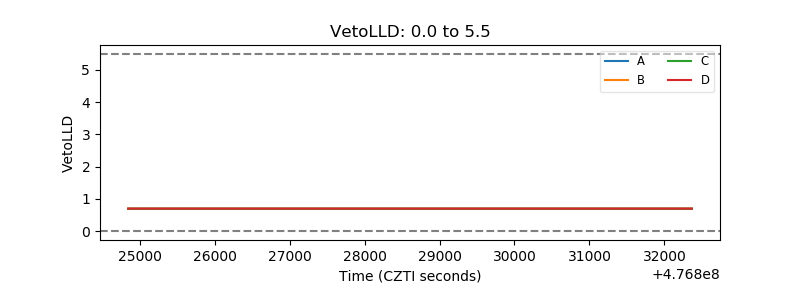 |
| Alpha Counter | 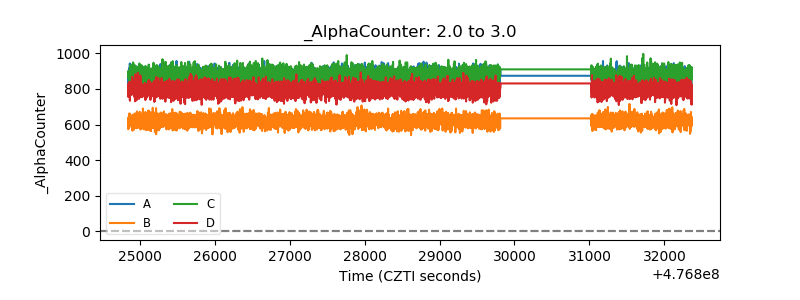 |
| _CPM_Rate | 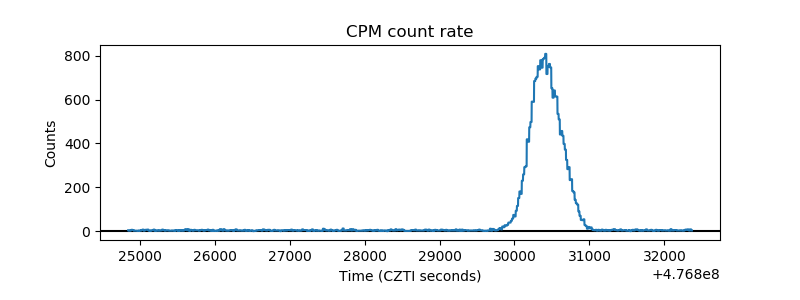 |
| CZT Counter | 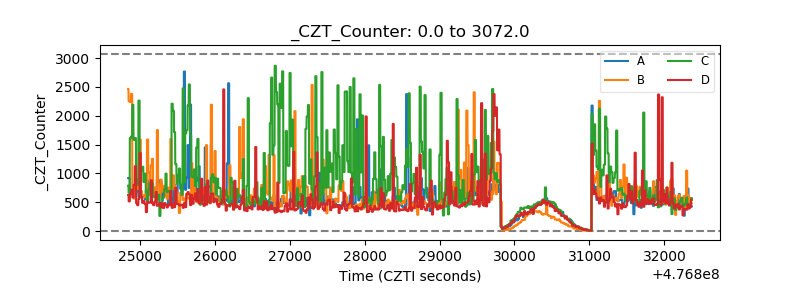 |
| +2.5 Volts monitor | 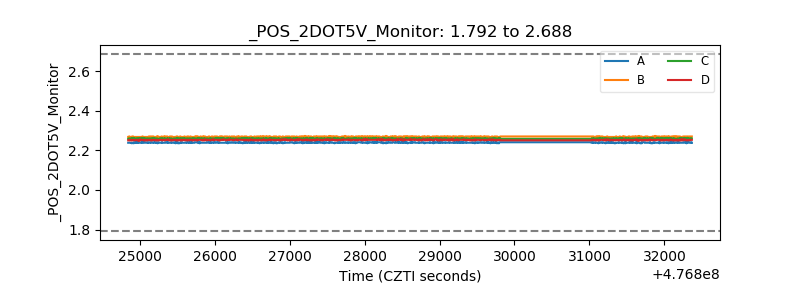 |
| +5 Volts monitor | 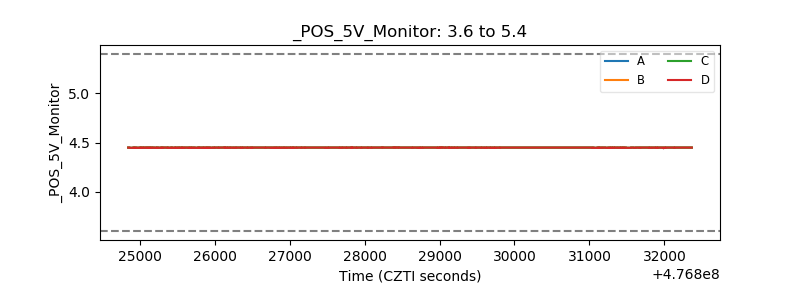 |
| _ROLL_ROT | 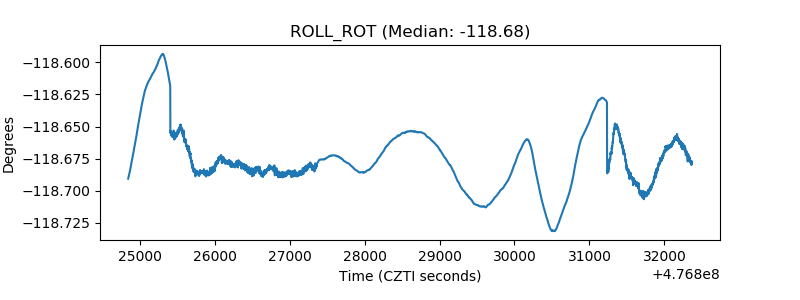 |
| _Roll_DEC | 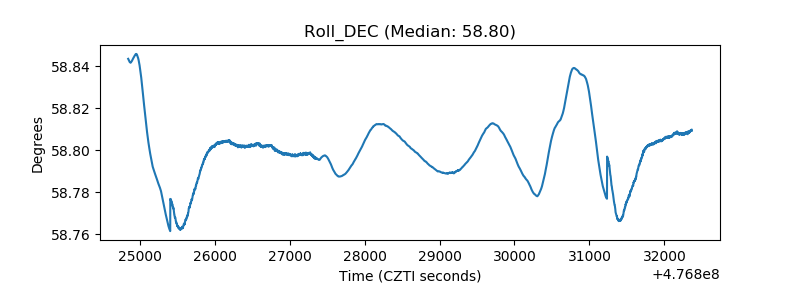 |
| _Roll_RA | 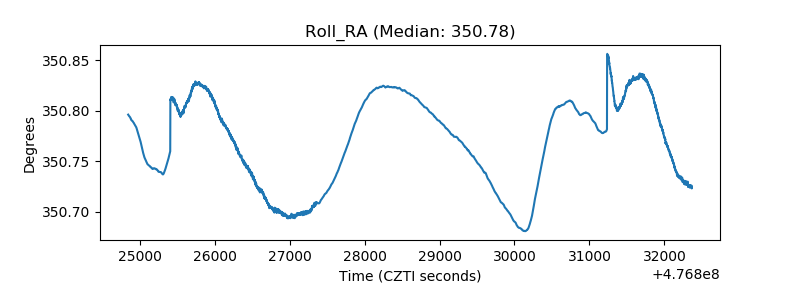 |
| Veto Counter | 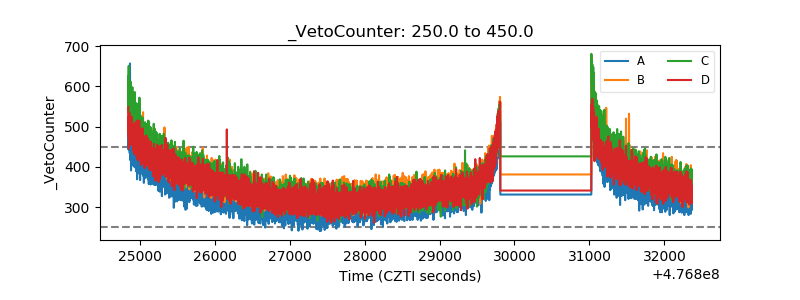 |