| Param | Original file | Final file |
|---|---|---|
| Filename | modeM0/AS1T05_241T01_9000006446_50683cztM0_level2.fits | modeM0/AS1T05_241T01_9000006446_50683cztM0_level2_quad_clean.evt |
| Size (bytes) | 527,477,760 | 95,834,880 |
| Size | 503.0 MB | 91.4 MB |
| Events in quadrant A | 3,734,227 | 642,439 |
| Events in quadrant B | 4,160,721 | 707,217 |
| Events in quadrant C | 7,151,501 | 498,686 |
| Events in quadrant D | 3,956,535 | 584,468 |
| Mode M9 | |||
|---|---|---|---|
| Quadrant | BADHDUFLAG | Total packets | Discarded packets |
| A | 0 | 13 | 0 |
| B | 0 | 14 | 0 |
| C | 0 | 14 | 0 |
| D | 0 | 14 | 0 |
| Mode M0 | |||
|---|---|---|---|
| Quadrant | BADHDUFLAG | Total packets | Discarded packets |
| A | 0 | 15432 | 2 |
| B | 0 | 16897 | 2 |
| C | 0 | 25848 | 7 |
| D | 0 | 16713 | 2 |
| Mode SS | |||
|---|---|---|---|
| Quadrant | BADHDUFLAG | Total packets | Discarded packets |
| A | 0 | 138 | 0 |
| B | 0 | 138 | 0 |
| C | 0 | 138 | 0 |
| D | 0 | 138 | 0 |
| Quadrant | Total seconds | Saturated seconds | Saturation percentage |
|---|---|---|---|
| A | 6723 | 144 | 2.141901% |
| B | 6723 | 164 | 2.439387% |
| C | 6722 | 1642 | 24.427254% |
| D | 6722 | 217 | 3.228206% |
Noise dominated data is calculated using 1-second bins in cleaned event files. If a bin has >2000 counts, and if more than 50% of those come from <1% of pixels, then it is considered to be noise-dominated and hence unusable.
| Quadrant | # 1 sec bins | Bins with >0 counts | Bins with >2000 counts | High rate bins dominated by noise | Noise dominated (total time) | Noise dominated (detector-on time) | Marked lightcurve |
|---|---|---|---|---|---|---|---|
| A | 7868 | 6723 | 48 | 48 | 0.61% | 0.71% |  |
| B | 7868 | 6724 | 58 | 58 | 0.74% | 0.86% | 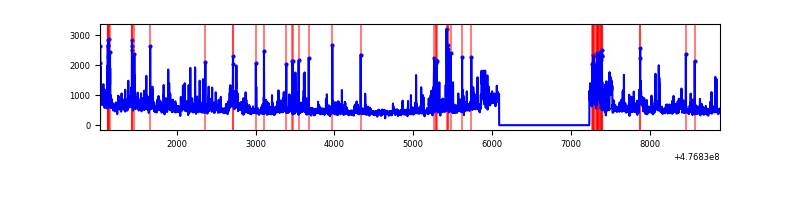 |
| C | 7866 | 6721 | 1071 | 1071 | 13.62% | 15.94% | 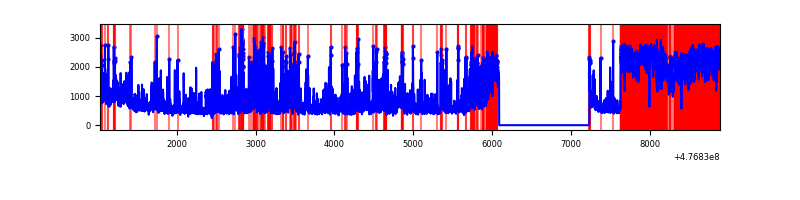 |
| D | 7867 | 6722 | 137 | 137 | 1.74% | 2.04% | 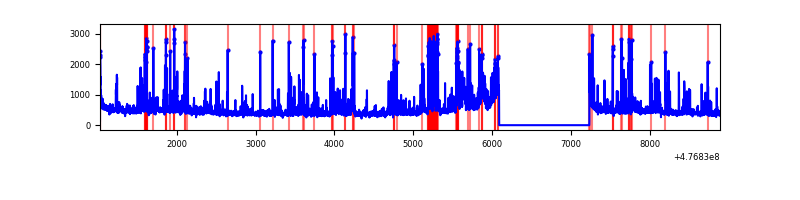 |
Top three noisy pixels from each quadrant. If the there are fewer than three noisy pixels in the level2.evt file, extra rows are filled as -1
| Pixel properties | Quadrant properties | ||||||
|---|---|---|---|---|---|---|---|
| Quadrant | DetID | PixID | Counts | Sigma | Mean | Median | Sigma |
| A | 4 | 3 | 230475 | 1281.51 | 714 | 695 | 179.3 |
| A | 10 | 253 | 125549 | 696.33 | 714 | 695 | 179.3 |
| A | 3 | 46 | 98999 | 548.25 | 714 | 695 | 179.3 |
| B | 4 | 170 | 491990 | 3238.75 | 717 | 694 | 151.7 |
| B | 0 | 229 | 233274 | 1533.23 | 717 | 694 | 151.7 |
| B | 2 | 249 | 108232 | 708.92 | 717 | 694 | 151.7 |
| C | 1 | 44 | 3127544 | 19256.5 | 583 | 580 | 162.4 |
| C | 13 | 113 | 558415 | 3435.26 | 583 | 580 | 162.4 |
| C | 13 | 3 | 395117 | 2429.64 | 583 | 580 | 162.4 |
| D | 2 | 249 | 349103 | 1797.85 | 695 | 670 | 193.8 |
| D | 1 | 47 | 149545 | 768.17 | 695 | 670 | 193.8 |
| D | 7 | 110 | 143225 | 735.56 | 695 | 670 | 193.8 |
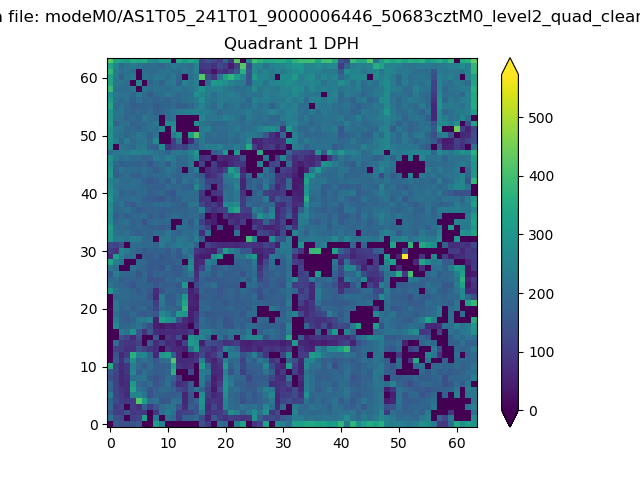
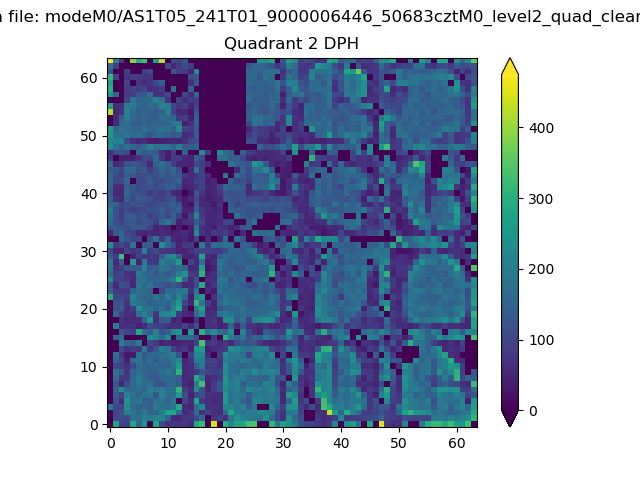
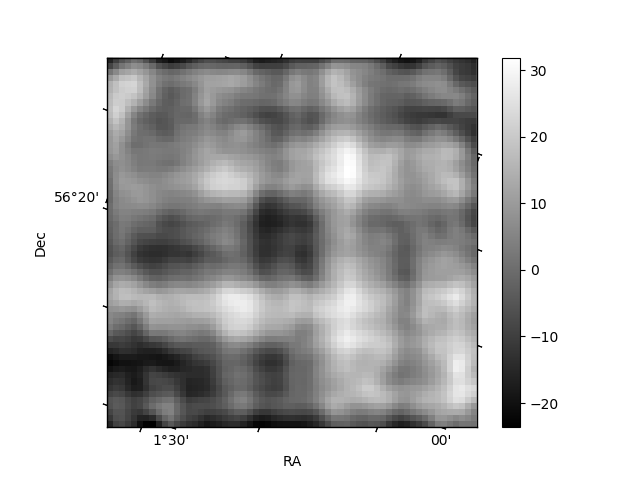
Histogram calculated using DETX and DETY for each event in the final _common_clean file
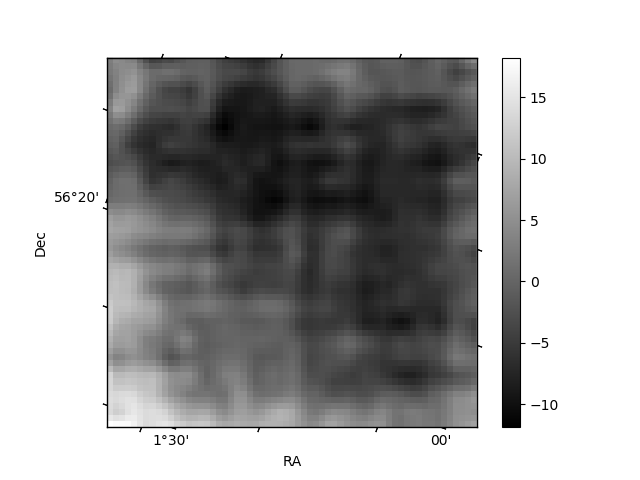
| Quadrant A | 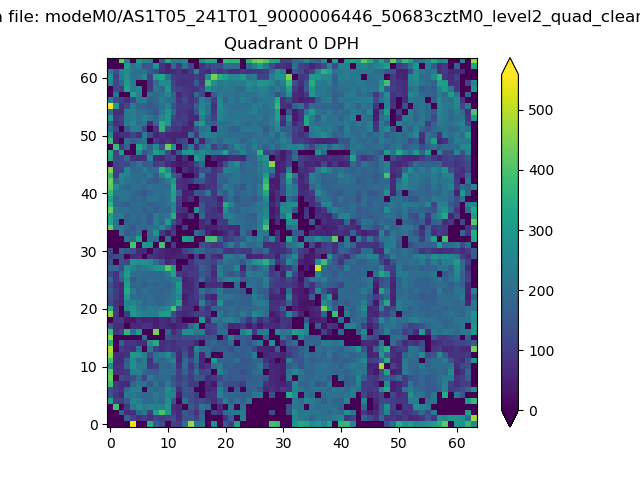 |
 |
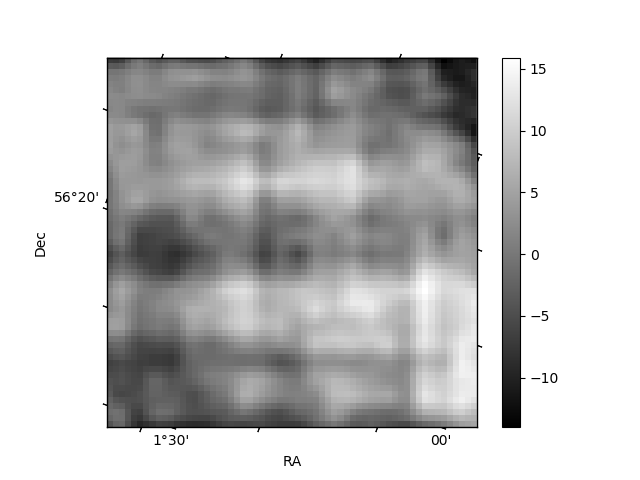
Quadrant B |
|---|---|---|---|
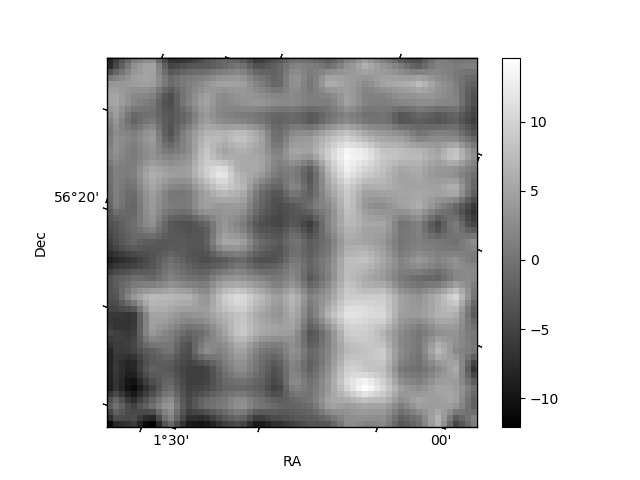
| Quadrant D | 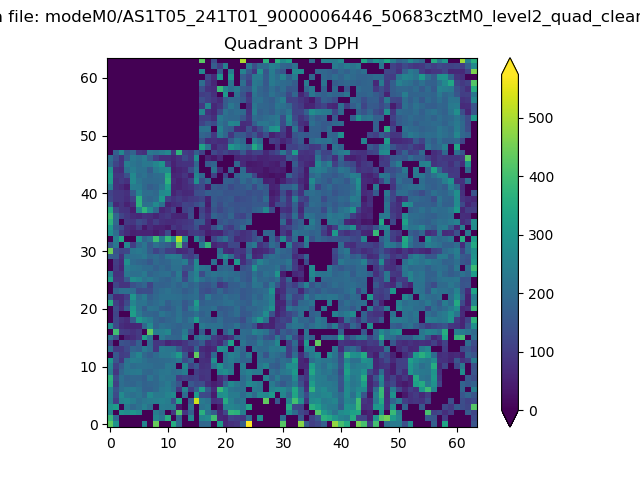 |
 |
Quadrant C |
| Plot type | Count rate plots | Images |
|---|---|---|
| Comparison with Poisson distribution Blue bars denote a histogram of data divided into 1 sec bins. Red curve is a Poisson curve with rate = median count rate of data. |
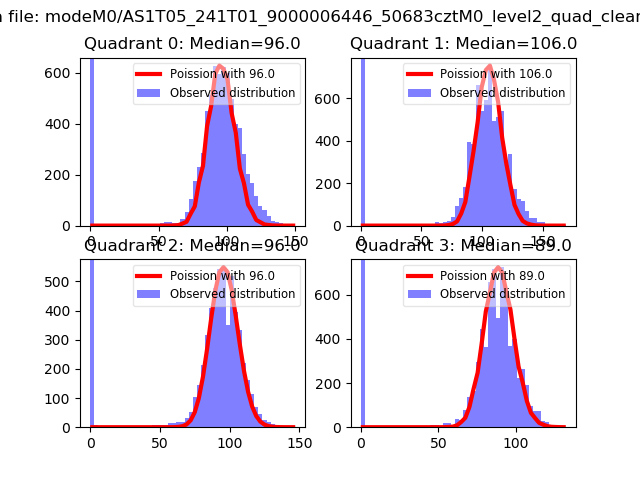 |
 |
| Quadrant-wise count rates Data is divided into 100 sec bins |
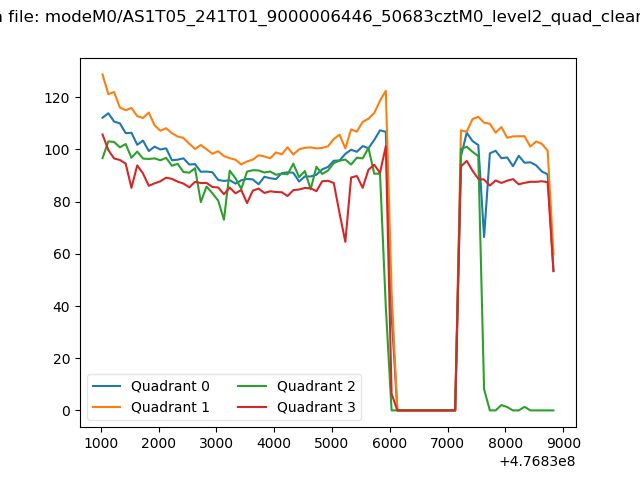 |
|
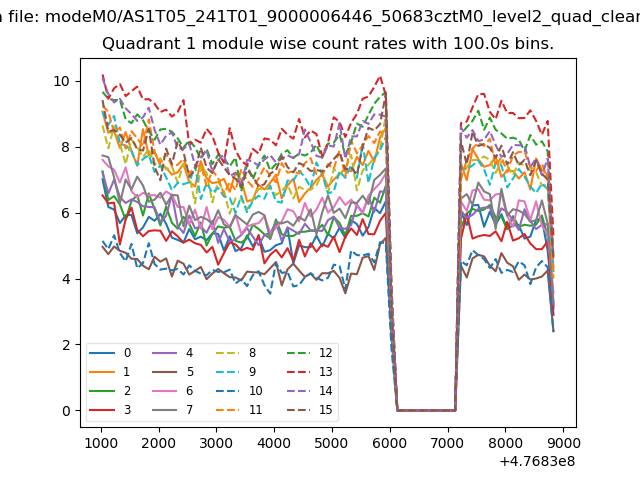
| Module-wise count rates for Quadrant A Data is divided into 100 sec bins |
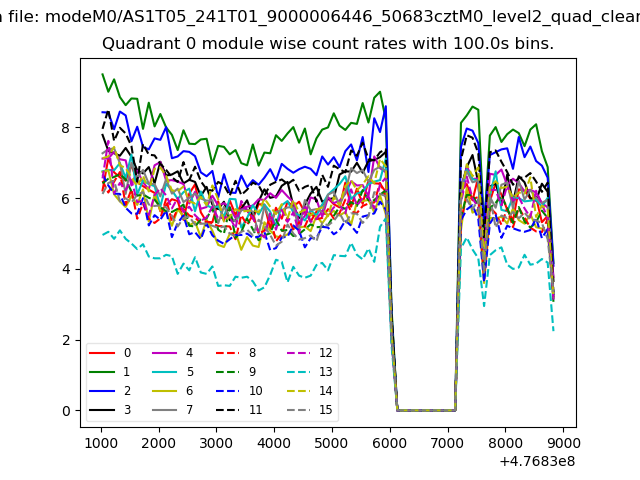 |
 |
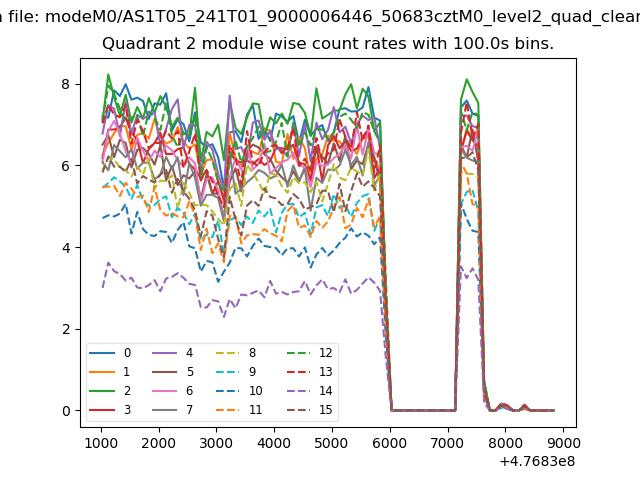
| Module-wise count rates for Quadrant B Data is divided into 100 sec bins |
 |
 |
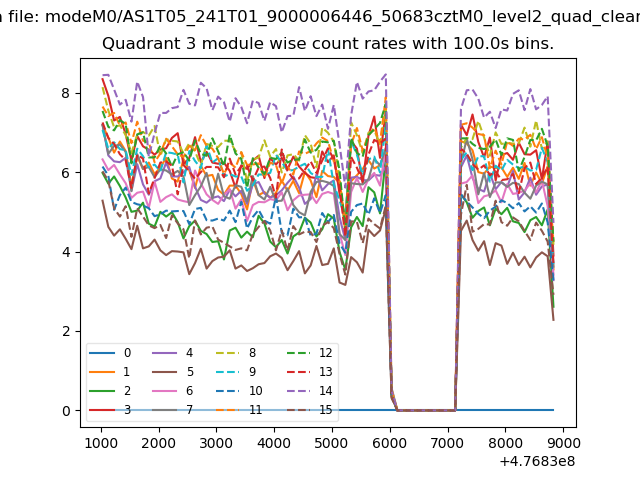
| Module-wise count rates for Quadrant C Data is divided into 100 sec bins |
 |
 |
| Module-wise count rates for Quadrant D Data is divided into 100 sec bins |
 |
 |
| Parameter | Plot |
|---|---|
| CZT HV Monitor | 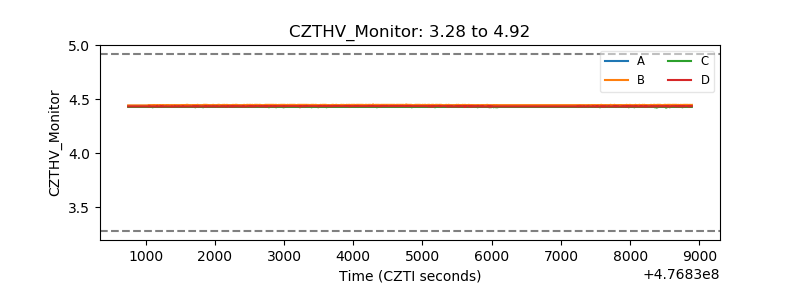 |
| D_VDD | 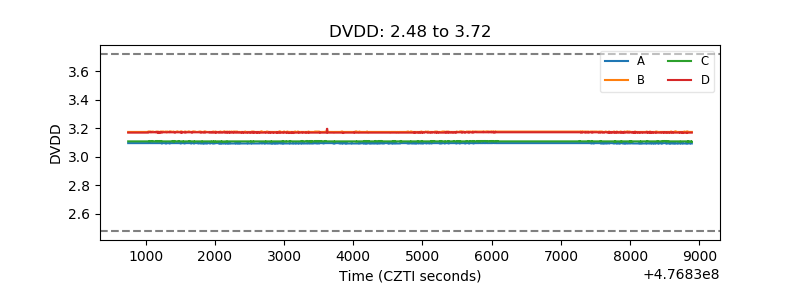 |
| Temperature 1 | 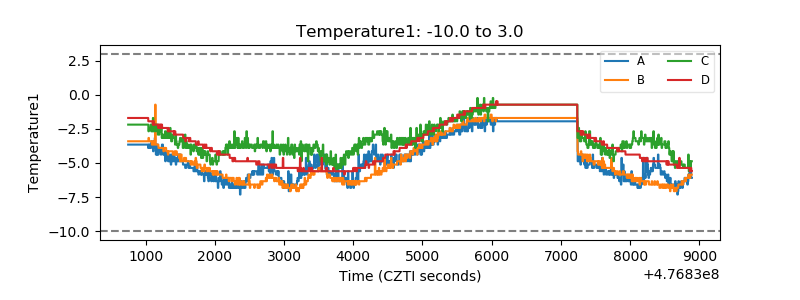 |
| Veto HV Monitor | 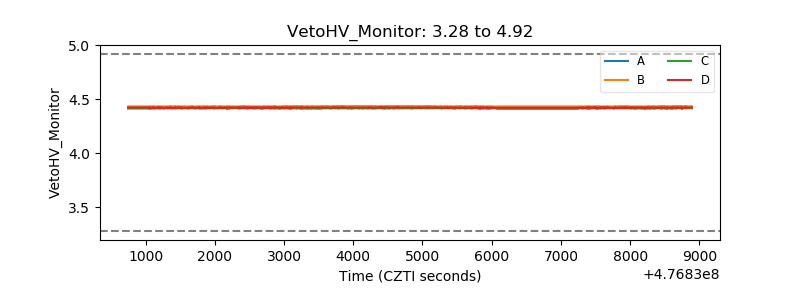 |
| Veto LLD | 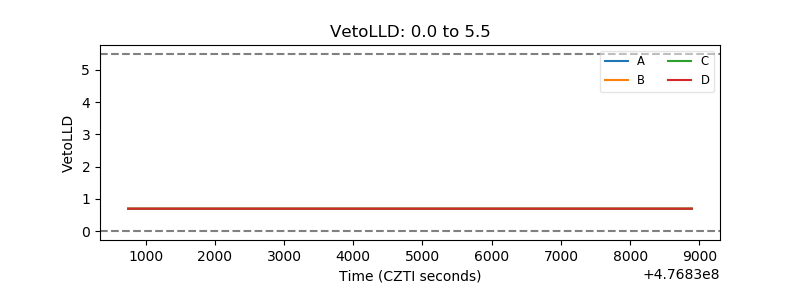 |
| Alpha Counter | 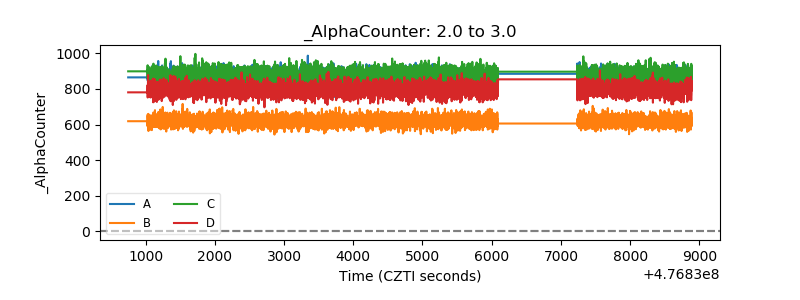 |
| _CPM_Rate | 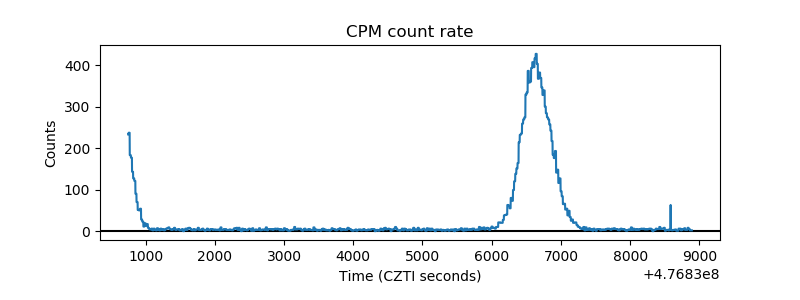 |
| CZT Counter | 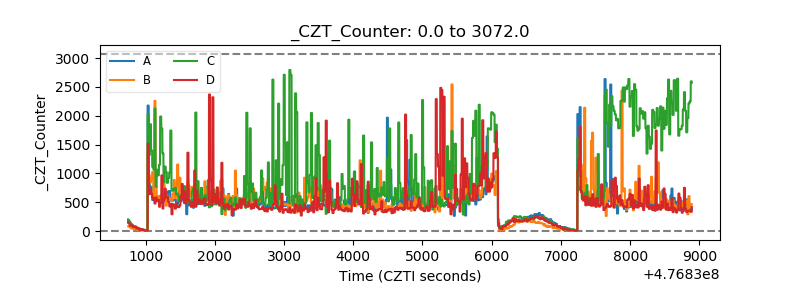 |
| +2.5 Volts monitor | 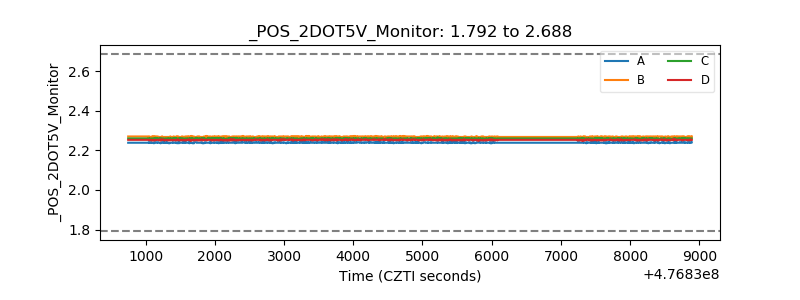 |
| +5 Volts monitor | 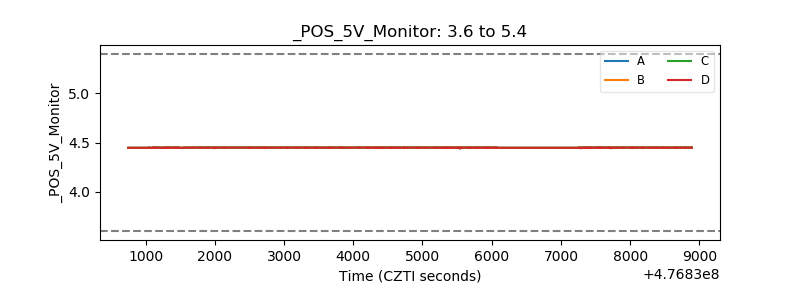 |
| _ROLL_ROT | 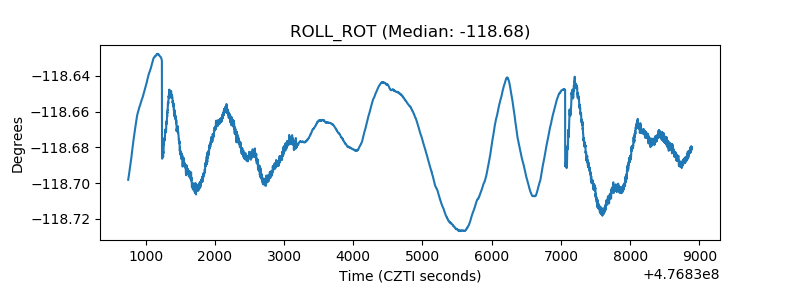 |
| _Roll_DEC | 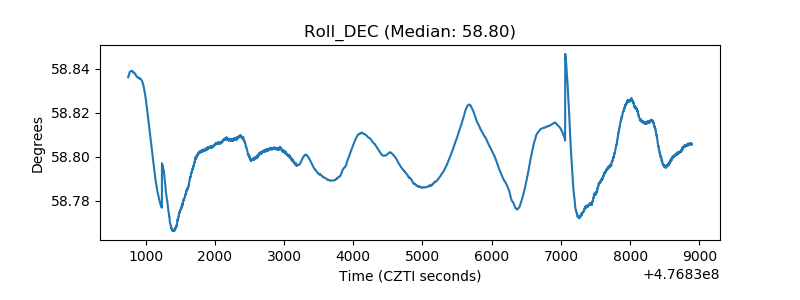 |
| _Roll_RA | 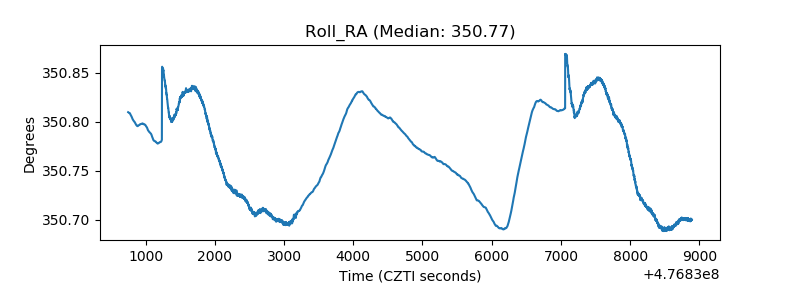 |
| Veto Counter | 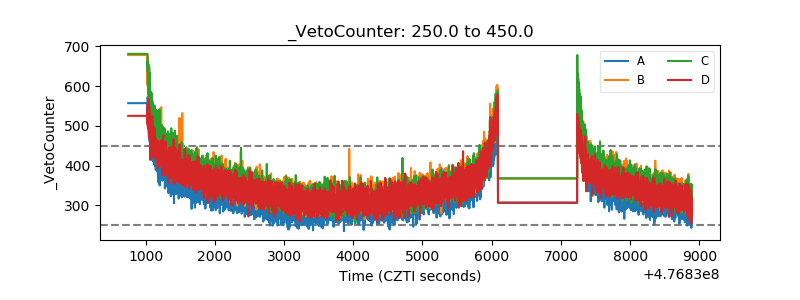 |