| Param | Original file | Final file |
|---|---|---|
| Filename | modeM0/AS1T05_241T01_9000006446_50684cztM0_level2.fits | modeM0/AS1T05_241T01_9000006446_50684cztM0_level2_quad_clean.evt |
| Size (bytes) | 685,065,600 | 86,768,640 |
| Size | 653.3 MB | 82.7 MB |
| Events in quadrant A | 3,972,985 | 639,581 |
| Events in quadrant B | 4,813,512 | 688,372 |
| Events in quadrant C | 11,886,670 | 228,072 |
| Events in quadrant D | 4,146,918 | 588,820 |
| Mode M9 | |||
|---|---|---|---|
| Quadrant | BADHDUFLAG | Total packets | Discarded packets |
| A | 0 | 15 | 0 |
| B | 0 | 16 | 0 |
| C | 0 | 16 | 0 |
| D | 0 | 16 | 0 |
| Mode M0 | |||
|---|---|---|---|
| Quadrant | BADHDUFLAG | Total packets | Discarded packets |
| A | 0 | 16581 | 2 |
| B | 0 | 19028 | 2 |
| C | 0 | 40008 | 2 |
| D | 0 | 17640 | 2 |
| Mode SS | |||
|---|---|---|---|
| Quadrant | BADHDUFLAG | Total packets | Discarded packets |
| A | 0 | 140 | 0 |
| B | 0 | 140 | 0 |
| C | 0 | 140 | 0 |
| D | 0 | 140 | 0 |
| Quadrant | Total seconds | Saturated seconds | Saturation percentage |
|---|---|---|---|
| A | 6926 | 182 | 2.627779% |
| B | 6926 | 361 | 5.212244% |
| C | 6926 | 4648 | 67.109443% |
| D | 6925 | 231 | 3.335740% |
Noise dominated data is calculated using 1-second bins in cleaned event files. If a bin has >2000 counts, and if more than 50% of those come from <1% of pixels, then it is considered to be noise-dominated and hence unusable.
| Quadrant | # 1 sec bins | Bins with >0 counts | Bins with >2000 counts | High rate bins dominated by noise | Noise dominated (total time) | Noise dominated (detector-on time) | Marked lightcurve |
|---|---|---|---|---|---|---|---|
| A | 7896 | 6927 | 115 | 115 | 1.46% | 1.66% | 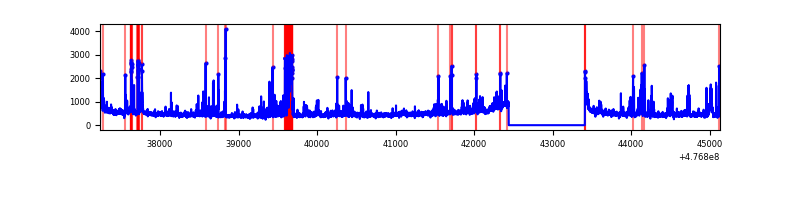 |
| B | 7896 | 6927 | 220 | 220 | 2.79% | 3.18% | 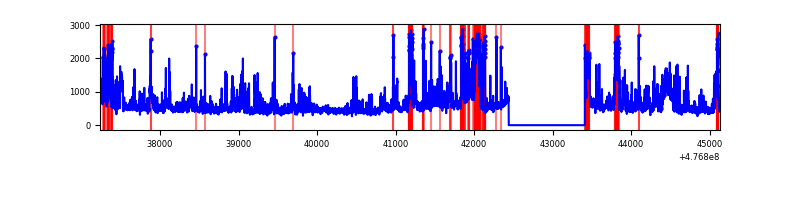 |
| C | 7896 | 6926 | 3530 | 3530 | 44.71% | 50.97% | 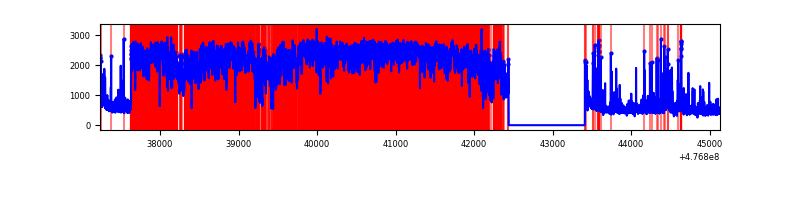 |
| D | 7895 | 6925 | 190 | 190 | 2.41% | 2.74% | 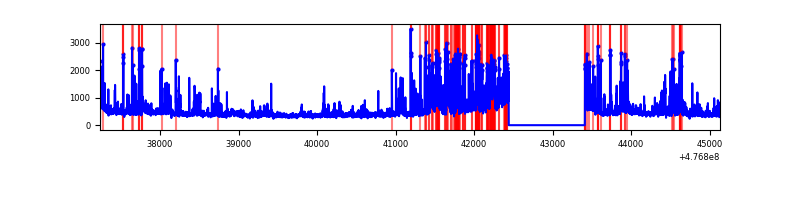 |
Top three noisy pixels from each quadrant. If the there are fewer than three noisy pixels in the level2.evt file, extra rows are filled as -1
| Pixel properties | Quadrant properties | ||||||
|---|---|---|---|---|---|---|---|
| Quadrant | DetID | PixID | Counts | Sigma | Mean | Median | Sigma |
| A | 3 | 46 | 265616 | 1494.63 | 721 | 703 | 177.2 |
| A | 4 | 3 | 238495 | 1341.62 | 721 | 703 | 177.2 |
| A | 5 | 240 | 98114 | 549.59 | 721 | 703 | 177.2 |
| B | 4 | 170 | 1009889 | 6583.47 | 716 | 690 | 153.3 |
| B | 0 | 229 | 285498 | 1857.93 | 716 | 690 | 153.3 |
| B | 2 | 249 | 90348 | 584.88 | 716 | 690 | 153.3 |
| C | 1 | 44 | 9030280 | 84410.19 | 380 | 378 | 107.0 |
| C | 15 | 174 | 397807 | 3715.11 | 380 | 378 | 107.0 |
| C | 13 | 113 | 181116 | 1689.51 | 380 | 378 | 107.0 |
| D | 7 | 110 | 295472 | 1518.68 | 701 | 676 | 194.1 |
| D | 2 | 249 | 179387 | 920.65 | 701 | 676 | 194.1 |
| D | 7 | 96 | 157390 | 807.33 | 701 | 676 | 194.1 |
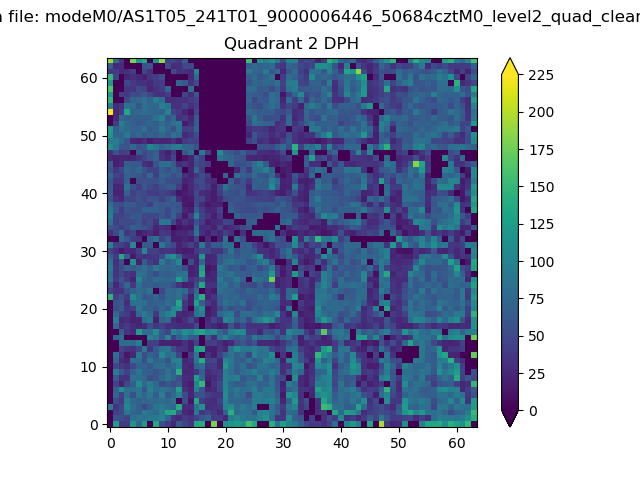
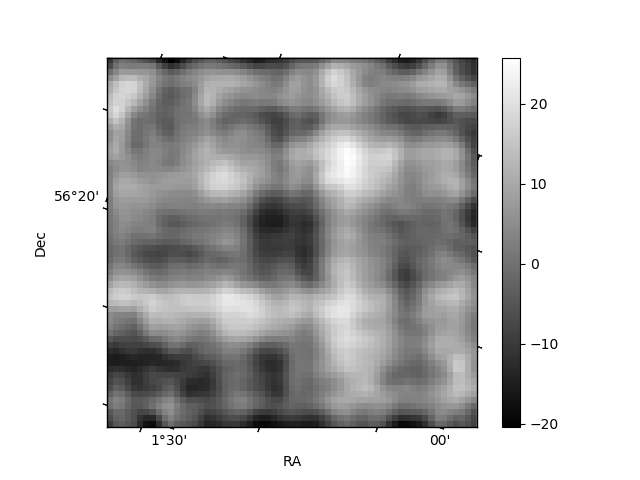
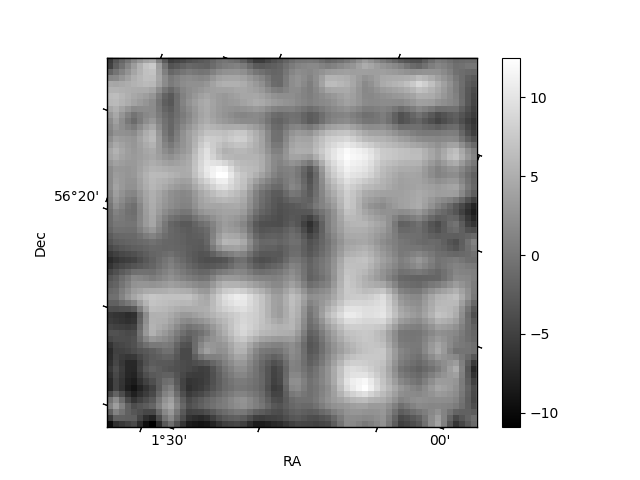
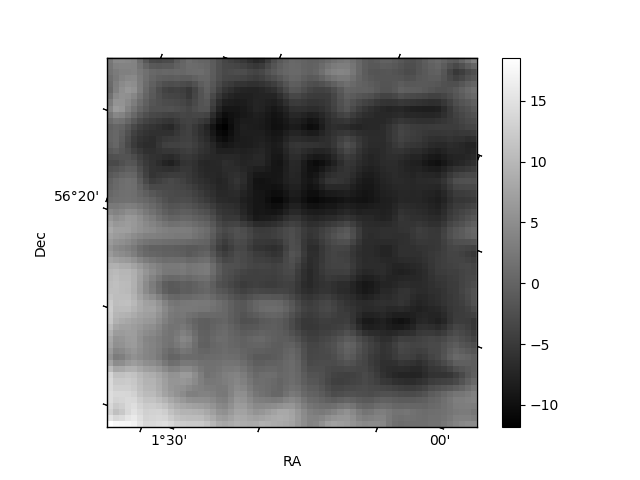
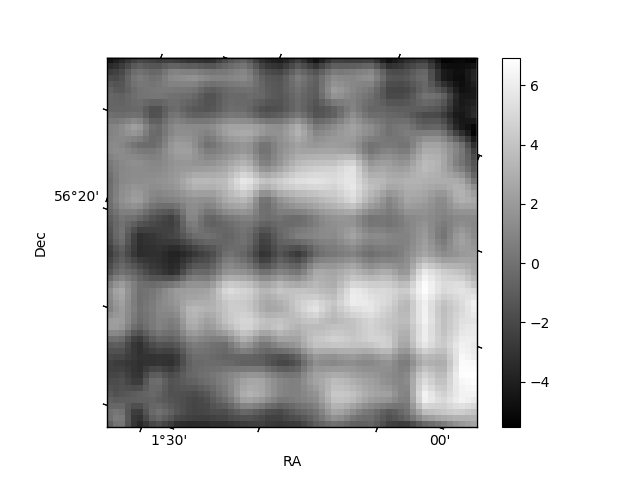
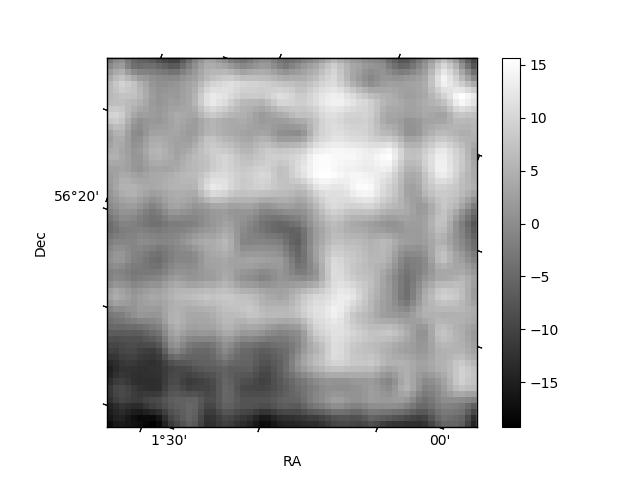
Histogram calculated using DETX and DETY for each event in the final _common_clean file
| Quadrant A | 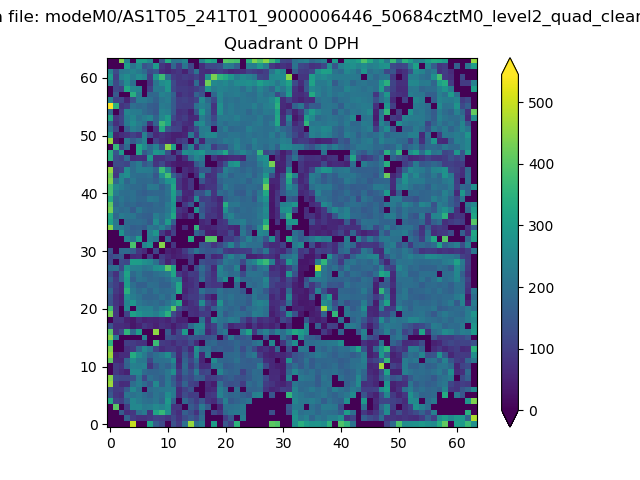 |
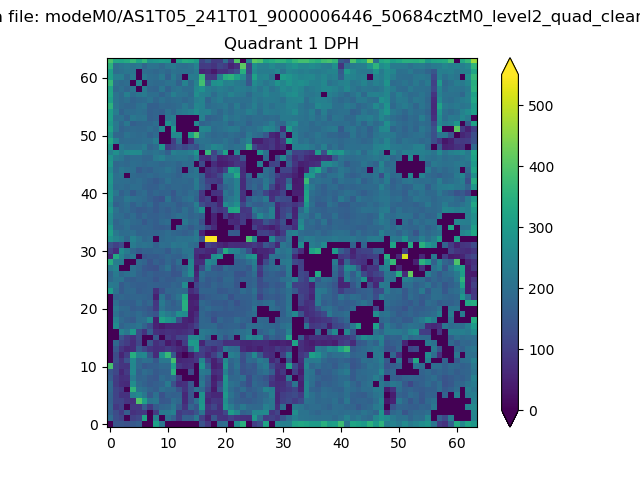 |
Quadrant B |
|---|---|---|---|
| Quadrant D | 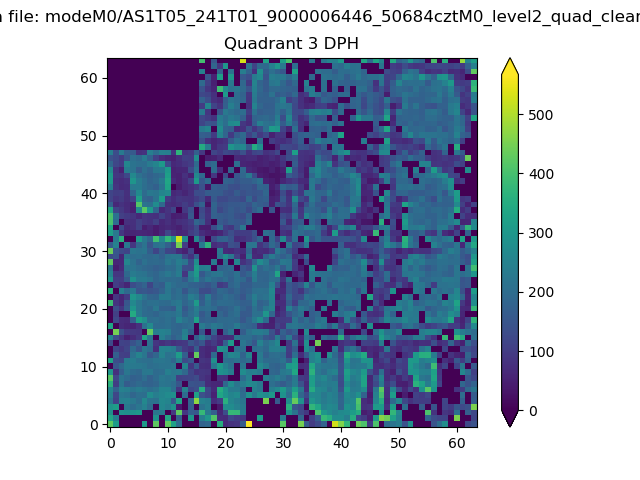 |
 |
Quadrant C |
| Plot type | Count rate plots | Images |
|---|---|---|
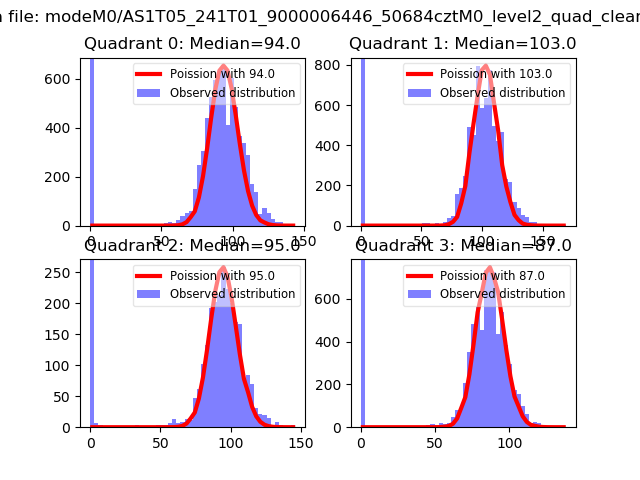
| Comparison with Poisson distribution Blue bars denote a histogram of data divided into 1 sec bins. Red curve is a Poisson curve with rate = median count rate of data. |
 |
 |
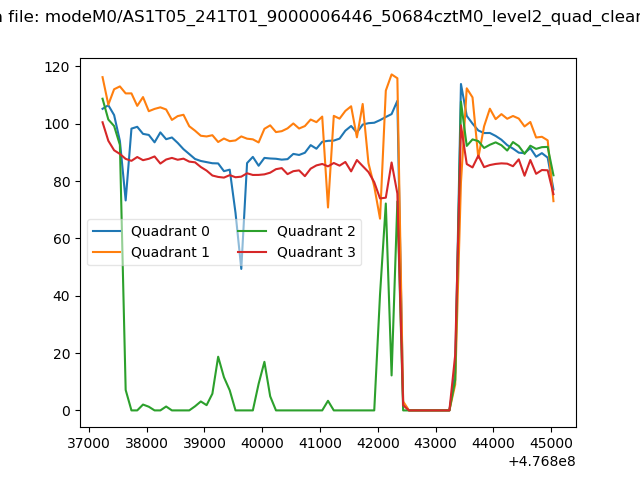
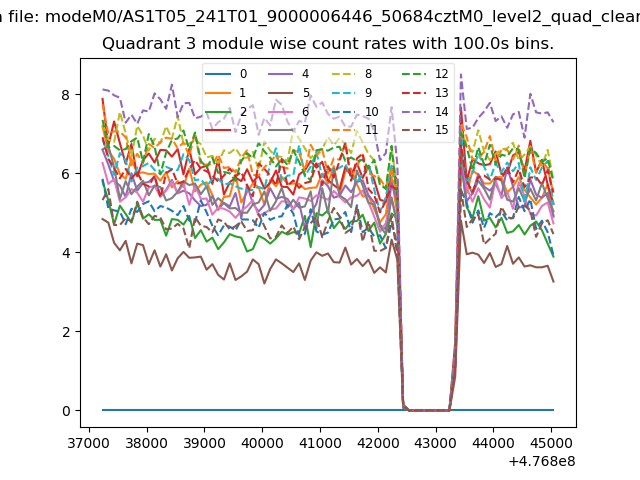
| Quadrant-wise count rates Data is divided into 100 sec bins |
 |
|
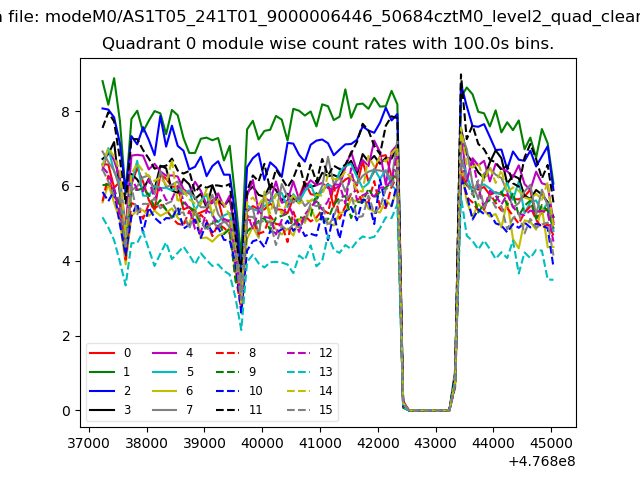
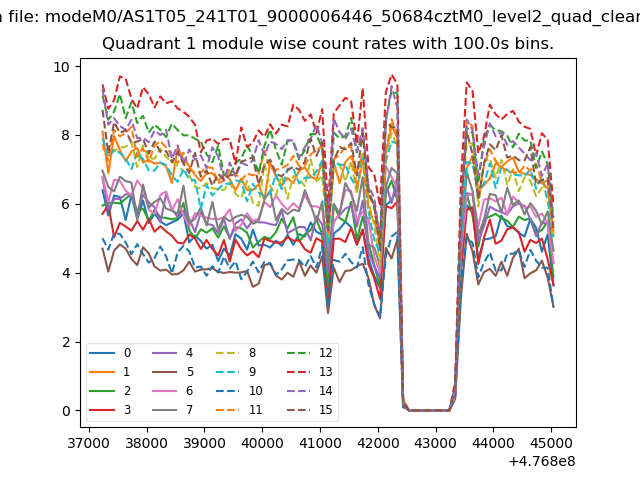
| Module-wise count rates for Quadrant A Data is divided into 100 sec bins |
 |
 |
| Module-wise count rates for Quadrant B Data is divided into 100 sec bins |
 |
 |
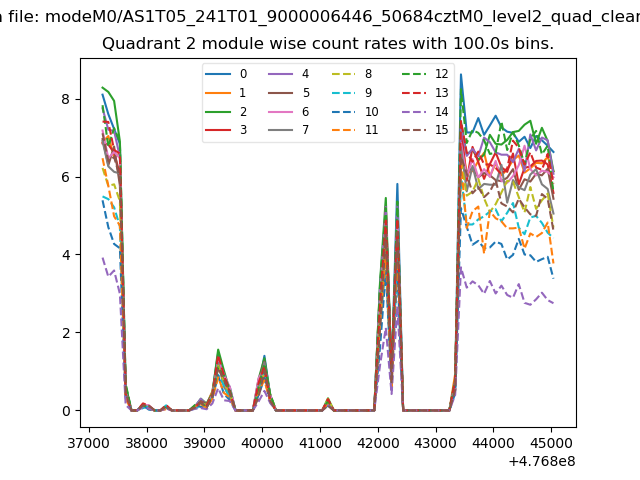
| Module-wise count rates for Quadrant C Data is divided into 100 sec bins |
 |
 |
| Module-wise count rates for Quadrant D Data is divided into 100 sec bins |
 |
 |
| Parameter | Plot |
|---|---|
| CZT HV Monitor | 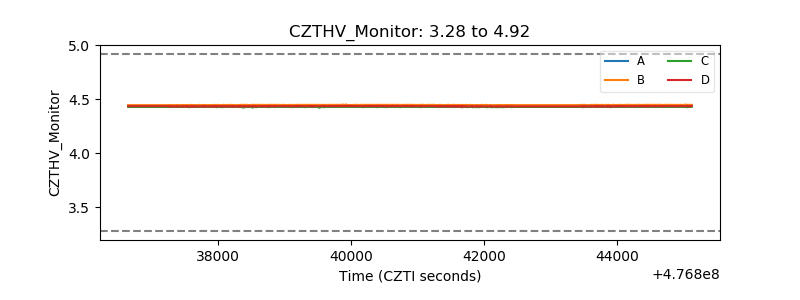 |
| D_VDD | 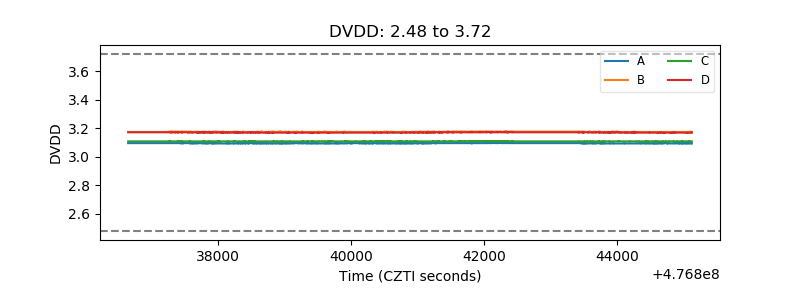 |
| Temperature 1 | 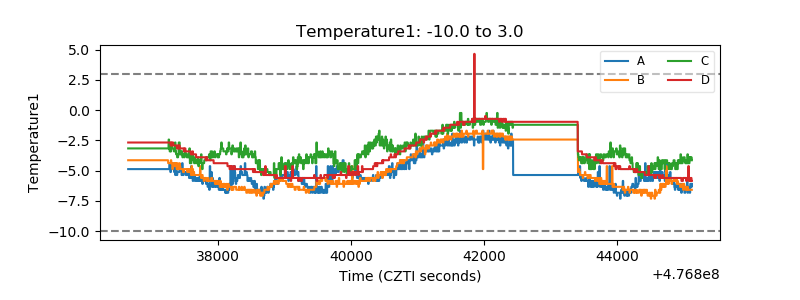 |
| Veto HV Monitor | 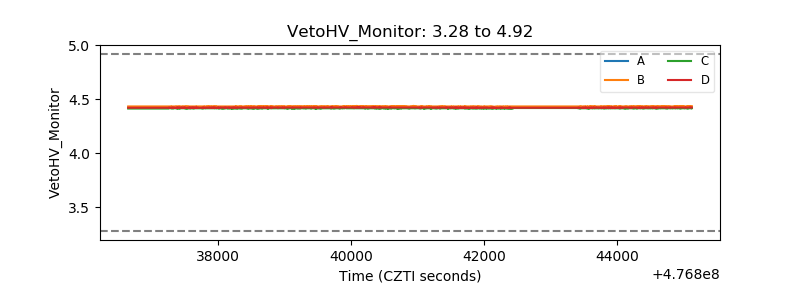 |
| Veto LLD | 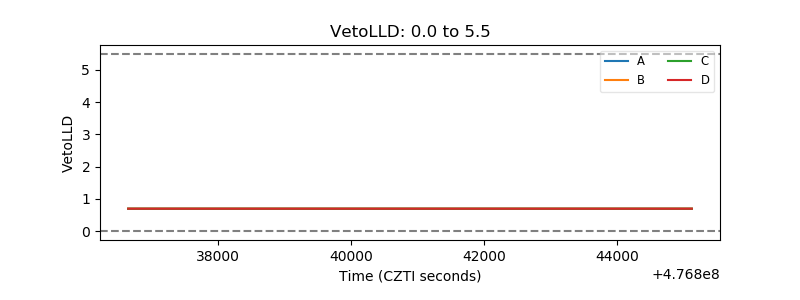 |
| Alpha Counter | 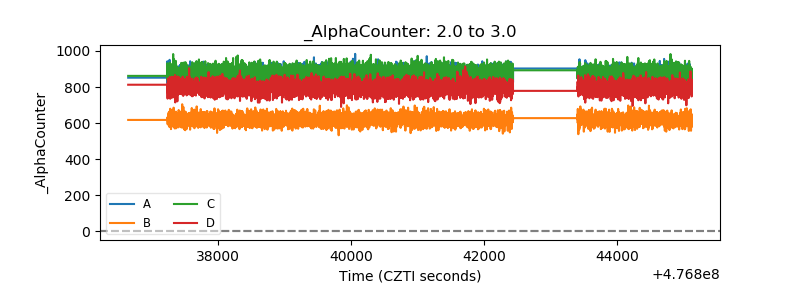 |
| _CPM_Rate | 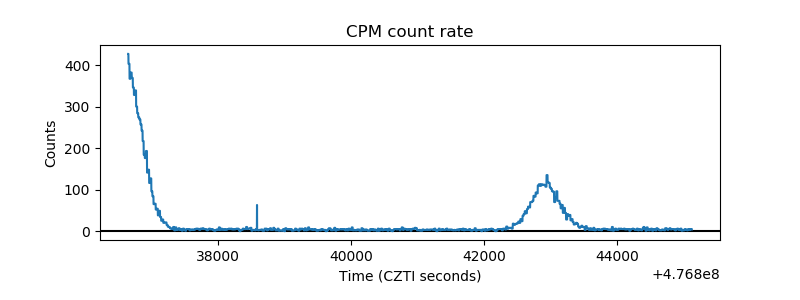 |
| CZT Counter | 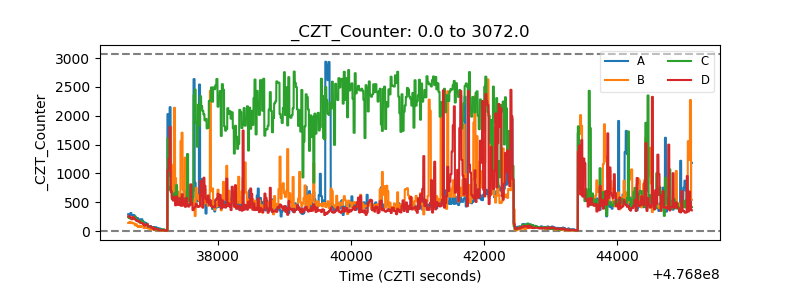 |
| +2.5 Volts monitor | 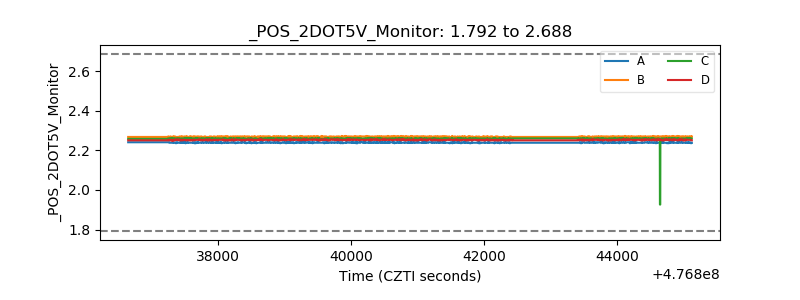 |
| +5 Volts monitor | 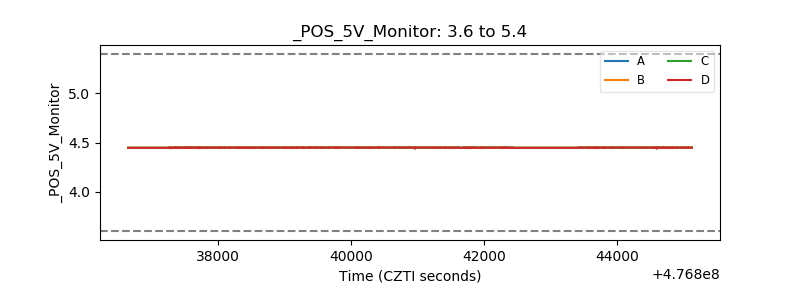 |
| _ROLL_ROT | 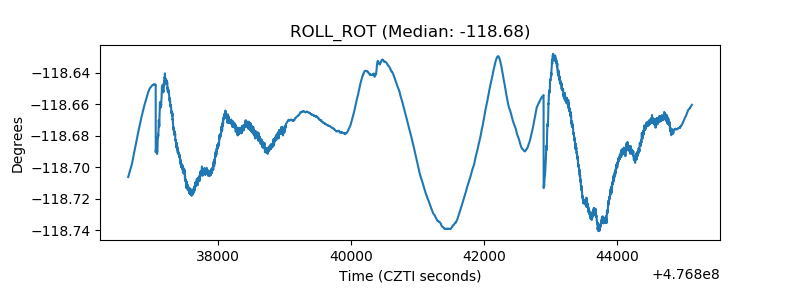 |
| _Roll_DEC | 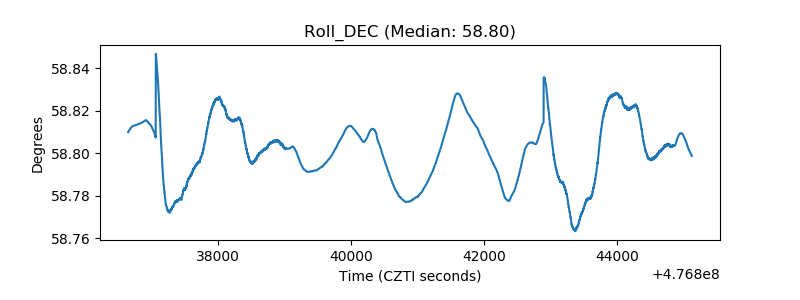 |
| _Roll_RA | 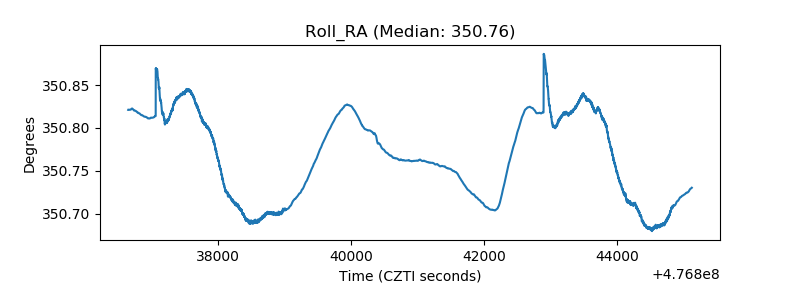 |
| Veto Counter | 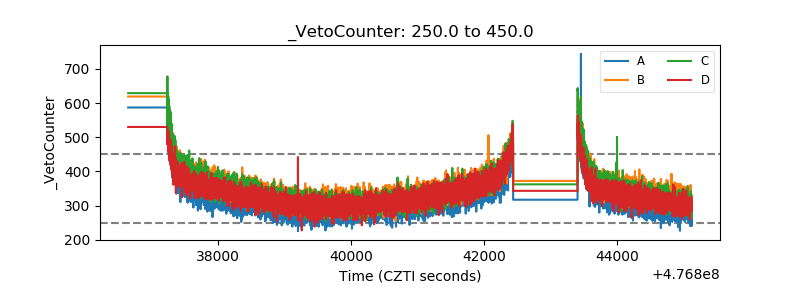 |