| Param | Original file | Final file |
|---|---|---|
| Filename | modeM0/AS1T05_241T01_9000006446_50685cztM0_level2.fits | modeM0/AS1T05_241T01_9000006446_50685cztM0_level2_quad_clean.evt |
| Size (bytes) | 616,668,480 | 102,562,560 |
| Size | 588.1 MB | 97.8 MB |
| Events in quadrant A | 5,977,873 | 622,155 |
| Events in quadrant B | 5,403,604 | 727,689 |
| Events in quadrant C | 5,780,727 | 629,468 |
| Events in quadrant D | 5,094,282 | 613,453 |
| Mode M9 | |||
|---|---|---|---|
| Quadrant | BADHDUFLAG | Total packets | Discarded packets |
| A | 0 | 9 | 0 |
| B | 0 | 10 | 0 |
| C | 0 | 10 | 0 |
| D | 0 | 10 | 0 |
| Mode M0 | |||
|---|---|---|---|
| Quadrant | BADHDUFLAG | Total packets | Discarded packets |
| A | 0 | 22836 | 2 |
| B | 0 | 21161 | 2 |
| C | 0 | 22324 | 2 |
| D | 0 | 20648 | 2 |
| Mode SS | |||
|---|---|---|---|
| Quadrant | BADHDUFLAG | Total packets | Discarded packets |
| A | 0 | 150 | 0 |
| B | 0 | 150 | 0 |
| C | 0 | 150 | 0 |
| D | 0 | 150 | 0 |
| Quadrant | Total seconds | Saturated seconds | Saturation percentage |
|---|---|---|---|
| A | 7363 | 761 | 10.335461% |
| B | 7363 | 357 | 4.848567% |
| C | 7363 | 657 | 8.922993% |
| D | 7363 | 343 | 4.658427% |
Noise dominated data is calculated using 1-second bins in cleaned event files. If a bin has >2000 counts, and if more than 50% of those come from <1% of pixels, then it is considered to be noise-dominated and hence unusable.
| Quadrant | # 1 sec bins | Bins with >0 counts | Bins with >2000 counts | High rate bins dominated by noise | Noise dominated (total time) | Noise dominated (detector-on time) | Marked lightcurve |
|---|---|---|---|---|---|---|---|
| A | 7853 | 7363 | 494 | 494 | 6.29% | 6.71% | 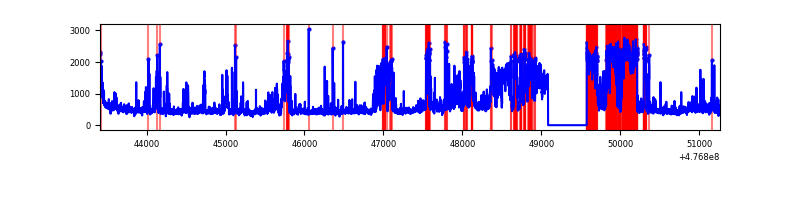 |
| B | 7853 | 7363 | 132 | 132 | 1.68% | 1.79% | 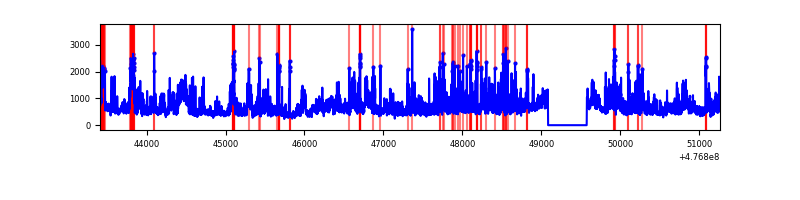 |
| C | 7853 | 7363 | 462 | 462 | 5.88% | 6.27% | 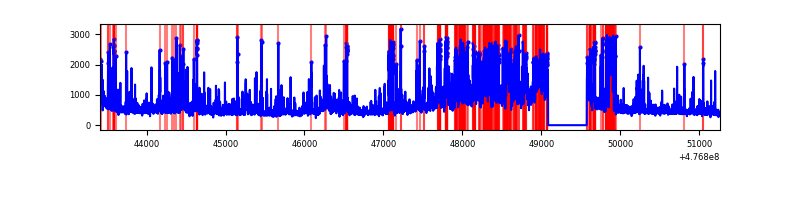 |
| D | 7853 | 7364 | 283 | 283 | 3.60% | 3.84% | 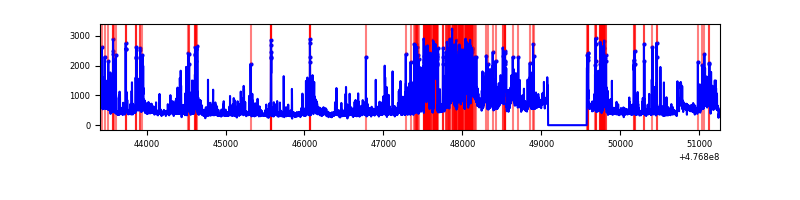 |
Top three noisy pixels from each quadrant. If the there are fewer than three noisy pixels in the level2.evt file, extra rows are filled as -1
| Pixel properties | Quadrant properties | ||||||
|---|---|---|---|---|---|---|---|
| Quadrant | DetID | PixID | Counts | Sigma | Mean | Median | Sigma |
| A | 12 | 80 | 2033687 | 10694.55 | 759 | 740 | 190.1 |
| A | 4 | 3 | 184665 | 967.56 | 759 | 740 | 190.1 |
| A | 9 | 191 | 136428 | 713.8 | 759 | 740 | 190.1 |
| B | 4 | 170 | 1042926 | 6355.19 | 771 | 741 | 164.0 |
| B | 0 | 229 | 533959 | 3251.53 | 771 | 741 | 164.0 |
| B | 10 | 247 | 302442 | 1839.76 | 771 | 741 | 164.0 |
| C | 4 | 5 | 501383 | 2458.07 | 742 | 736 | 203.7 |
| C | 13 | 113 | 498826 | 2445.52 | 742 | 736 | 203.7 |
| C | 14 | 254 | 386979 | 1896.37 | 742 | 736 | 203.7 |
| D | 7 | 96 | 415151 | 2003.2 | 747 | 719 | 206.9 |
| D | 7 | 110 | 383546 | 1850.43 | 747 | 719 | 206.9 |
| D | 3 | 12 | 203753 | 981.38 | 747 | 719 | 206.9 |
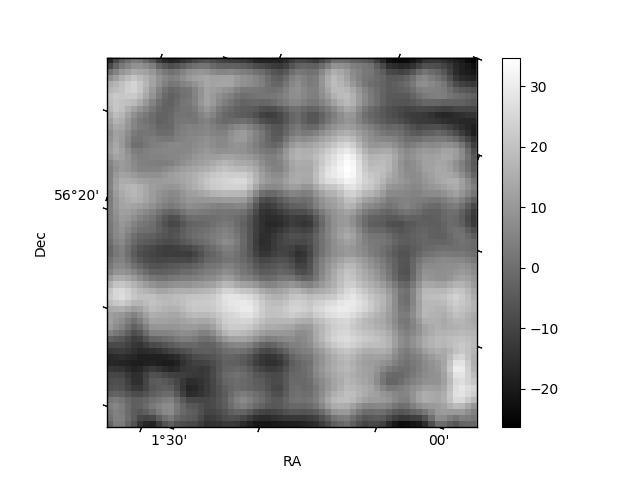
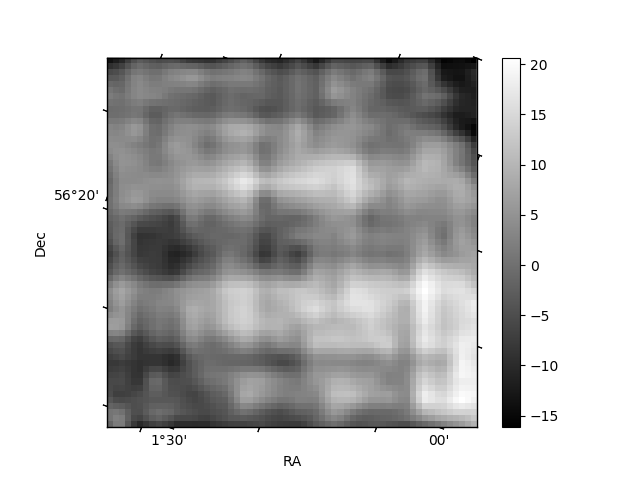
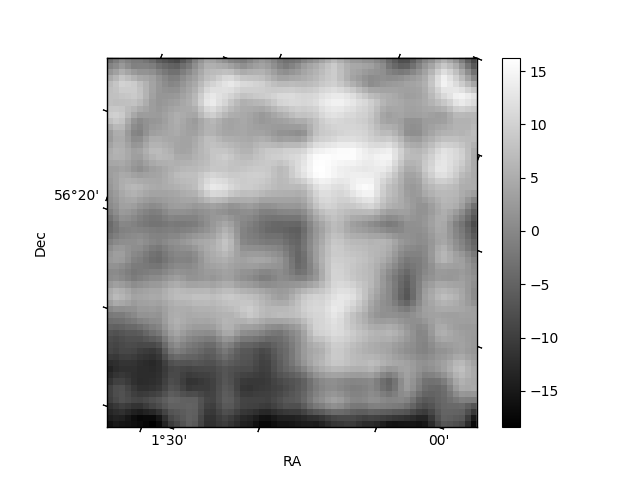
Histogram calculated using DETX and DETY for each event in the final _common_clean file
| Quadrant A | 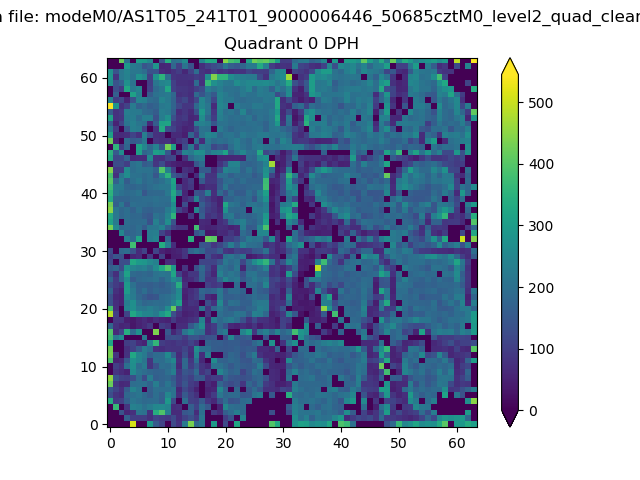 |
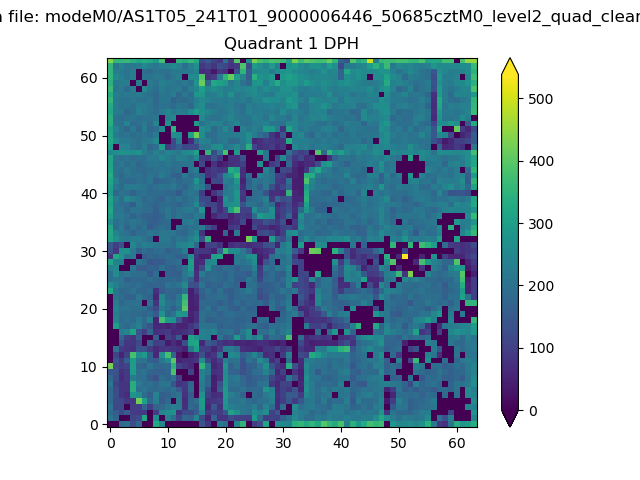 |
Quadrant B |
|---|---|---|---|
| Quadrant D | 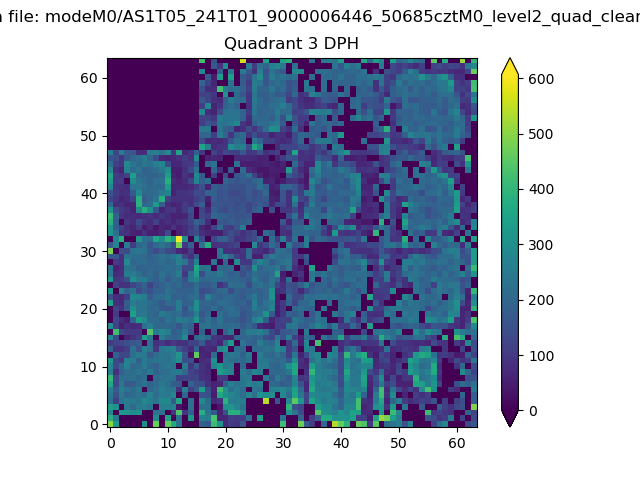 |
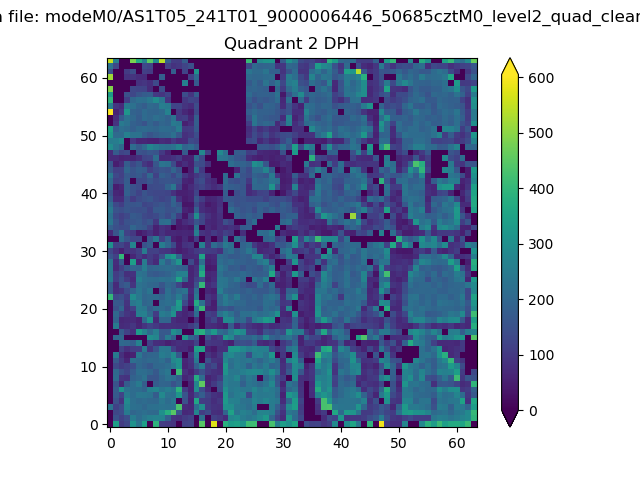 |
Quadrant C |
| Plot type | Count rate plots | Images |
|---|---|---|
| Comparison with Poisson distribution Blue bars denote a histogram of data divided into 1 sec bins. Red curve is a Poisson curve with rate = median count rate of data. |
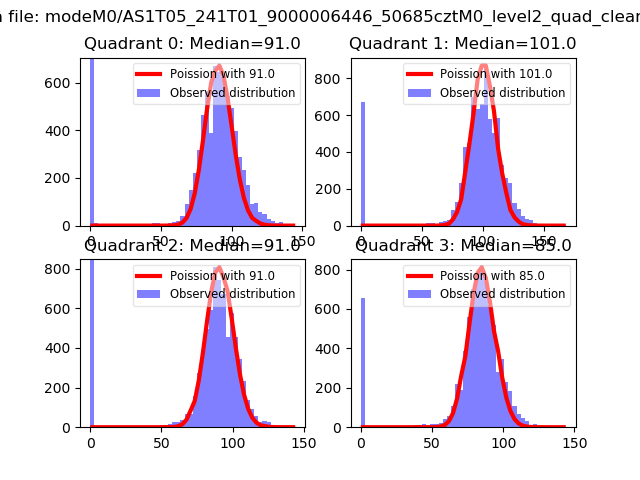 |
 |
| Quadrant-wise count rates Data is divided into 100 sec bins |
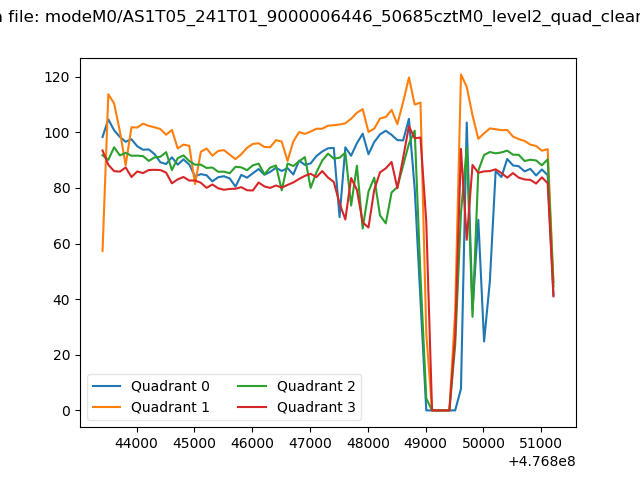 |
|
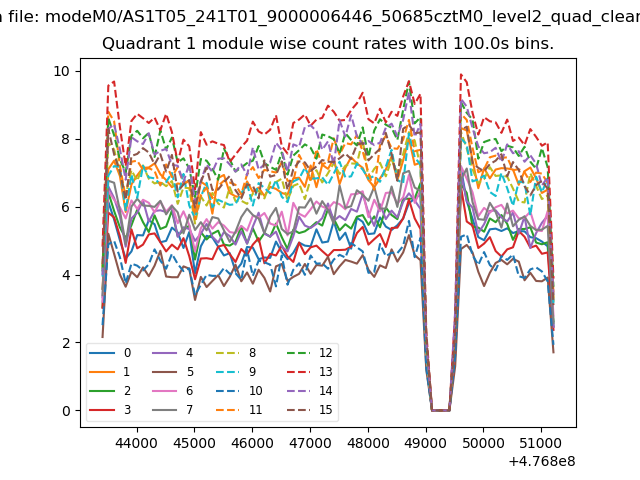
| Module-wise count rates for Quadrant A Data is divided into 100 sec bins |
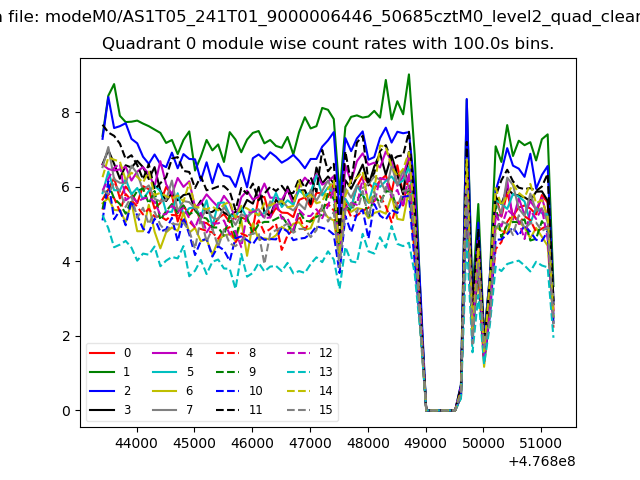 |
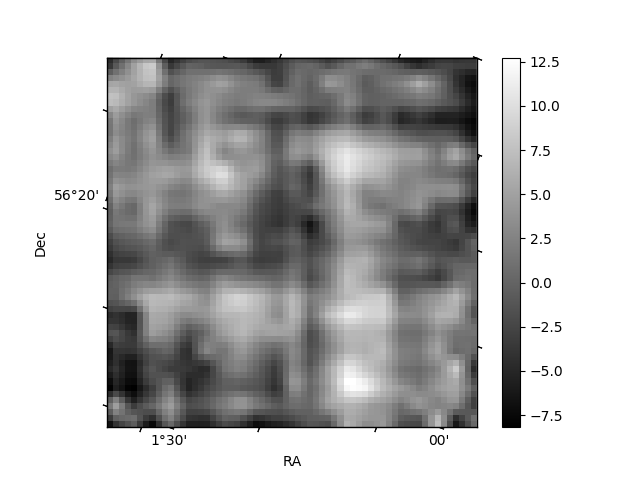 |
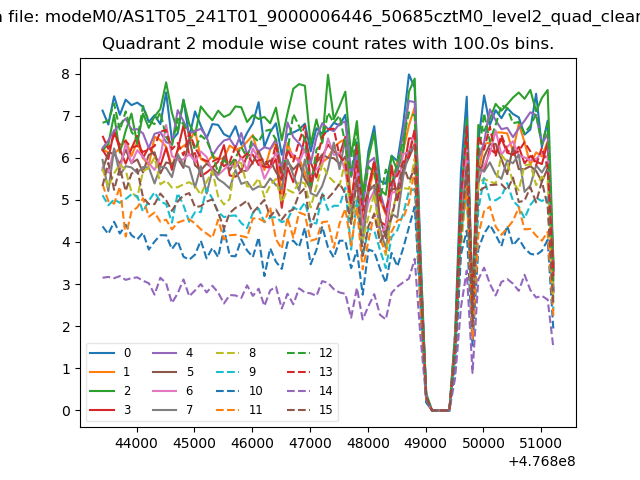
| Module-wise count rates for Quadrant B Data is divided into 100 sec bins |
 |
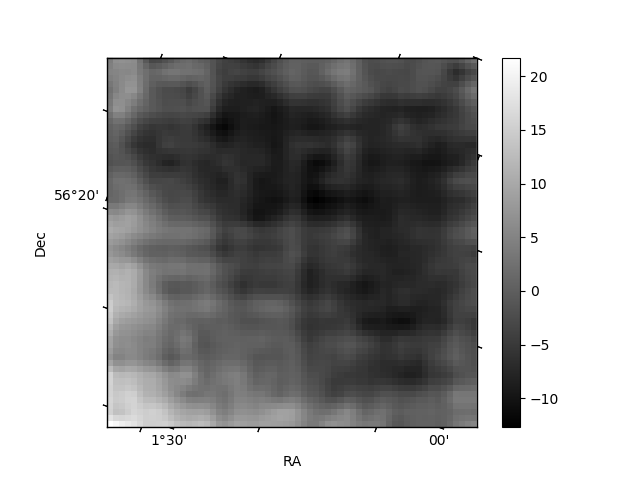 |
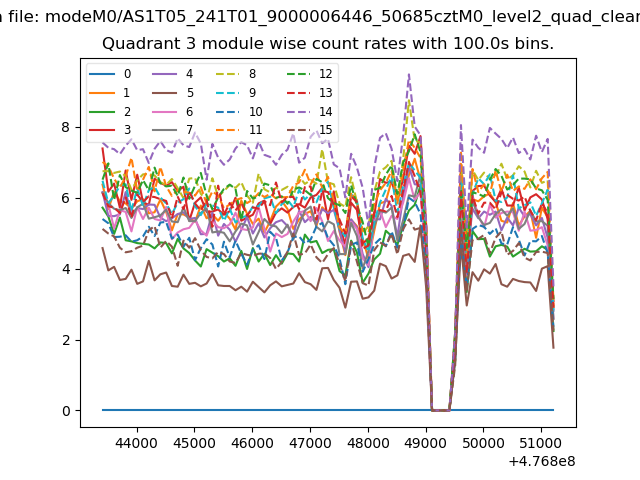
| Module-wise count rates for Quadrant C Data is divided into 100 sec bins |
 |
 |
| Module-wise count rates for Quadrant D Data is divided into 100 sec bins |
 |
 |
| Parameter | Plot |
|---|---|
| CZT HV Monitor | 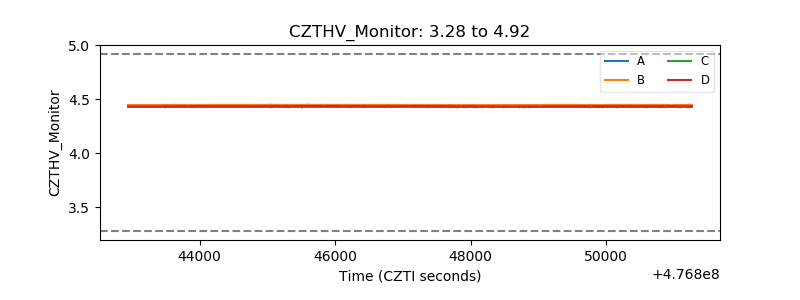 |
| D_VDD | 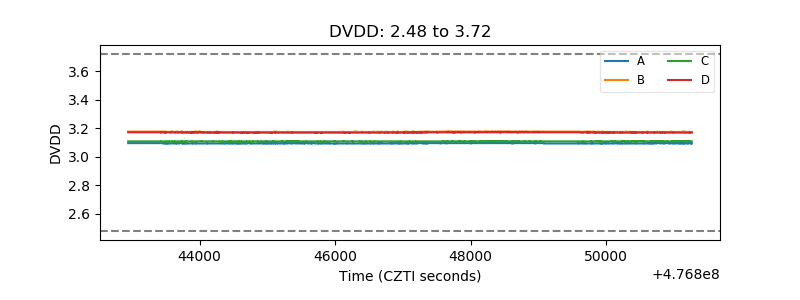 |
| Temperature 1 | 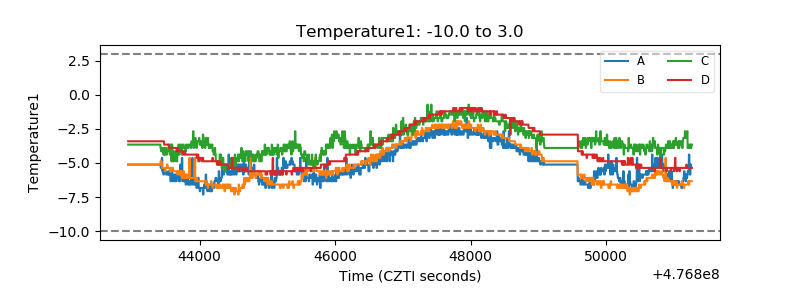 |
| Veto HV Monitor | 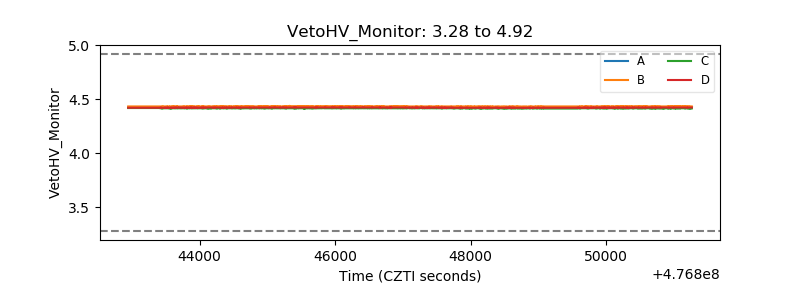 |
| Veto LLD | 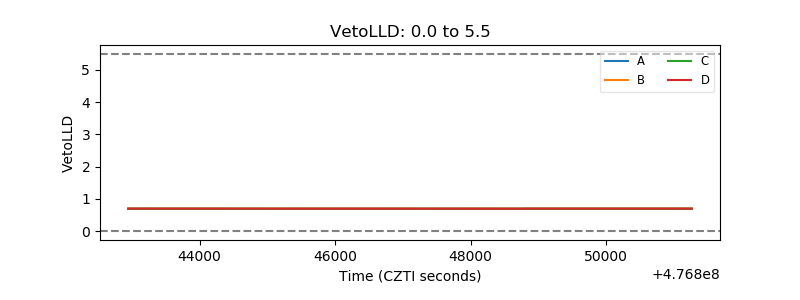 |
| Alpha Counter | 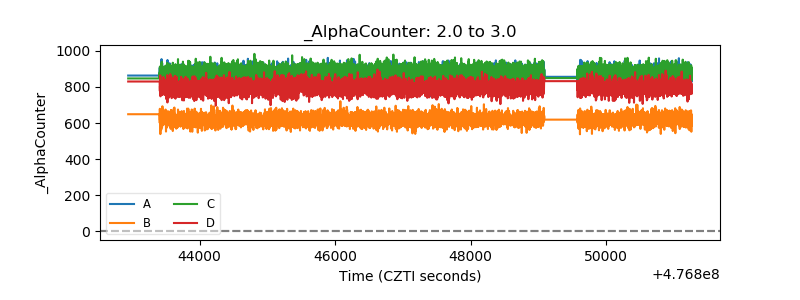 |
| _CPM_Rate | 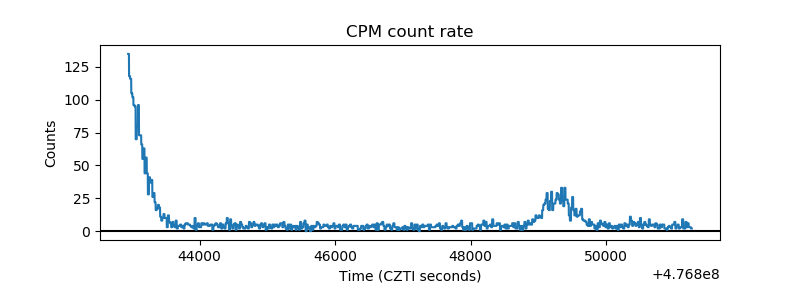 |
| CZT Counter | 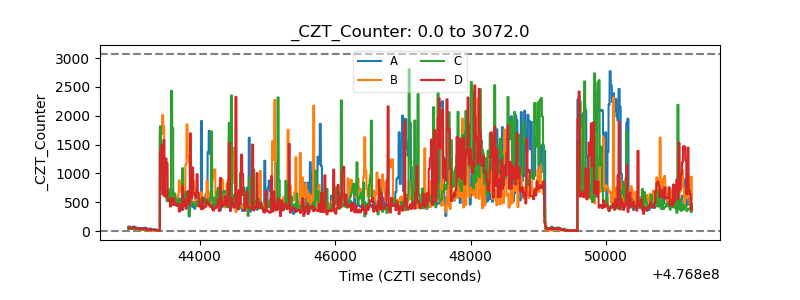 |
| +2.5 Volts monitor | 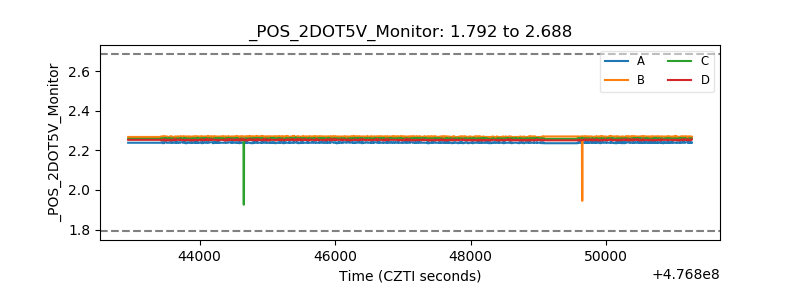 |
| +5 Volts monitor | 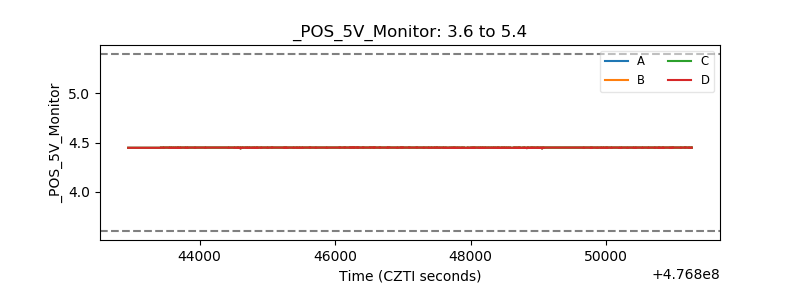 |
| _ROLL_ROT | 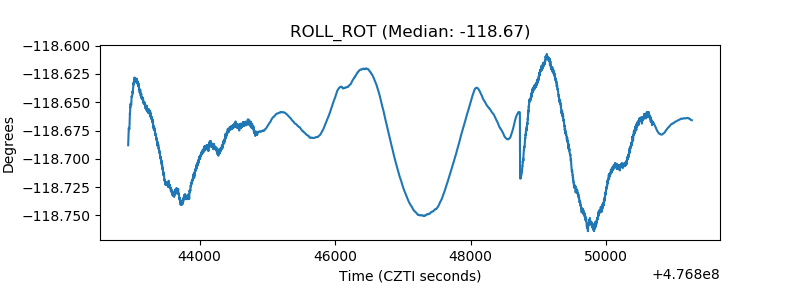 |
| _Roll_DEC | 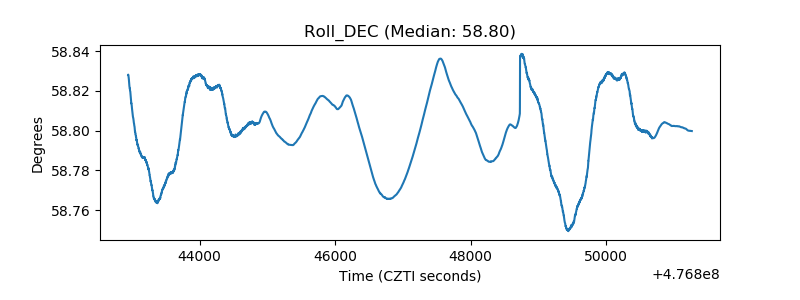 |
| _Roll_RA | 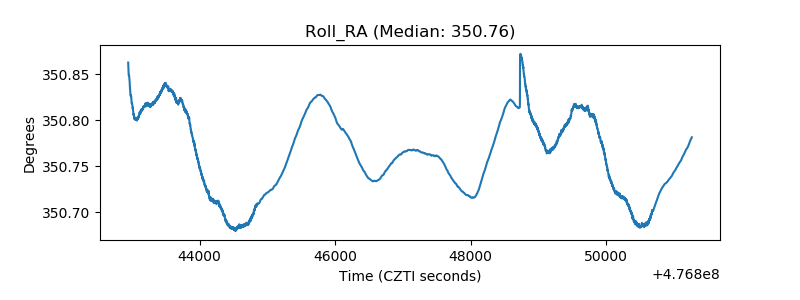 |
| Veto Counter | 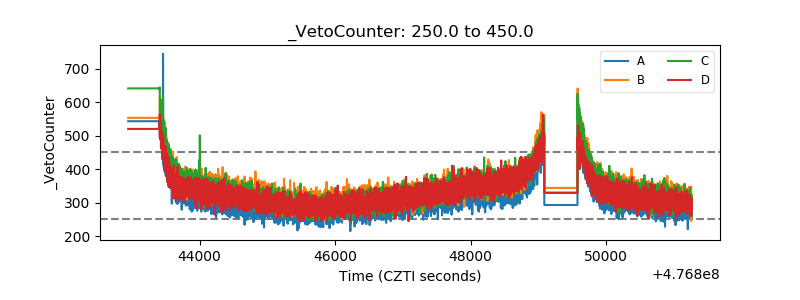 |