| Param | Original file | Final file |
|---|---|---|
| Filename | modeM0/AS1T05_241T01_9000006446_50687cztM0_level2.fits | modeM0/AS1T05_241T01_9000006446_50687cztM0_level2_quad_clean.evt |
| Size (bytes) | 701,326,080 | 91,108,800 |
| Size | 668.8 MB | 86.9 MB |
| Events in quadrant A | 5,955,300 | 616,287 |
| Events in quadrant B | 5,369,733 | 627,821 |
| Events in quadrant C | 7,633,443 | 528,387 |
| Events in quadrant D | 6,484,632 | 518,849 |
| Mode M0 | |||
|---|---|---|---|
| Quadrant | BADHDUFLAG | Total packets | Discarded packets |
| A | 0 | 22408 | 10 |
| B | 0 | 20578 | 4 |
| C | 0 | 27387 | 6 |
| D | 0 | 24031 | 1 |
| Mode SS | |||
|---|---|---|---|
| Quadrant | BADHDUFLAG | Total packets | Discarded packets |
| A | 0 | 134 | 0 |
| B | 0 | 134 | 0 |
| C | 0 | 134 | 0 |
| D | 0 | 134 | 0 |
| Quadrant | Total seconds | Saturated seconds | Saturation percentage |
|---|---|---|---|
| A | 6698 | 201 | 3.000896% |
| B | 6700 | 632 | 9.432836% |
| C | 6700 | 1091 | 16.283582% |
| D | 6700 | 769 | 11.477612% |
Noise dominated data is calculated using 1-second bins in cleaned event files. If a bin has >2000 counts, and if more than 50% of those come from <1% of pixels, then it is considered to be noise-dominated and hence unusable.
| Quadrant | # 1 sec bins | Bins with >0 counts | Bins with >2000 counts | High rate bins dominated by noise | Noise dominated (total time) | Noise dominated (detector-on time) | Marked lightcurve |
|---|---|---|---|---|---|---|---|
| A | 6701 | 6700 | 151 | 151 | 2.25% | 2.25% | 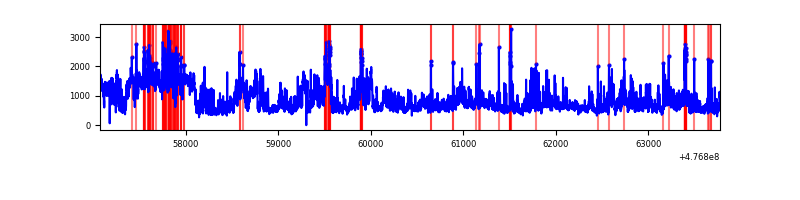 |
| B | 6702 | 6701 | 569 | 569 | 8.49% | 8.49% | 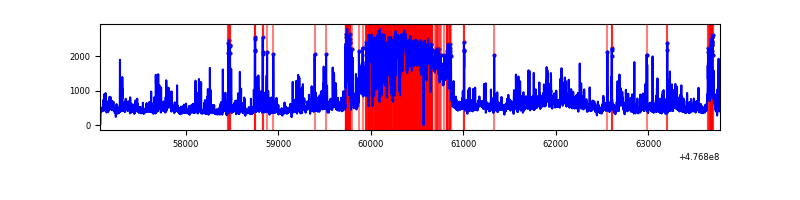 |
| C | 6702 | 6702 | 844 | 844 | 12.59% | 12.59% | 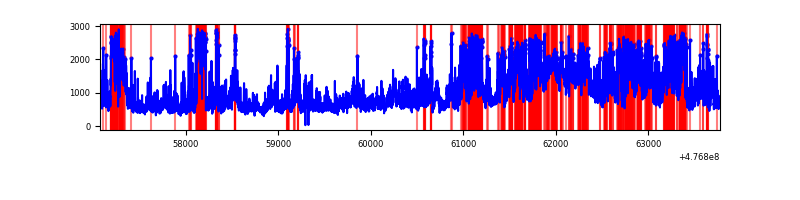 |
| D | 6702 | 6702 | 798 | 798 | 11.91% | 11.91% | 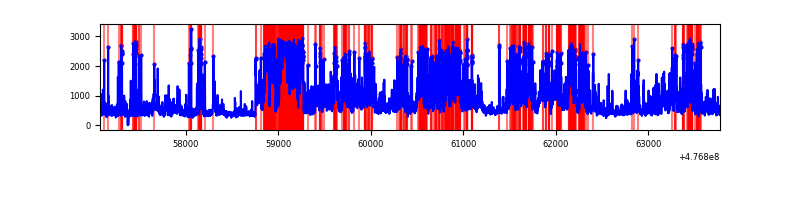 |
Top three noisy pixels from each quadrant. If the there are fewer than three noisy pixels in the level2.evt file, extra rows are filled as -1
| Pixel properties | Quadrant properties | ||||||
|---|---|---|---|---|---|---|---|
| Quadrant | DetID | PixID | Counts | Sigma | Mean | Median | Sigma |
| A | 12 | 80 | 1279396 | 7446.62 | 692 | 676 | 171.7 |
| A | 9 | 191 | 723151 | 4207.33 | 692 | 676 | 171.7 |
| A | 10 | 253 | 457599 | 2660.89 | 692 | 676 | 171.7 |
| B | 4 | 170 | 1288637 | 8787.09 | 681 | 656 | 146.6 |
| B | 1 | 223 | 415561 | 2830.64 | 681 | 656 | 146.6 |
| B | 0 | 229 | 243239 | 1654.99 | 681 | 656 | 146.6 |
| C | 15 | 174 | 2429803 | 13576.72 | 648 | 644 | 178.9 |
| C | 15 | 173 | 367750 | 2051.78 | 648 | 644 | 178.9 |
| C | 9 | 69 | 363978 | 2030.69 | 648 | 644 | 178.9 |
| D | 7 | 110 | 1143633 | 6285.59 | 652 | 627 | 181.8 |
| D | 8 | 129 | 835805 | 4592.79 | 652 | 627 | 181.8 |
| D | 15 | 108 | 347912 | 1909.78 | 652 | 627 | 181.8 |
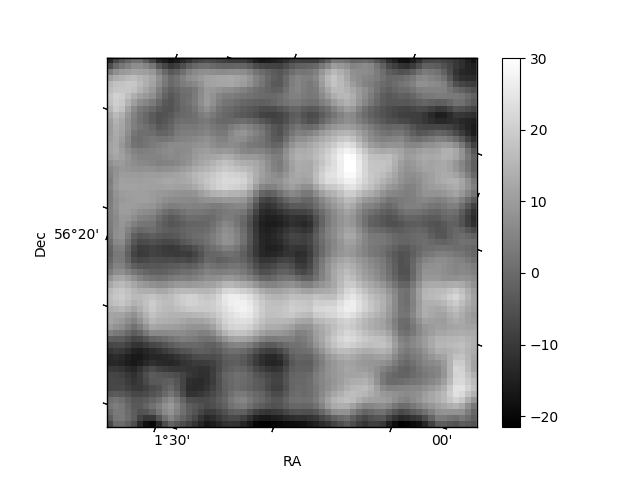
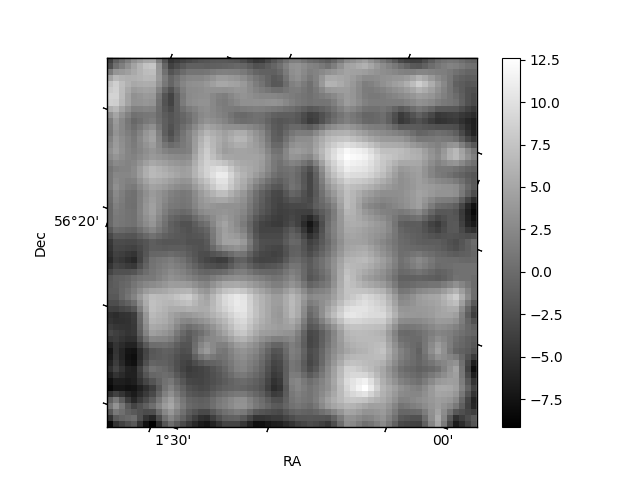
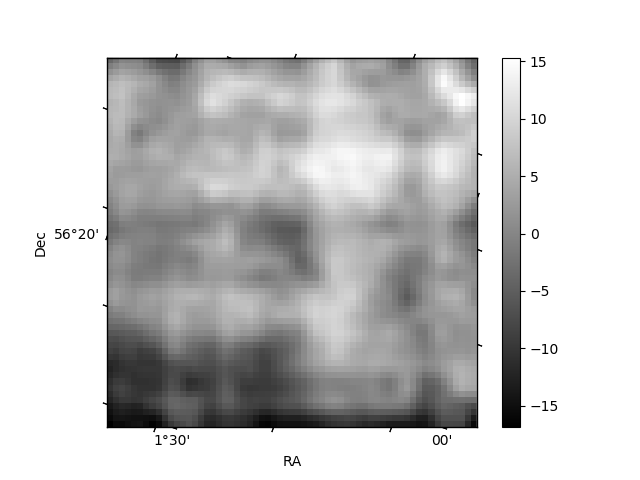
Histogram calculated using DETX and DETY for each event in the final _common_clean file
| Quadrant A | 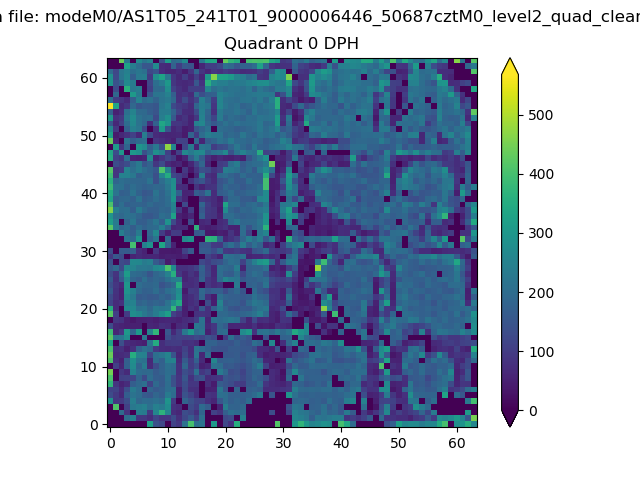 |
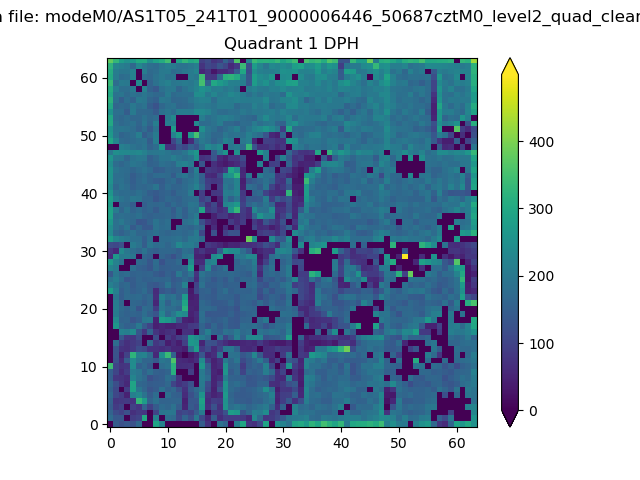 |
Quadrant B |
|---|---|---|---|
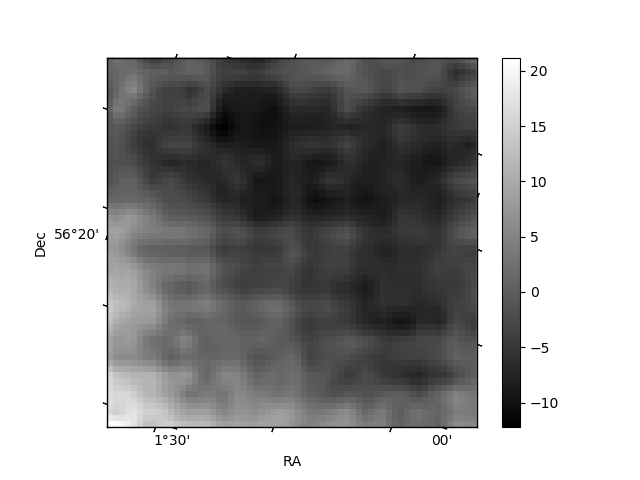
| Quadrant D | 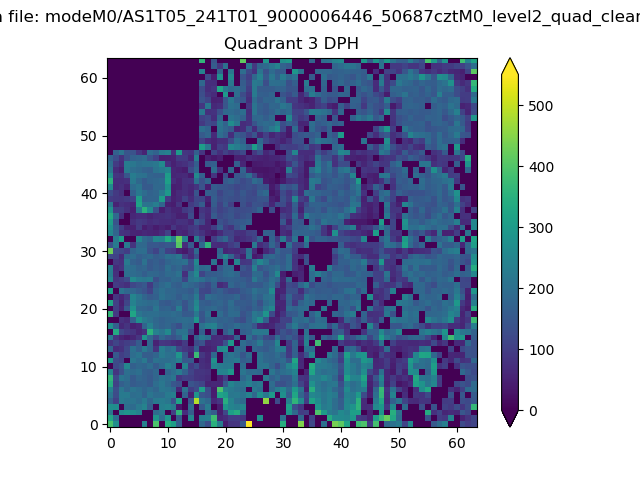 |
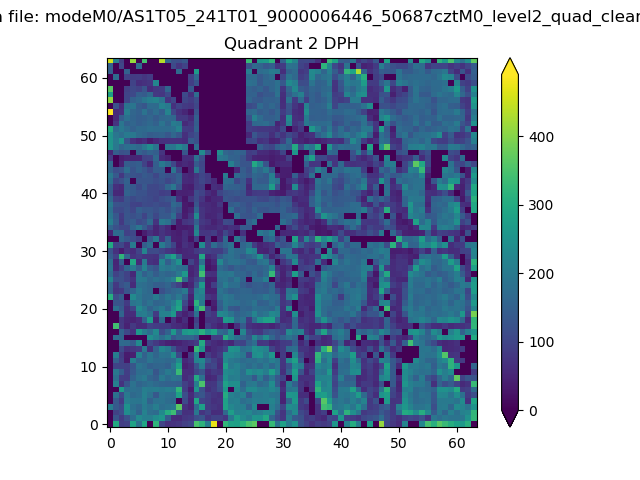 |
Quadrant C |
| Plot type | Count rate plots | Images |
|---|---|---|
| Comparison with Poisson distribution Blue bars denote a histogram of data divided into 1 sec bins. Red curve is a Poisson curve with rate = median count rate of data. |
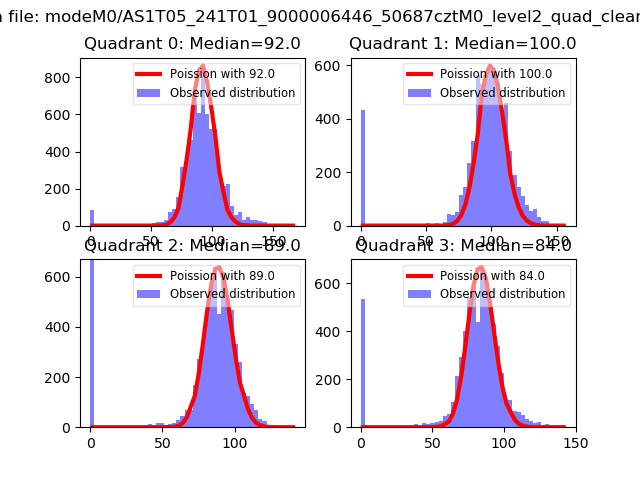 |
 |
| Quadrant-wise count rates Data is divided into 100 sec bins |
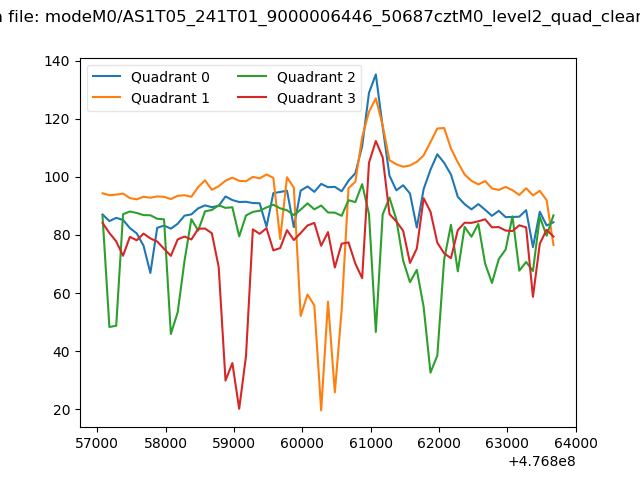 |
|
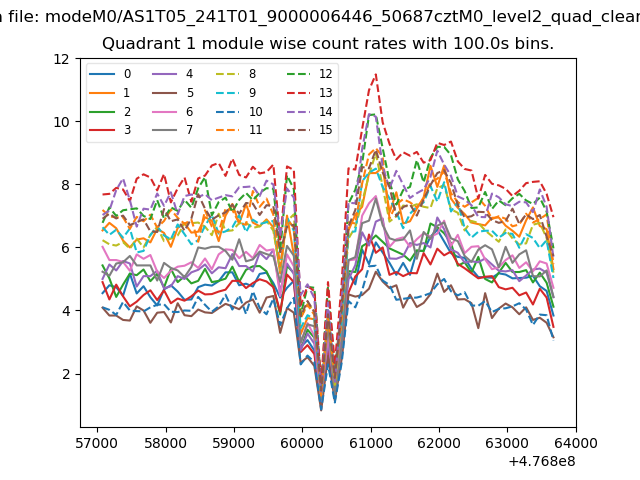
| Module-wise count rates for Quadrant A Data is divided into 100 sec bins |
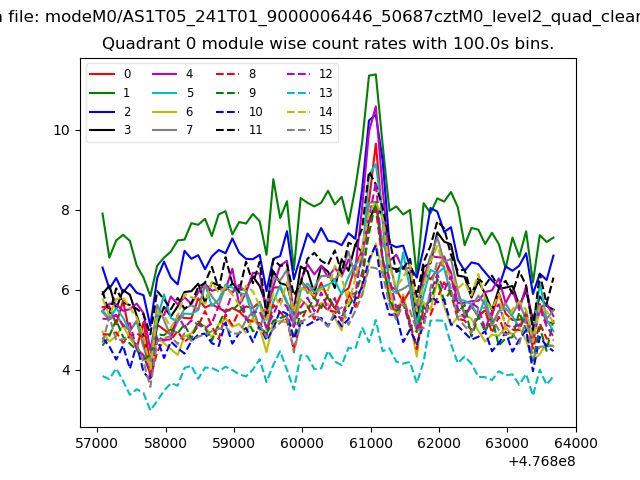 |
 |
| Module-wise count rates for Quadrant B Data is divided into 100 sec bins |
 |
 |
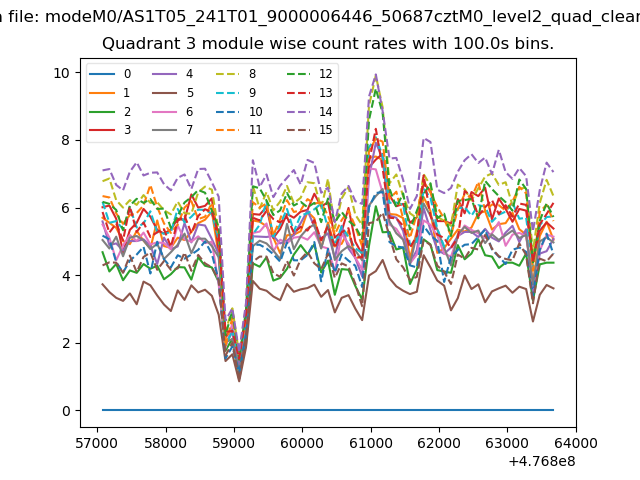
| Module-wise count rates for Quadrant C Data is divided into 100 sec bins |
 |
 |
| Module-wise count rates for Quadrant D Data is divided into 100 sec bins |
 |
 |
| Parameter | Plot |
|---|---|
| CZT HV Monitor | 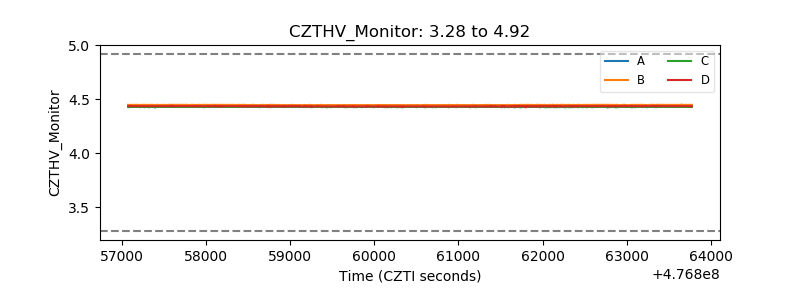 |
| D_VDD | 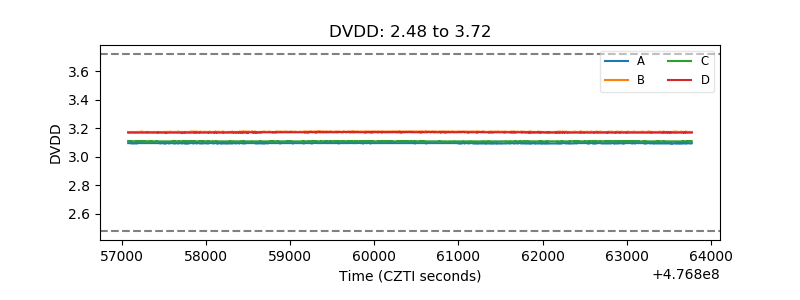 |
| Temperature 1 | 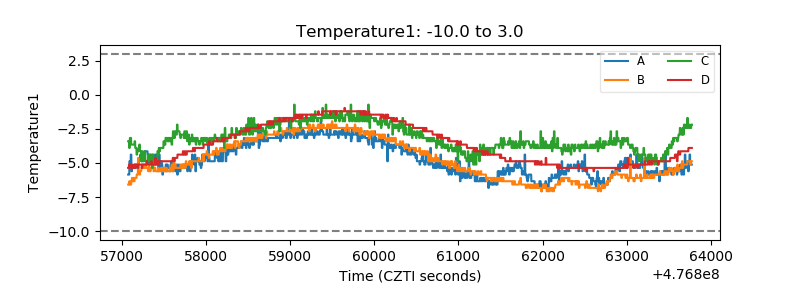 |
| Veto HV Monitor | 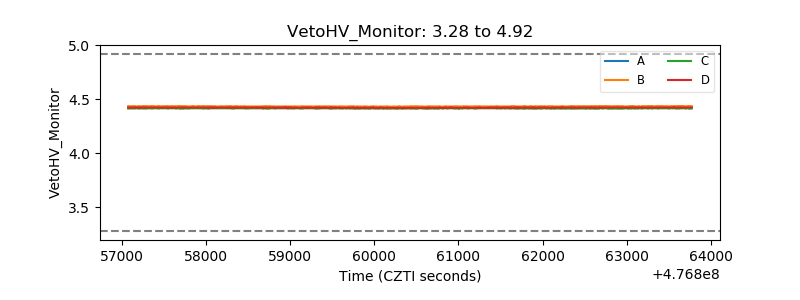 |
| Veto LLD | 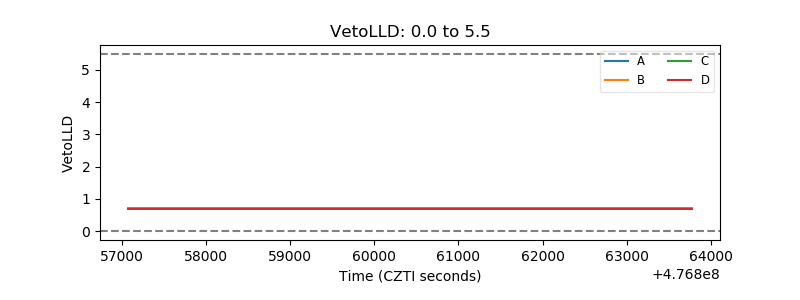 |
| Alpha Counter | 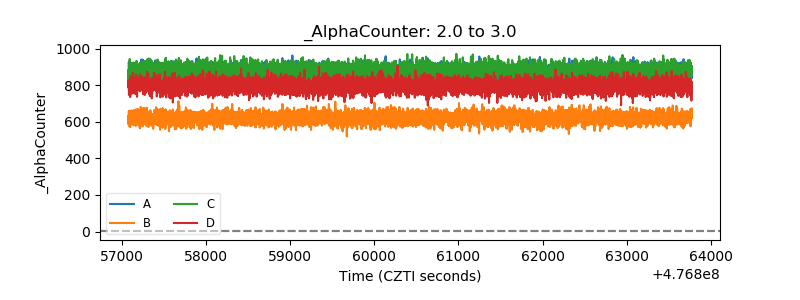 |
| _CPM_Rate | 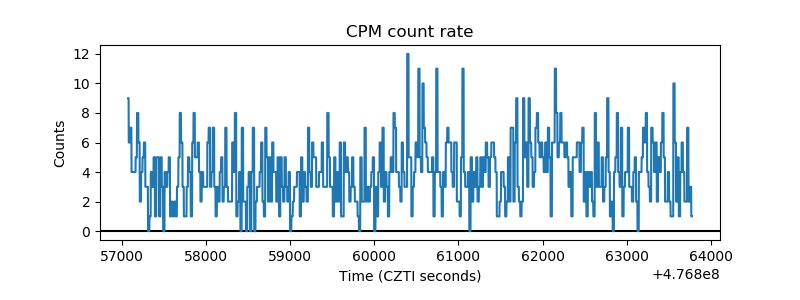 |
| CZT Counter | 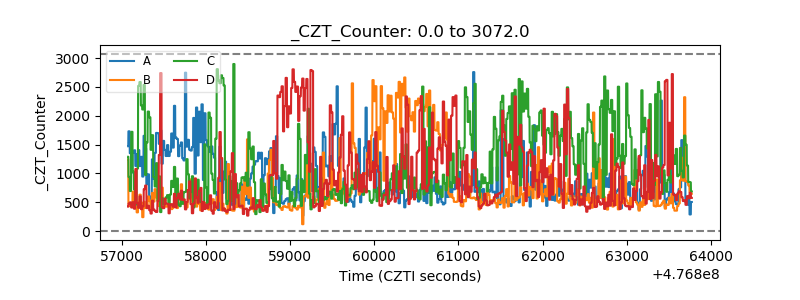 |
| +2.5 Volts monitor | 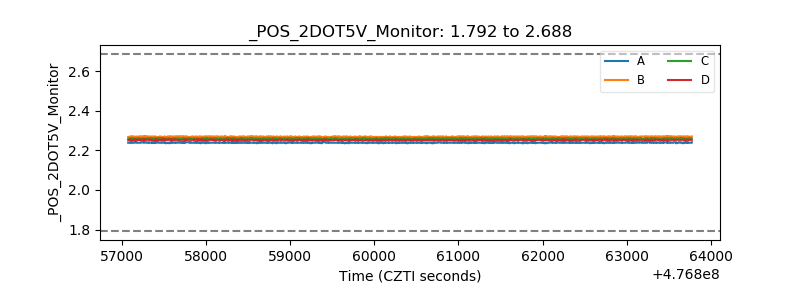 |
| +5 Volts monitor | 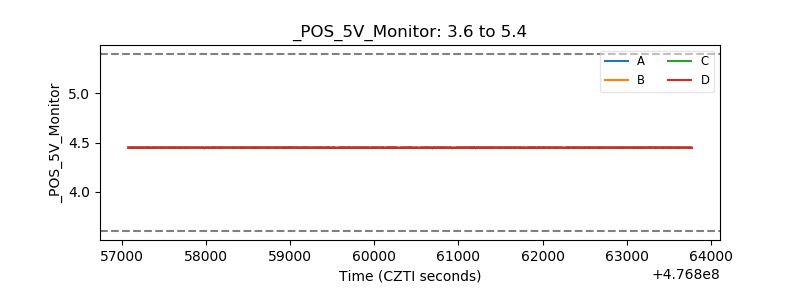 |
| _ROLL_ROT | 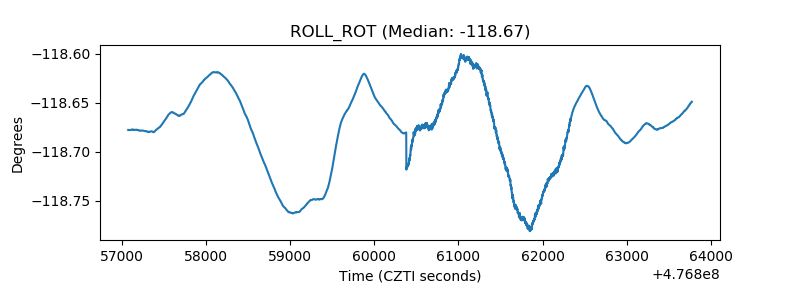 |
| _Roll_DEC | 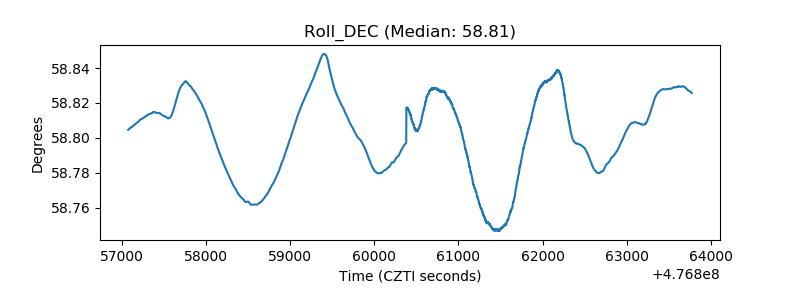 |
| _Roll_RA | 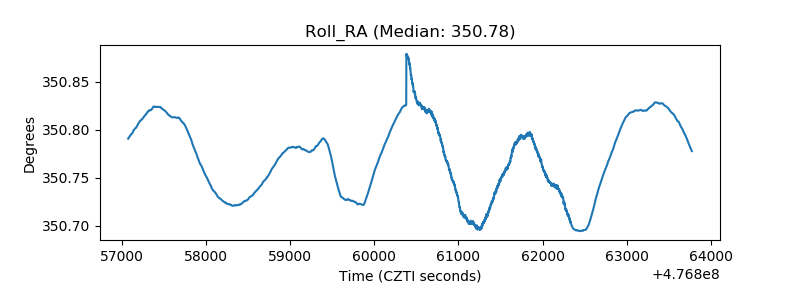 |
| Veto Counter | 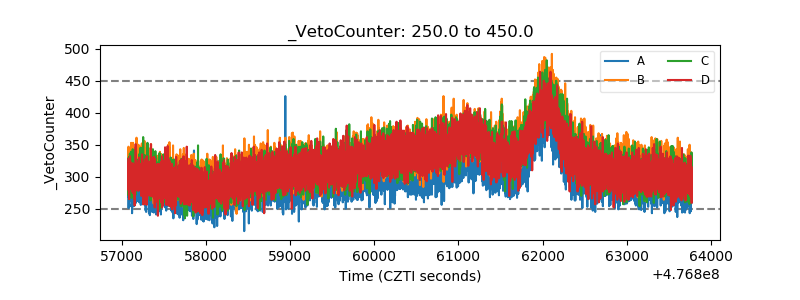 |