| Param | Original file | Final file |
|---|---|---|
| Filename | modeM0/AS1T05_241T01_9000006446_50691cztM0_level2.fits | modeM0/AS1T05_241T01_9000006446_50691cztM0_level2_quad_clean.evt |
| Size (bytes) | 1,419,586,560 | 165,384,000 |
| Size | 1.3 GB | 157.7 MB |
| Events in quadrant A | 18,624,101 | 928,406 |
| Events in quadrant B | 11,652,888 | 1,159,062 |
| Events in quadrant C | 9,103,956 | 1,087,098 |
| Events in quadrant D | 12,182,009 | 947,320 |
| Mode M9 | |||
|---|---|---|---|
| Quadrant | BADHDUFLAG | Total packets | Discarded packets |
| A | 0 | 10 | 0 |
| B | 0 | 10 | 0 |
| C | 0 | 10 | 0 |
| D | 0 | 10 | 0 |
| Mode M0 | |||
|---|---|---|---|
| Quadrant | BADHDUFLAG | Total packets | Discarded packets |
| A | 0 | 64147 | 9 |
| B | 0 | 43329 | 2 |
| C | 0 | 35877 | 2 |
| D | 0 | 44965 | 2 |
| Mode SS | |||
|---|---|---|---|
| Quadrant | BADHDUFLAG | Total packets | Discarded packets |
| A | 0 | 262 | 0 |
| B | 0 | 262 | 0 |
| C | 0 | 262 | 0 |
| D | 0 | 262 | 0 |
| Quadrant | Total seconds | Saturated seconds | Saturation percentage |
|---|---|---|---|
| A | 12794 | 3325 | 25.988745% |
| B | 12794 | 1460 | 11.411599% |
| C | 12794 | 793 | 6.198218% |
| D | 12795 | 1533 | 11.981243% |
Noise dominated data is calculated using 1-second bins in cleaned event files. If a bin has >2000 counts, and if more than 50% of those come from <1% of pixels, then it is considered to be noise-dominated and hence unusable.
| Quadrant | # 1 sec bins | Bins with >0 counts | Bins with >2000 counts | High rate bins dominated by noise | Noise dominated (total time) | Noise dominated (detector-on time) | Marked lightcurve |
|---|---|---|---|---|---|---|---|
| A | 13928 | 12795 | 3299 | 3299 | 23.69% | 25.78% | 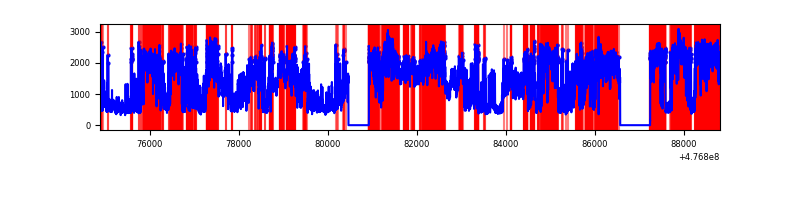 |
| B | 13928 | 12795 | 966 | 966 | 6.94% | 7.55% | 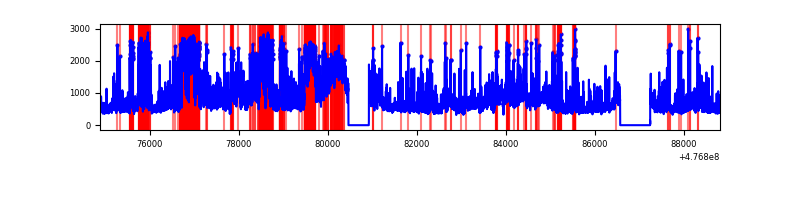 |
| C | 13928 | 12795 | 624 | 624 | 4.48% | 4.88% | 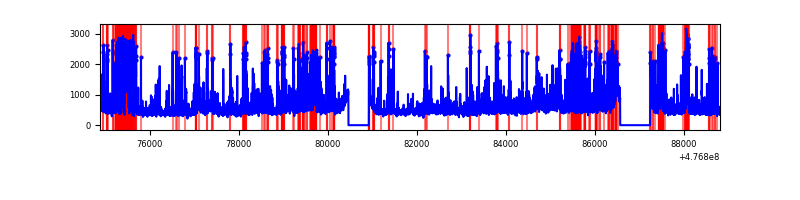 |
| D | 13929 | 12796 | 1507 | 1507 | 10.82% | 11.78% | 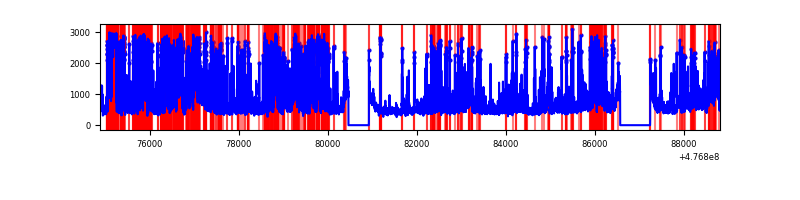 |
Top three noisy pixels from each quadrant. If the there are fewer than three noisy pixels in the level2.evt file, extra rows are filled as -1
| Pixel properties | Quadrant properties | ||||||
|---|---|---|---|---|---|---|---|
| Quadrant | DetID | PixID | Counts | Sigma | Mean | Median | Sigma |
| A | 12 | 80 | 11355202 | 35707.2 | 1275 | 1245 | 318.0 |
| A | 4 | 3 | 546960 | 1716.23 | 1275 | 1245 | 318.0 |
| A | 8 | 38 | 217103 | 678.85 | 1275 | 1245 | 318.0 |
| B | 4 | 170 | 2466778 | 8876.2 | 1306 | 1258 | 277.8 |
| B | 6 | 255 | 1206872 | 4340.37 | 1306 | 1258 | 277.8 |
| B | 0 | 229 | 732008 | 2630.8 | 1306 | 1258 | 277.8 |
| C | 4 | 5 | 1002538 | 2819.17 | 1299 | 1289 | 355.2 |
| C | 13 | 113 | 949536 | 2669.93 | 1299 | 1289 | 355.2 |
| C | 13 | 3 | 365655 | 1025.93 | 1299 | 1289 | 355.2 |
| D | 8 | 129 | 3072270 | 8739.0 | 1264 | 1220 | 351.4 |
| D | 2 | 249 | 545428 | 1548.6 | 1264 | 1220 | 351.4 |
| D | 7 | 110 | 539907 | 1532.89 | 1264 | 1220 | 351.4 |
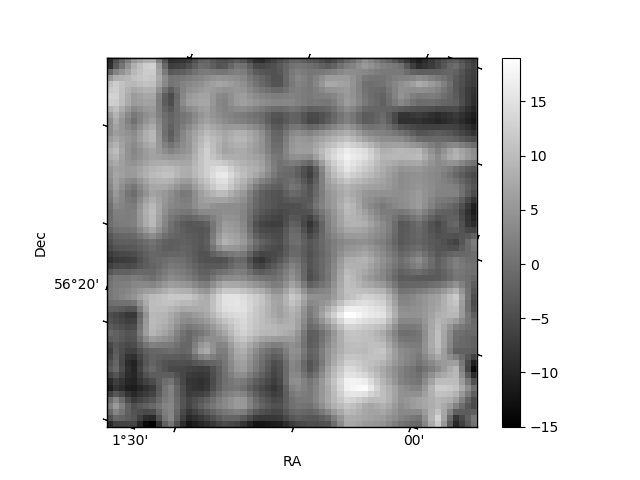
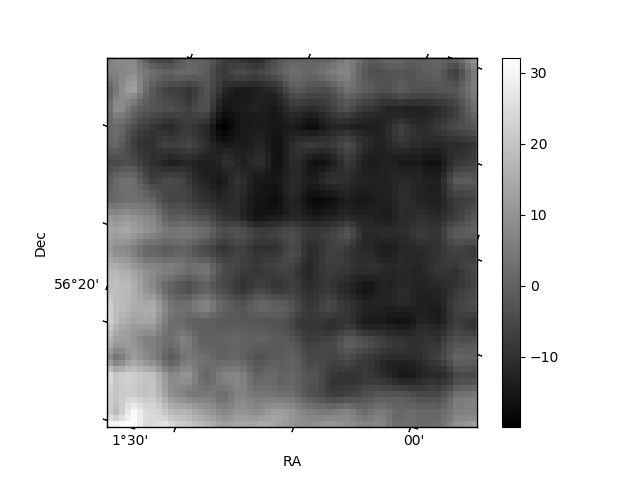
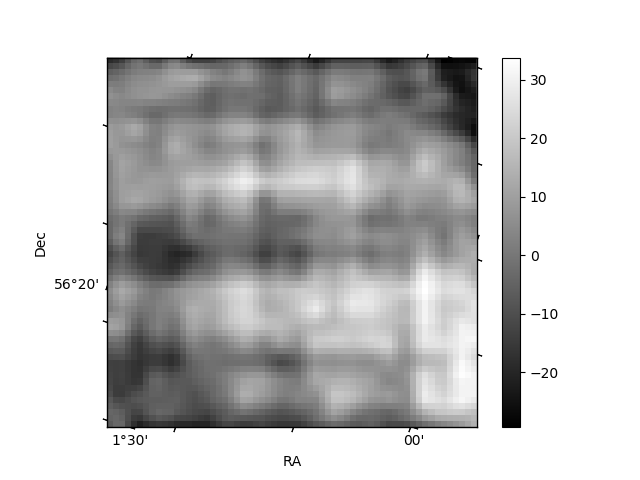
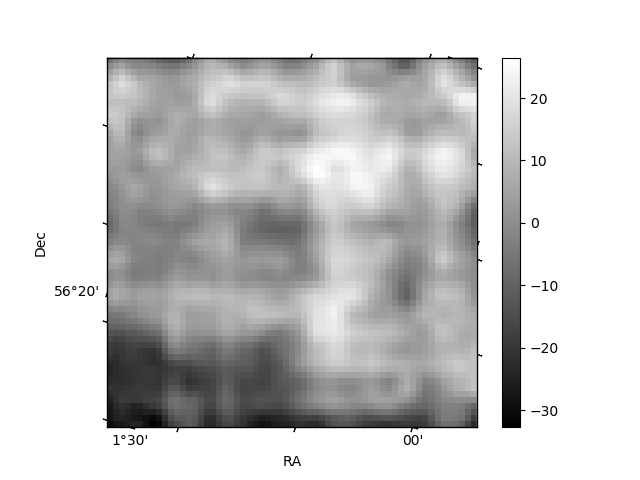
Histogram calculated using DETX and DETY for each event in the final _common_clean file
| Quadrant A | 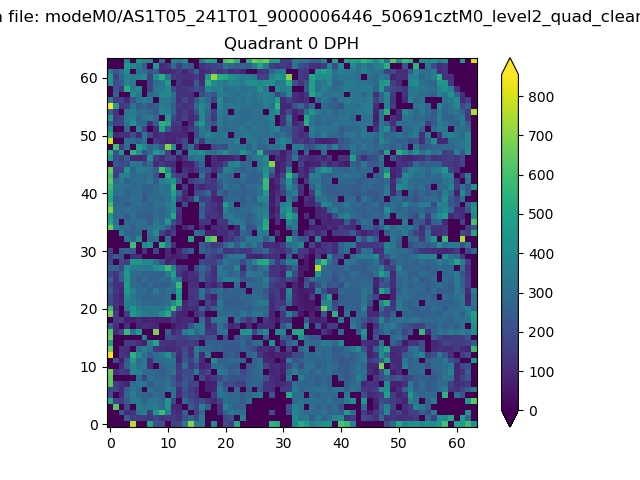 |
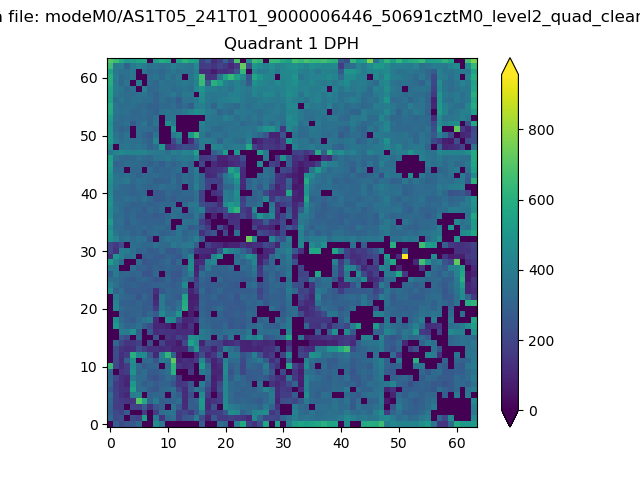 |
Quadrant B |
|---|---|---|---|
| Quadrant D | 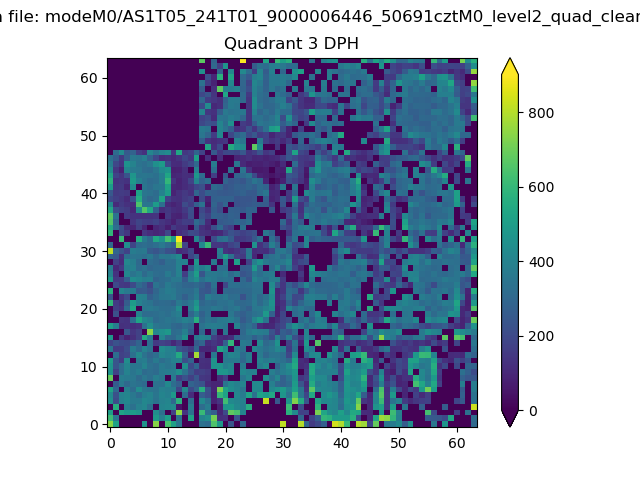 |
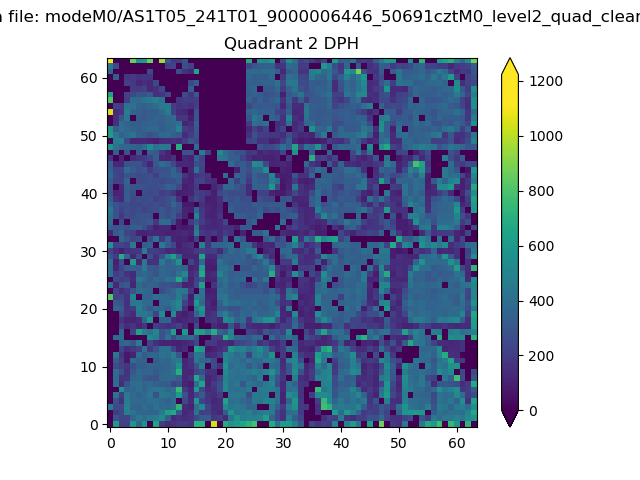 |
Quadrant C |
| Plot type | Count rate plots | Images |
|---|---|---|
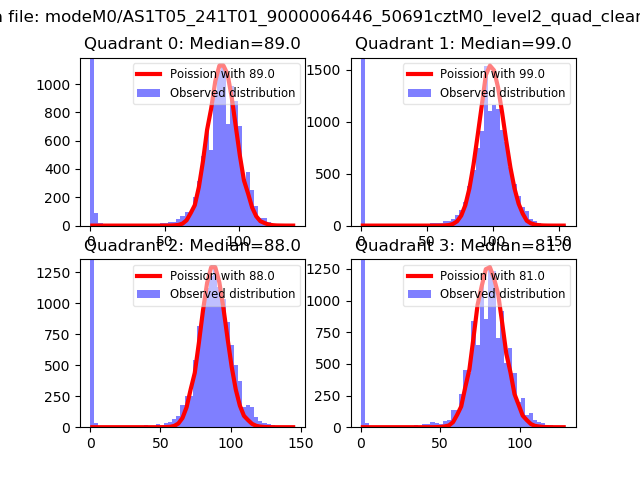
| Comparison with Poisson distribution Blue bars denote a histogram of data divided into 1 sec bins. Red curve is a Poisson curve with rate = median count rate of data. |
 |
 |
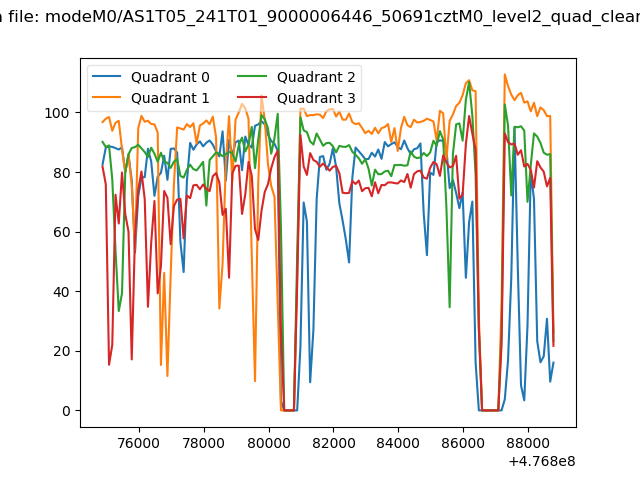
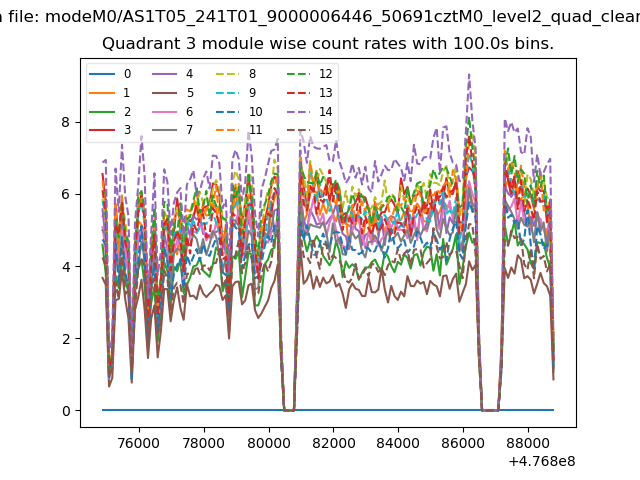
| Quadrant-wise count rates Data is divided into 100 sec bins |
 |
|
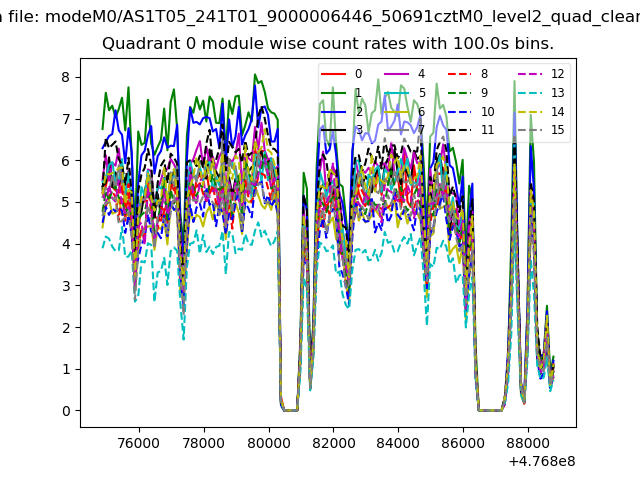
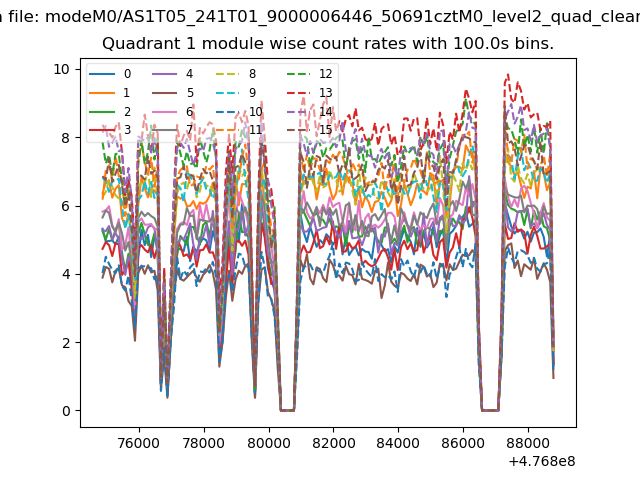
| Module-wise count rates for Quadrant A Data is divided into 100 sec bins |
 |
 |
| Module-wise count rates for Quadrant B Data is divided into 100 sec bins |
 |
 |
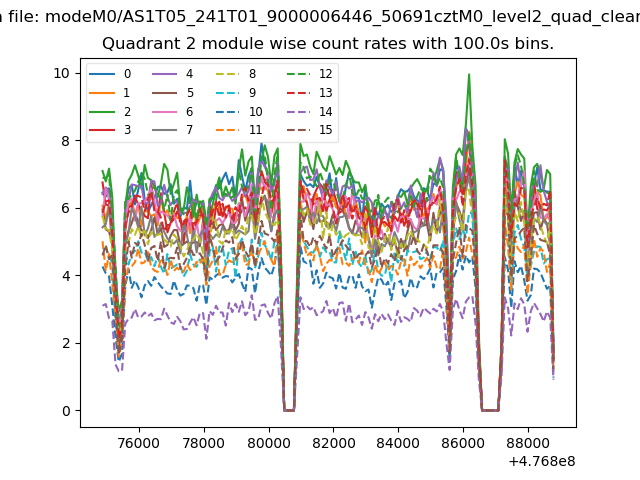
| Module-wise count rates for Quadrant C Data is divided into 100 sec bins |
 |
 |
| Module-wise count rates for Quadrant D Data is divided into 100 sec bins |
 |
 |
| Parameter | Plot |
|---|---|
| CZT HV Monitor | 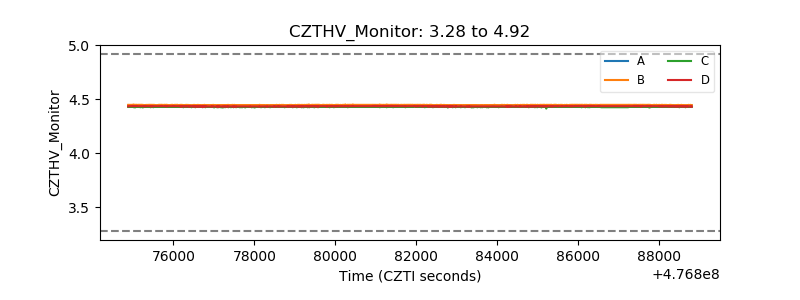 |
| D_VDD | 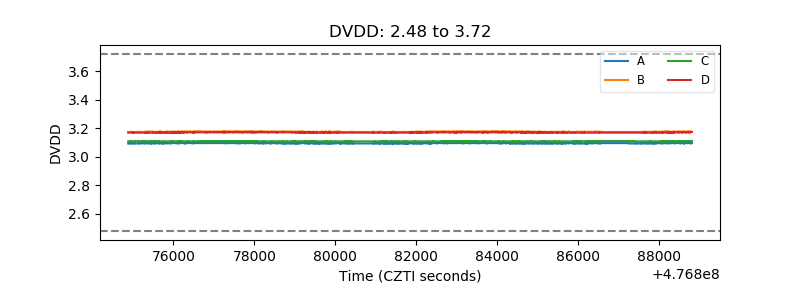 |
| Temperature 1 | 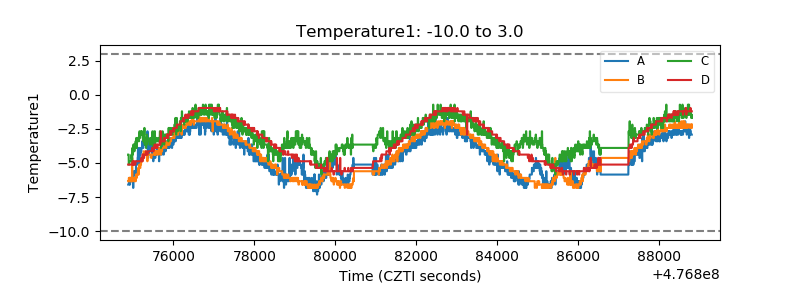 |
| Veto HV Monitor | 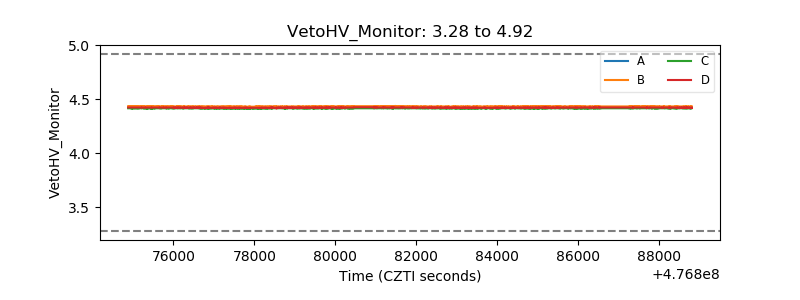 |
| Veto LLD | 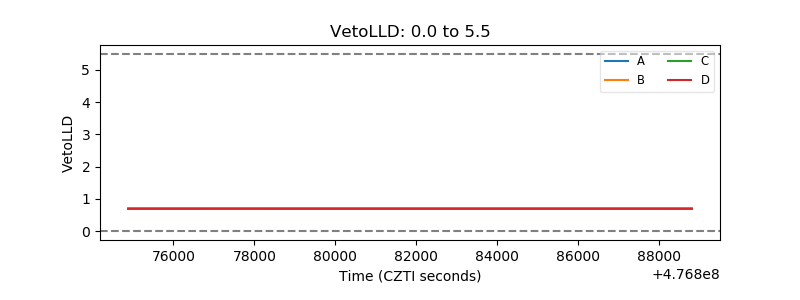 |
| Alpha Counter | 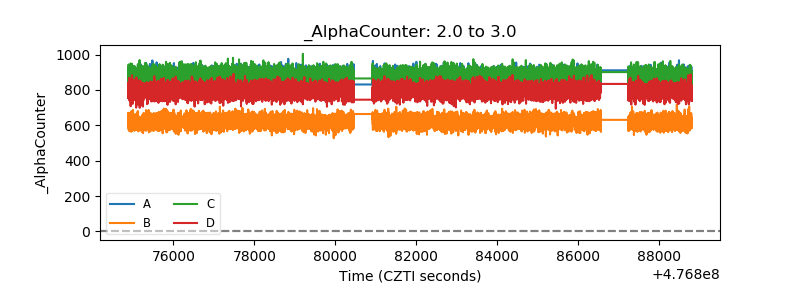 |
| _CPM_Rate | 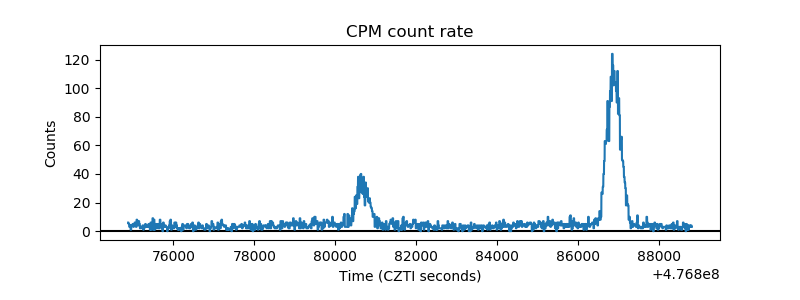 |
| CZT Counter | 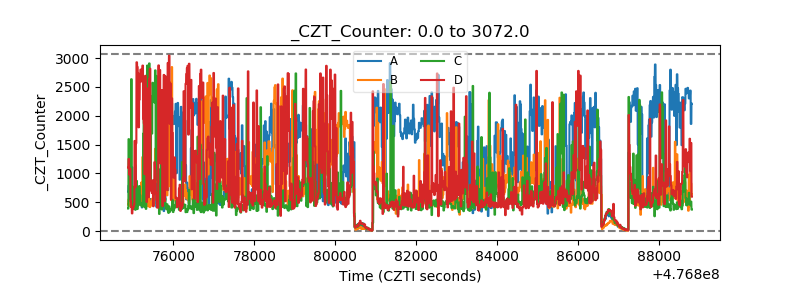 |
| +2.5 Volts monitor |  |
| +5 Volts monitor |  |
| _ROLL_ROT | 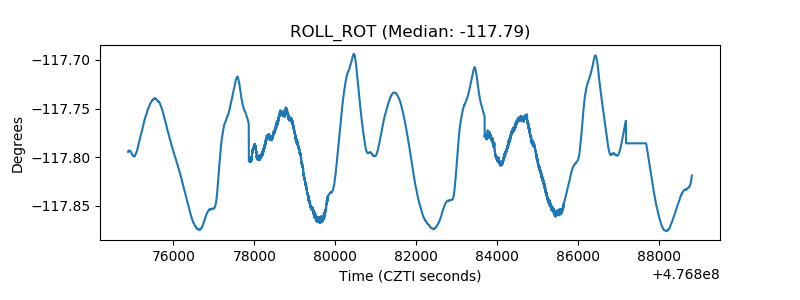 |
| _Roll_DEC | 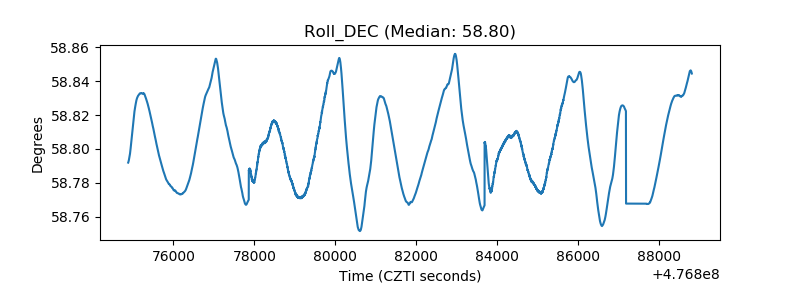 |
| _Roll_RA | 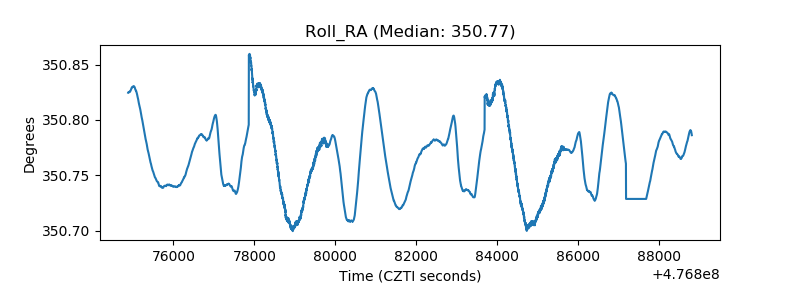 |
| Veto Counter | 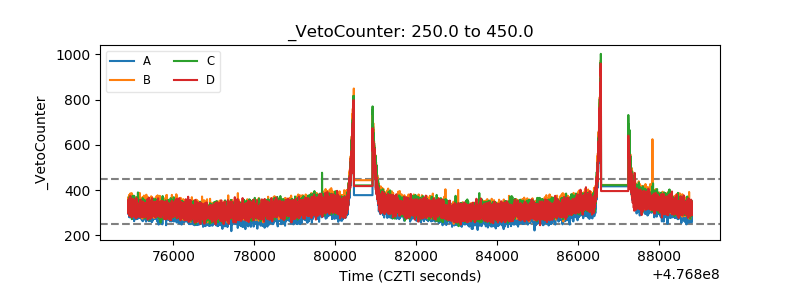 |