| Param | Original file | Final file |
|---|---|---|
| Filename | modeM0/AS1T05_241T01_9000006446_50692cztM0_level2.fits | modeM0/AS1T05_241T01_9000006446_50692cztM0_level2_quad_clean.evt |
| Size (bytes) | 648,028,800 | 87,171,840 |
| Size | 618.0 MB | 83.1 MB |
| Events in quadrant A | 7,800,946 | 477,224 |
| Events in quadrant B | 3,812,120 | 649,937 |
| Events in quadrant C | 4,493,234 | 564,535 |
| Events in quadrant D | 7,392,504 | 506,390 |
| Mode M9 | |||
|---|---|---|---|
| Quadrant | BADHDUFLAG | Total packets | Discarded packets |
| A | 0 | 9 | 0 |
| B | 0 | 9 | 0 |
| C | 0 | 9 | 0 |
| D | 0 | 9 | 0 |
| Mode M0 | |||
|---|---|---|---|
| Quadrant | BADHDUFLAG | Total packets | Discarded packets |
| A | 0 | 27433 | 1 |
| B | 0 | 15582 | 1 |
| C | 0 | 17659 | 1 |
| D | 0 | 26433 | 1 |
| Mode SS | |||
|---|---|---|---|
| Quadrant | BADHDUFLAG | Total packets | Discarded packets |
| A | 0 | 128 | 0 |
| B | 0 | 128 | 0 |
| C | 0 | 128 | 0 |
| D | 0 | 128 | 0 |
| Quadrant | Total seconds | Saturated seconds | Saturation percentage |
|---|---|---|---|
| A | 6321 | 1592 | 25.185888% |
| B | 6322 | 110 | 1.739956% |
| C | 6322 | 346 | 5.472952% |
| D | 6322 | 664 | 10.503005% |
Noise dominated data is calculated using 1-second bins in cleaned event files. If a bin has >2000 counts, and if more than 50% of those come from <1% of pixels, then it is considered to be noise-dominated and hence unusable.
| Quadrant | # 1 sec bins | Bins with >0 counts | Bins with >2000 counts | High rate bins dominated by noise | Noise dominated (total time) | Noise dominated (detector-on time) | Marked lightcurve |
|---|---|---|---|---|---|---|---|
| A | 7216 | 6322 | 1842 | 1842 | 25.53% | 29.14% | 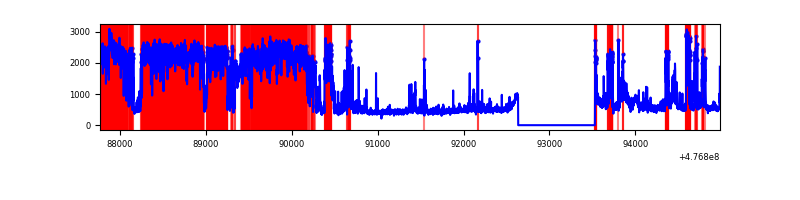 |
| B | 7217 | 6323 | 43 | 43 | 0.60% | 0.68% | 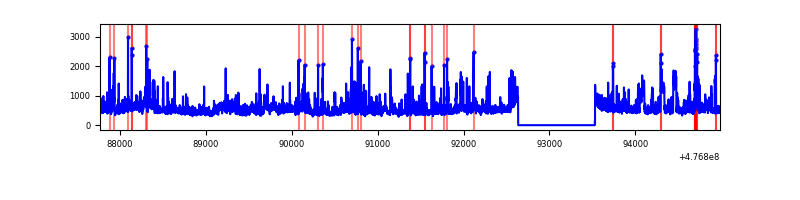 |
| C | 7217 | 6323 | 309 | 309 | 4.28% | 4.89% | 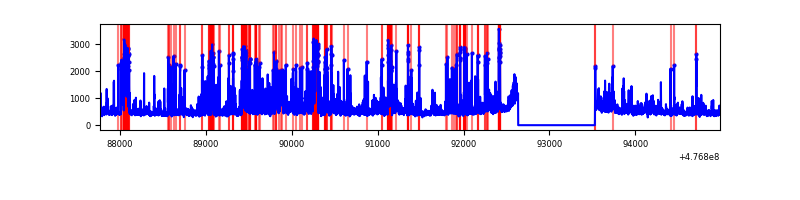 |
| D | 7217 | 6323 | 773 | 773 | 10.71% | 12.23% | 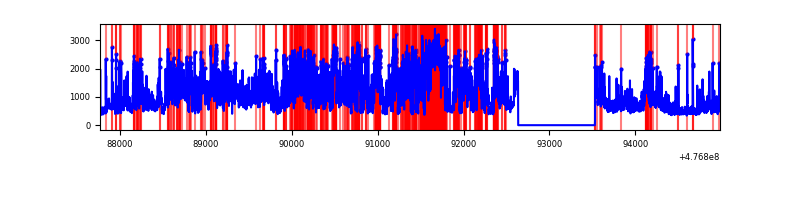 |
Top three noisy pixels from each quadrant. If the there are fewer than three noisy pixels in the level2.evt file, extra rows are filled as -1
| Pixel properties | Quadrant properties | ||||||
|---|---|---|---|---|---|---|---|
| Quadrant | DetID | PixID | Counts | Sigma | Mean | Median | Sigma |
| A | 12 | 80 | 4293481 | 27104.2 | 635 | 618 | 158.4 |
| A | 4 | 3 | 252486 | 1590.24 | 635 | 618 | 158.4 |
| A | 8 | 38 | 220464 | 1388.06 | 635 | 618 | 158.4 |
| B | 4 | 170 | 746899 | 5267.18 | 661 | 638 | 141.7 |
| B | 8 | 128 | 62250 | 434.86 | 661 | 638 | 141.7 |
| B | 5 | 185 | 48933 | 340.87 | 661 | 638 | 141.7 |
| C | 4 | 5 | 760121 | 4291.5 | 640 | 635 | 177.0 |
| C | 13 | 113 | 544307 | 3072.03 | 640 | 635 | 177.0 |
| C | 13 | 3 | 291025 | 1640.86 | 640 | 635 | 177.0 |
| D | 2 | 226 | 2315004 | 13193.3 | 627 | 606 | 175.4 |
| D | 10 | 181 | 501329 | 2854.39 | 627 | 606 | 175.4 |
| D | 14 | 195 | 384717 | 2189.64 | 627 | 606 | 175.4 |
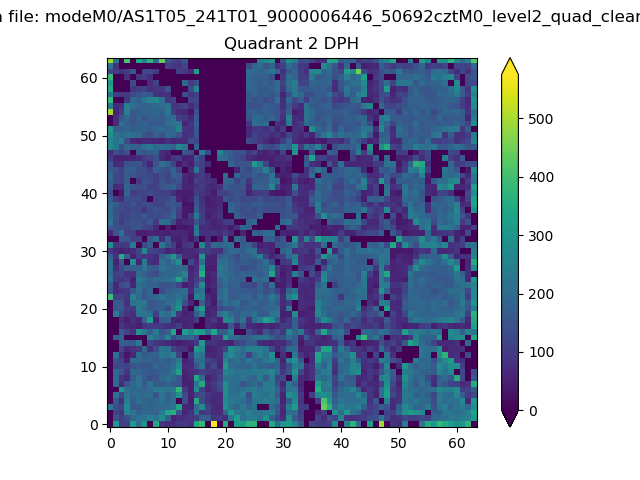
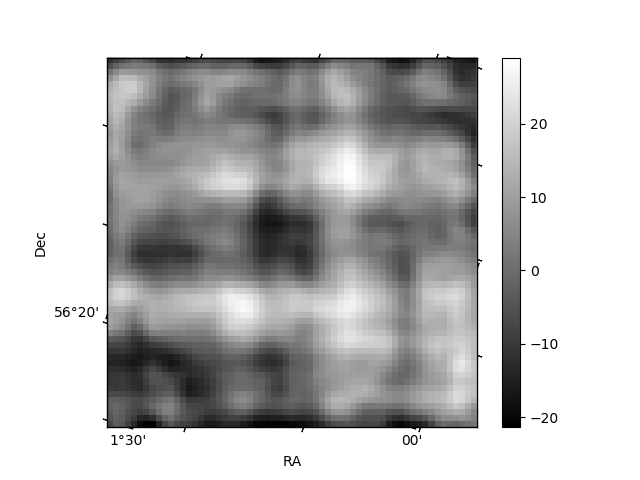
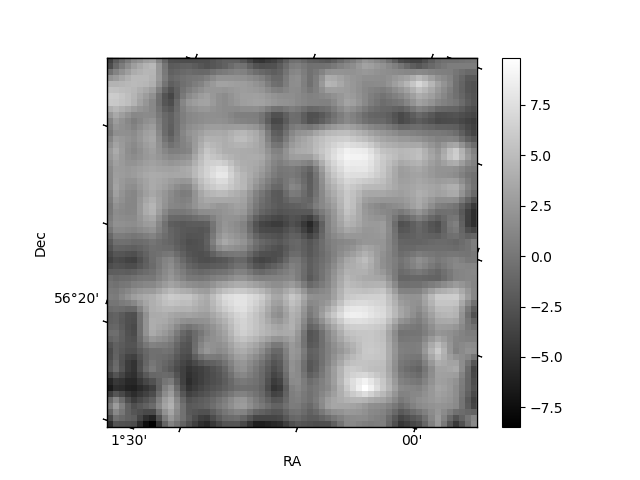
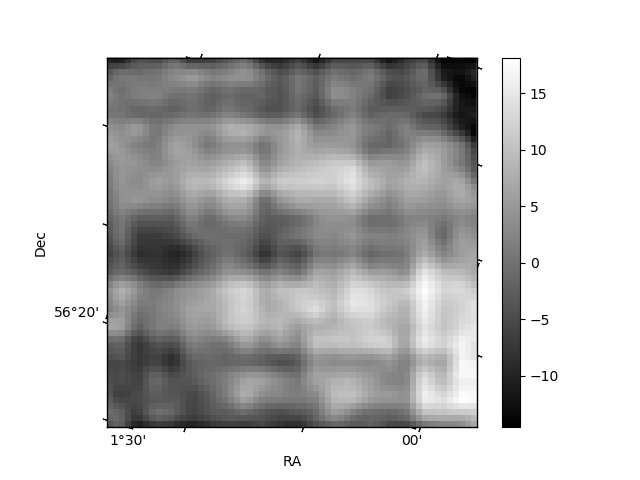
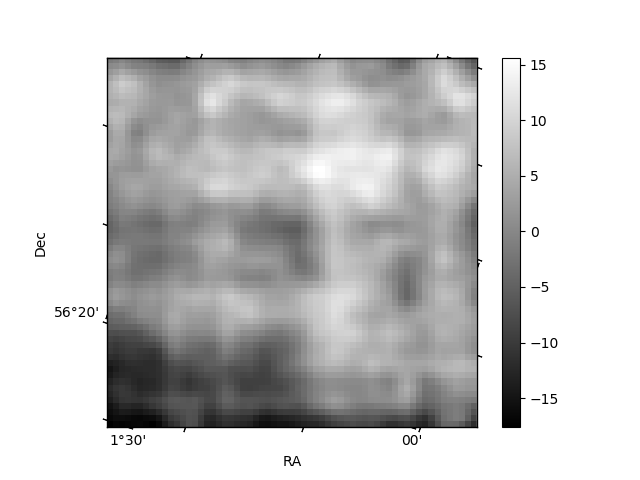
Histogram calculated using DETX and DETY for each event in the final _common_clean file
| Quadrant A | 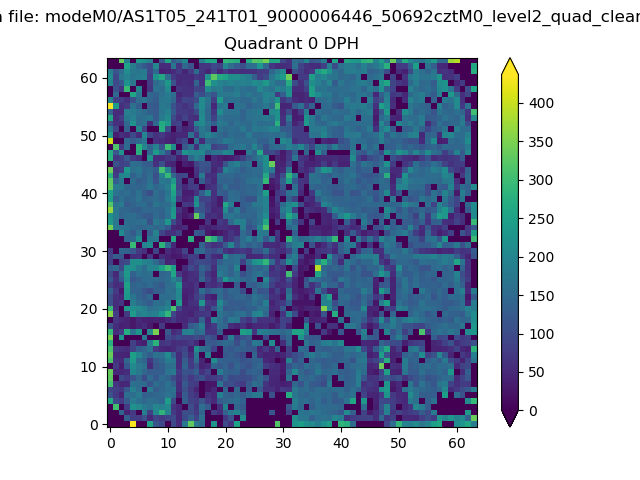 |
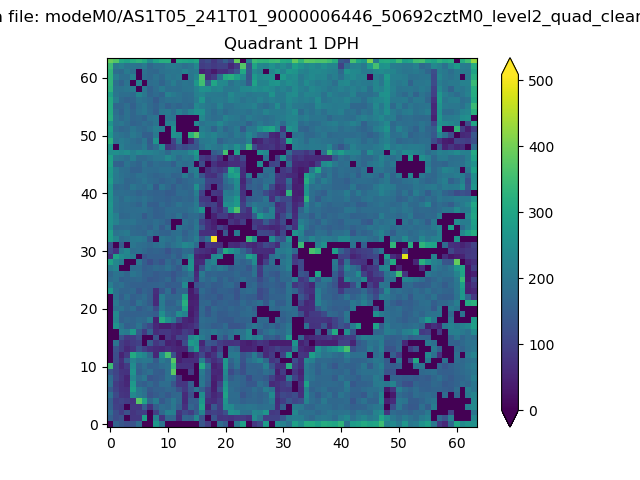 |
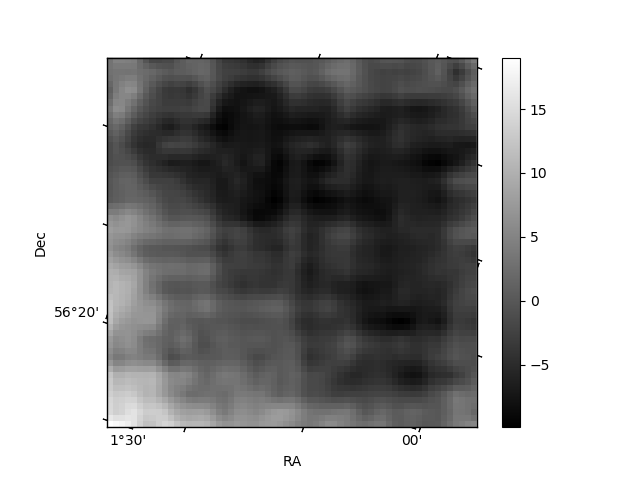
Quadrant B |
|---|---|---|---|
| Quadrant D | 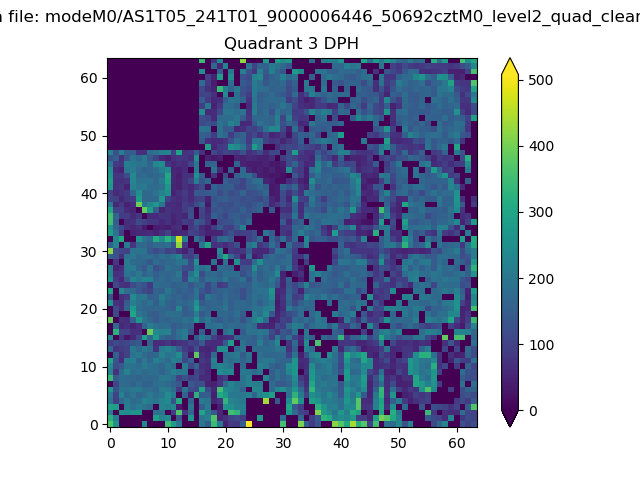 |
 |
Quadrant C |
| Plot type | Count rate plots | Images |
|---|---|---|
| Comparison with Poisson distribution Blue bars denote a histogram of data divided into 1 sec bins. Red curve is a Poisson curve with rate = median count rate of data. |
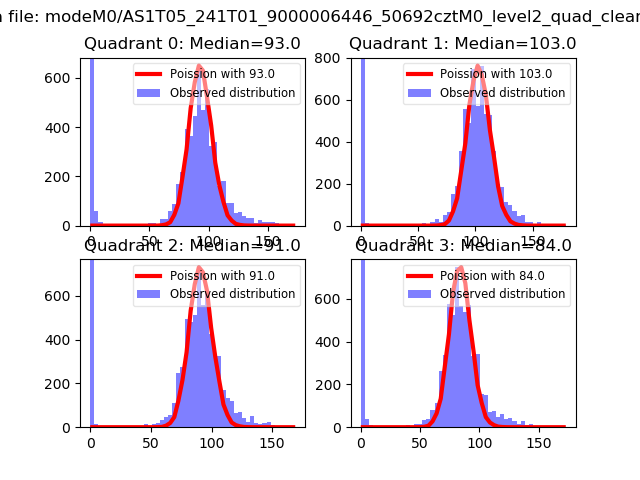 |
 |
| Quadrant-wise count rates Data is divided into 100 sec bins |
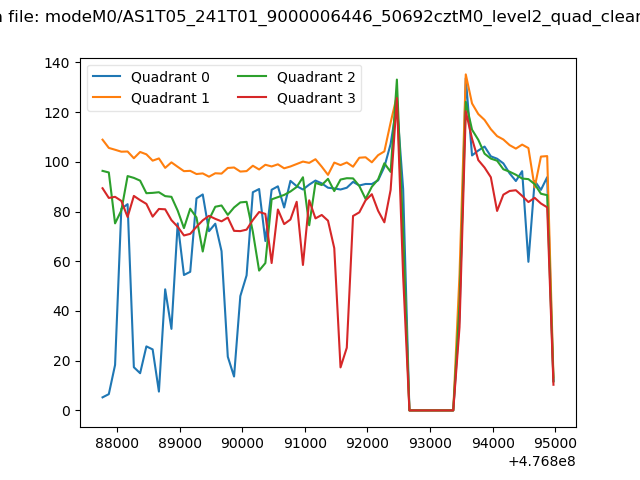 |
|
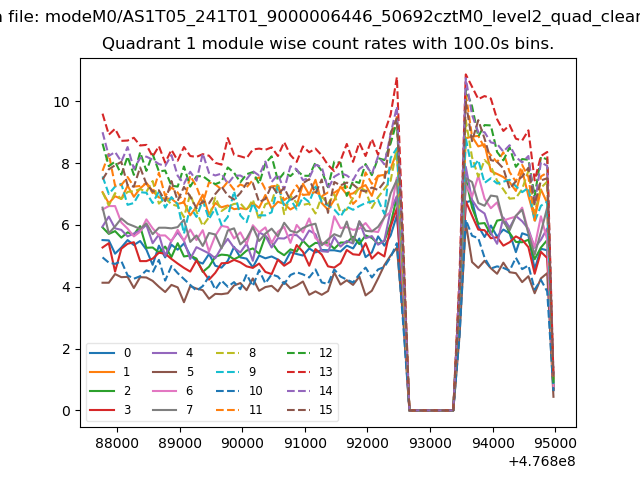
| Module-wise count rates for Quadrant A Data is divided into 100 sec bins |
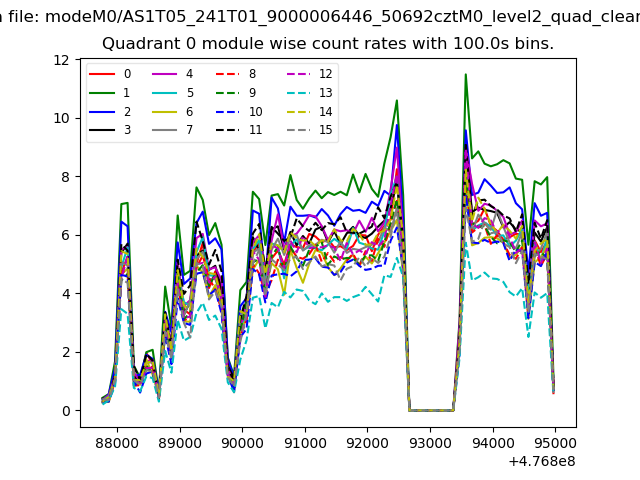 |
 |
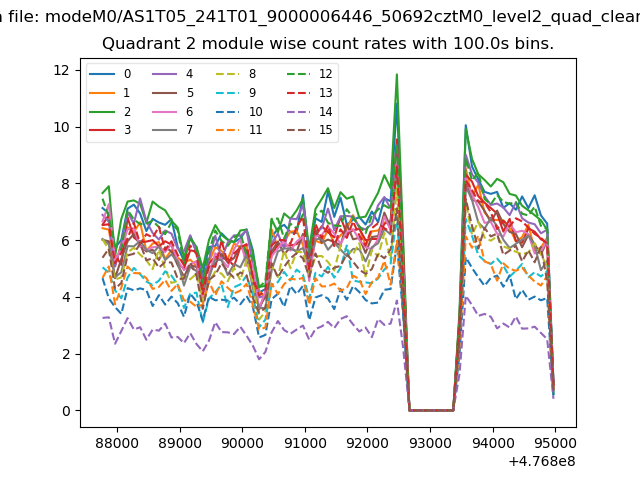
| Module-wise count rates for Quadrant B Data is divided into 100 sec bins |
 |
 |
| Module-wise count rates for Quadrant C Data is divided into 100 sec bins |
 |
 |
| Module-wise count rates for Quadrant D Data is divided into 100 sec bins |
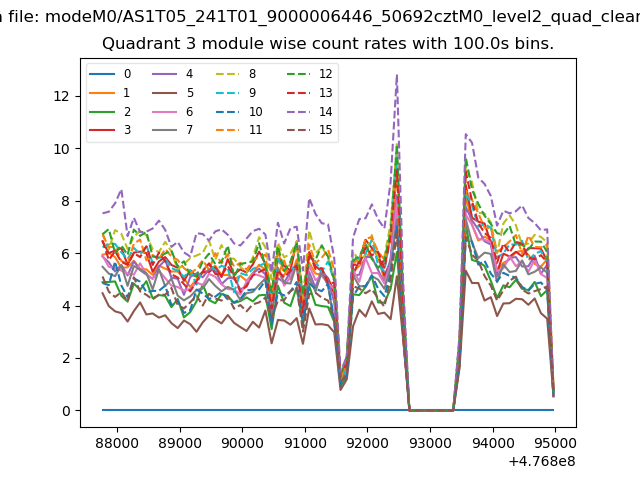 |
 |
| Parameter | Plot |
|---|---|
| CZT HV Monitor | 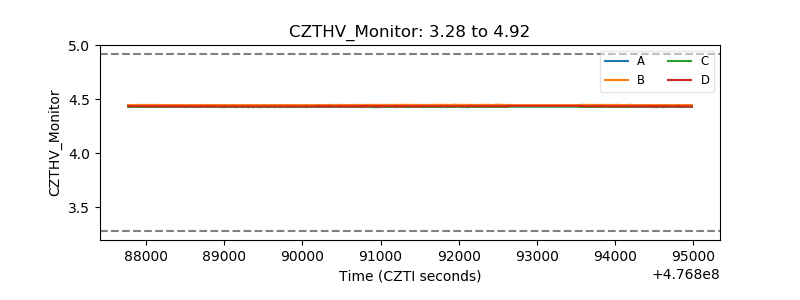 |
| D_VDD | 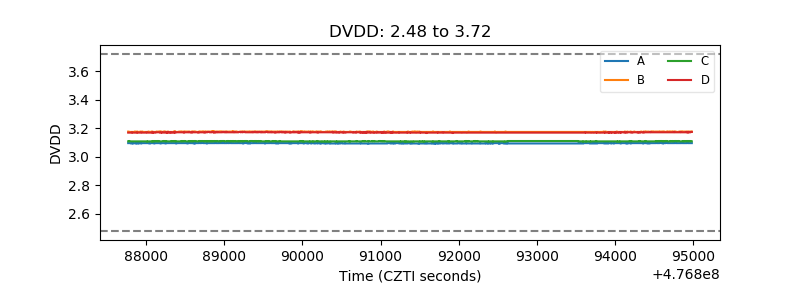 |
| Temperature 1 | 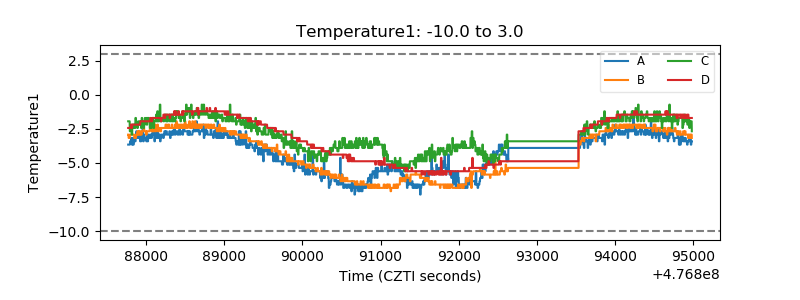 |
| Veto HV Monitor | 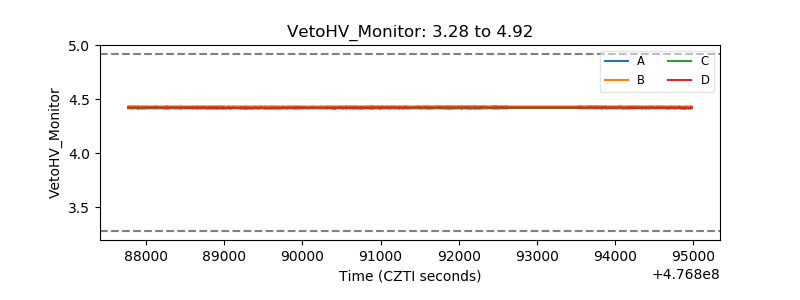 |
| Veto LLD | 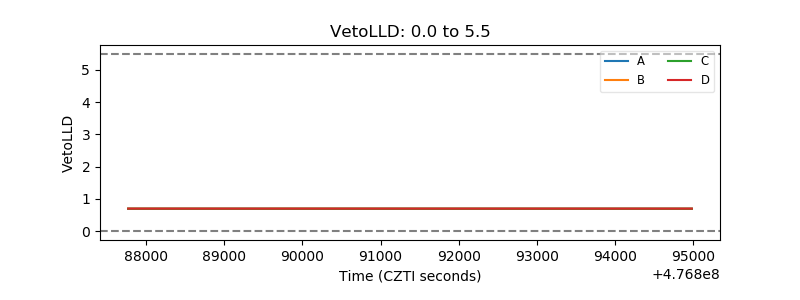 |
| Alpha Counter | 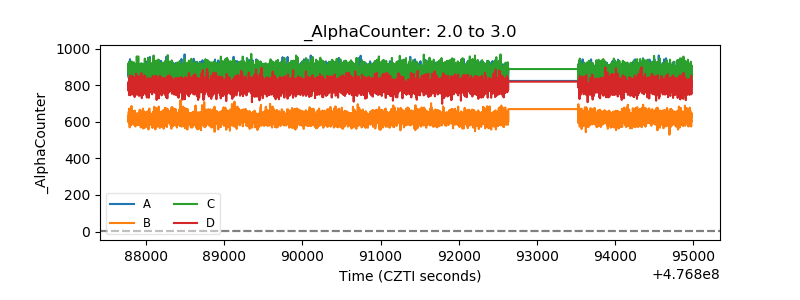 |
| _CPM_Rate | 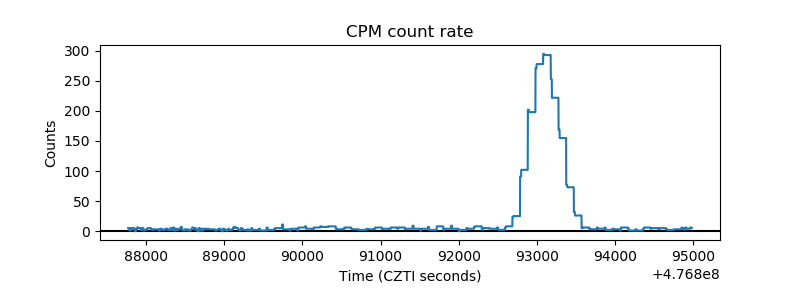 |
| CZT Counter | 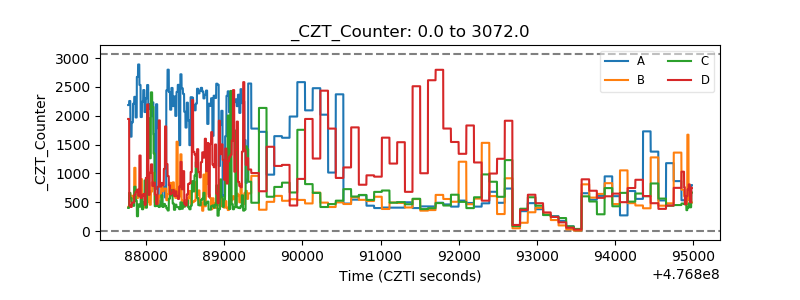 |
| +2.5 Volts monitor | 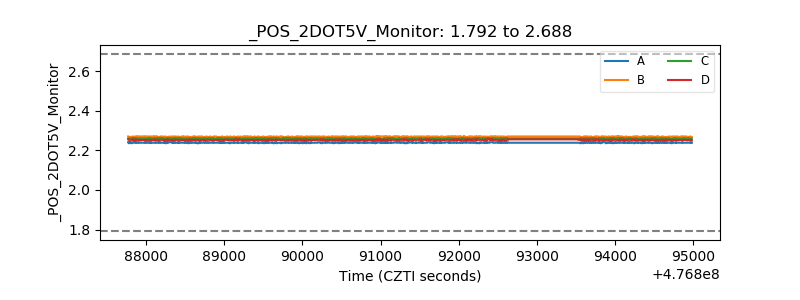 |
| +5 Volts monitor | 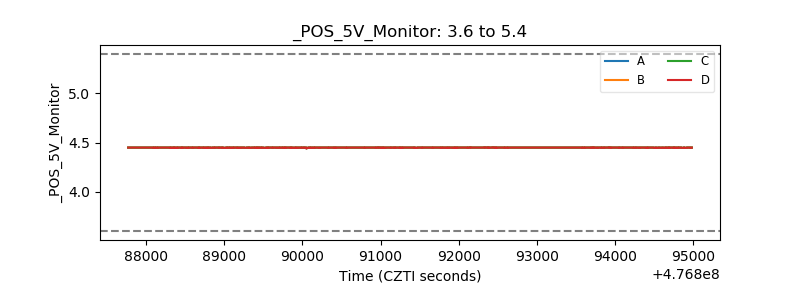 |
| _ROLL_ROT | 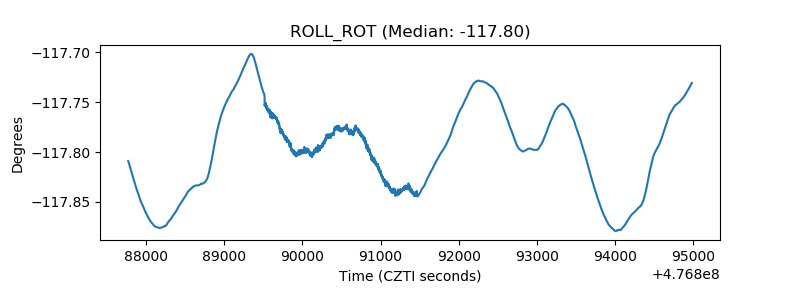 |
| _Roll_DEC | 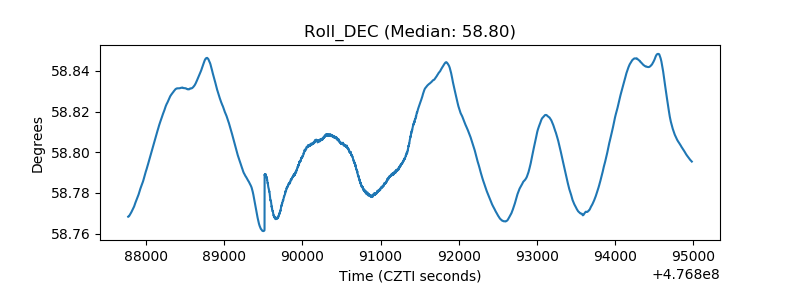 |
| _Roll_RA | 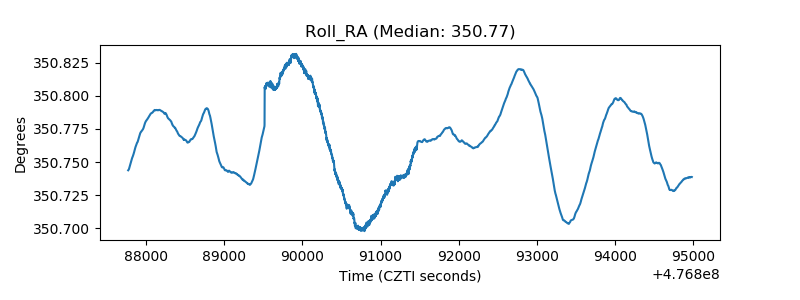 |
| Veto Counter | 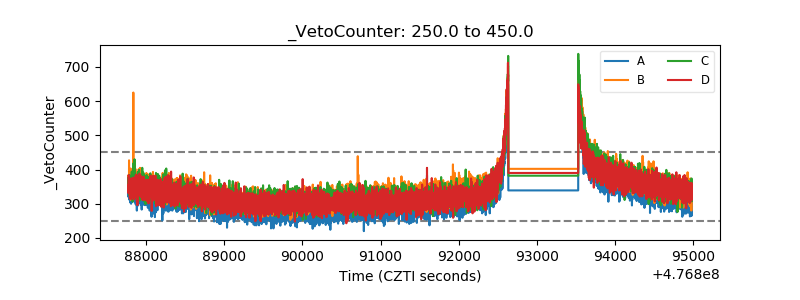 |