| Param | Original file | Final file |
|---|---|---|
| Filename | modeM0/AS1T05_241T01_9000006446_50694cztM0_level2.fits | modeM0/AS1T05_241T01_9000006446_50694cztM0_level2_quad_clean.evt |
| Size (bytes) | 494,294,400 | 93,300,480 |
| Size | 471.4 MB | 89.0 MB |
| Events in quadrant A | 4,081,448 | 605,368 |
| Events in quadrant B | 4,348,837 | 654,724 |
| Events in quadrant C | 4,709,233 | 578,800 |
| Events in quadrant D | 4,660,780 | 538,745 |
| Mode M9 | |||
|---|---|---|---|
| Quadrant | BADHDUFLAG | Total packets | Discarded packets |
| A | 0 | 10 | 0 |
| B | 0 | 10 | 0 |
| C | 0 | 10 | 0 |
| D | 0 | 10 | 0 |
| Mode M0 | |||
|---|---|---|---|
| Quadrant | BADHDUFLAG | Total packets | Discarded packets |
| A | 0 | 16284 | 1 |
| B | 0 | 17315 | 1 |
| C | 0 | 18402 | 1 |
| D | 0 | 18313 | 1 |
| Mode SS | |||
|---|---|---|---|
| Quadrant | BADHDUFLAG | Total packets | Discarded packets |
| A | 0 | 132 | 0 |
| B | 0 | 132 | 0 |
| C | 0 | 132 | 0 |
| D | 0 | 132 | 0 |
| Quadrant | Total seconds | Saturated seconds | Saturation percentage |
|---|---|---|---|
| A | 6404 | 186 | 2.904435% |
| B | 6405 | 216 | 3.372365% |
| C | 6405 | 270 | 4.215457% |
| D | 6404 | 298 | 4.653342% |
Noise dominated data is calculated using 1-second bins in cleaned event files. If a bin has >2000 counts, and if more than 50% of those come from <1% of pixels, then it is considered to be noise-dominated and hence unusable.
| Quadrant | # 1 sec bins | Bins with >0 counts | Bins with >2000 counts | High rate bins dominated by noise | Noise dominated (total time) | Noise dominated (detector-on time) | Marked lightcurve |
|---|---|---|---|---|---|---|---|
| A | 7434 | 6405 | 153 | 153 | 2.06% | 2.39% | 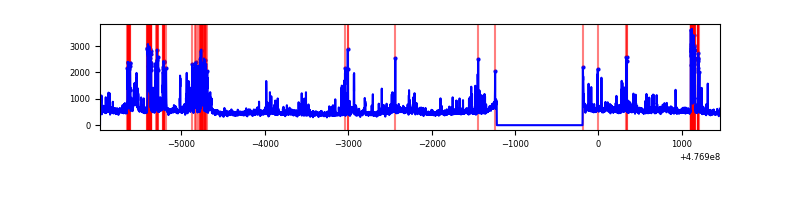 |
| B | 7435 | 6406 | 132 | 132 | 1.78% | 2.06% | 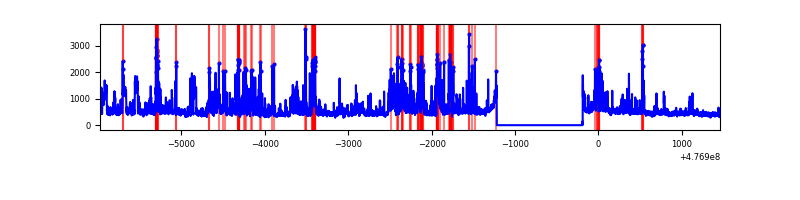 |
| C | 7435 | 6406 | 196 | 196 | 2.64% | 3.06% | 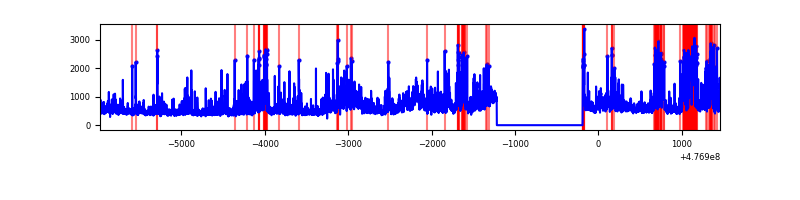 |
| D | 7434 | 6405 | 280 | 280 | 3.77% | 4.37% | 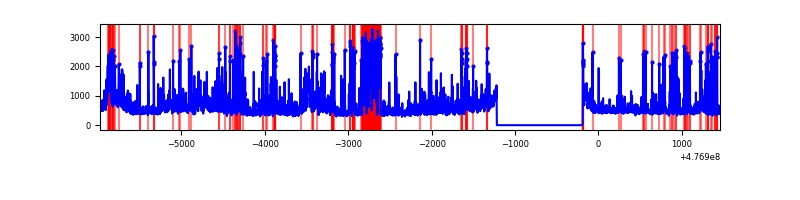 |
Top three noisy pixels from each quadrant. If the there are fewer than three noisy pixels in the level2.evt file, extra rows are filled as -1
| Pixel properties | Quadrant properties | ||||||
|---|---|---|---|---|---|---|---|
| Quadrant | DetID | PixID | Counts | Sigma | Mean | Median | Sigma |
| A | 4 | 3 | 459442 | 2776.32 | 668 | 652 | 165.3 |
| A | 8 | 38 | 272515 | 1645.15 | 668 | 652 | 165.3 |
| A | 12 | 80 | 145863 | 878.73 | 668 | 652 | 165.3 |
| B | 4 | 170 | 587831 | 4188.6 | 666 | 642 | 140.2 |
| B | 7 | 0 | 376276 | 2679.52 | 666 | 642 | 140.2 |
| B | 7 | 252 | 148593 | 1055.38 | 666 | 642 | 140.2 |
| C | 13 | 113 | 943367 | 5253.62 | 654 | 647 | 179.4 |
| C | 15 | 231 | 462462 | 2573.62 | 654 | 647 | 179.4 |
| C | 15 | 174 | 190201 | 1056.35 | 654 | 647 | 179.4 |
| D | 14 | 195 | 378711 | 2096.37 | 648 | 624 | 180.4 |
| D | 2 | 249 | 253212 | 1400.51 | 648 | 624 | 180.4 |
| D | 2 | 163 | 240134 | 1328.0 | 648 | 624 | 180.4 |
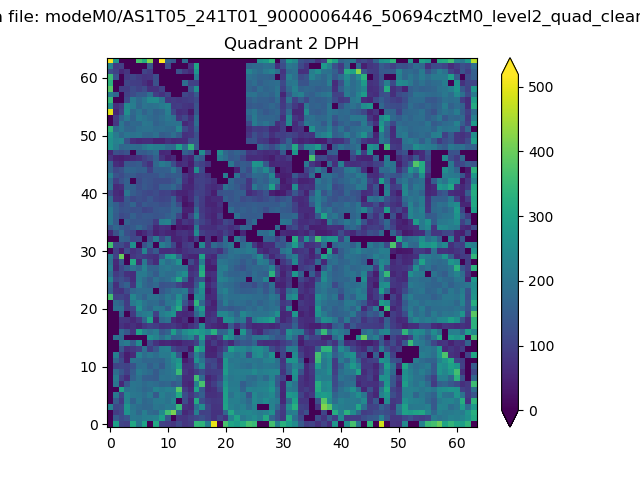
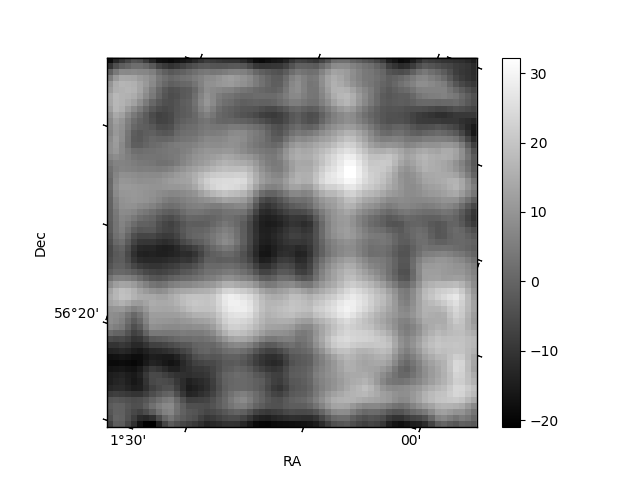
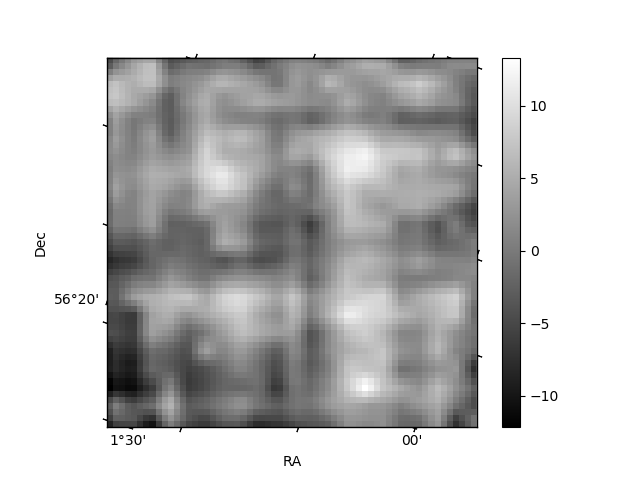
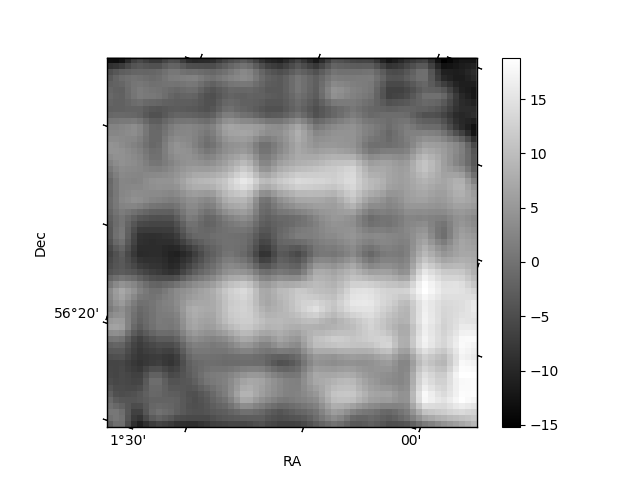
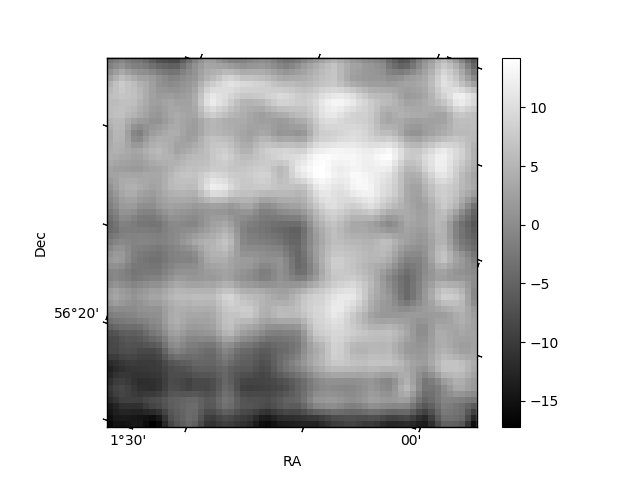
Histogram calculated using DETX and DETY for each event in the final _common_clean file
| Quadrant A | 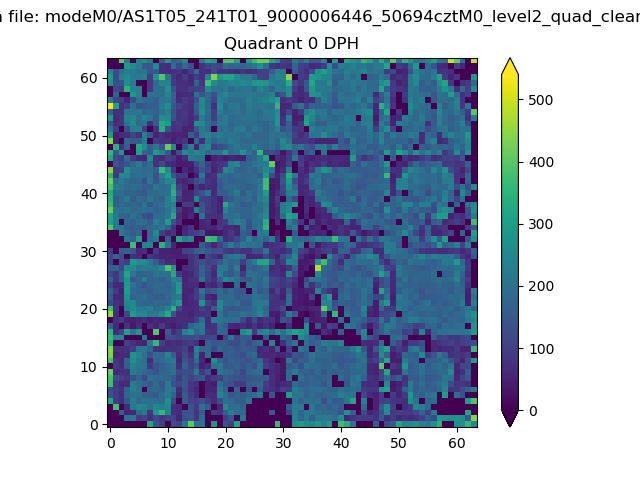 |
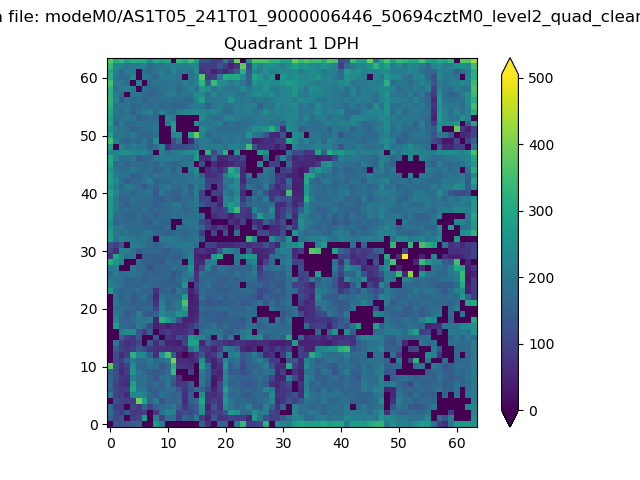 |
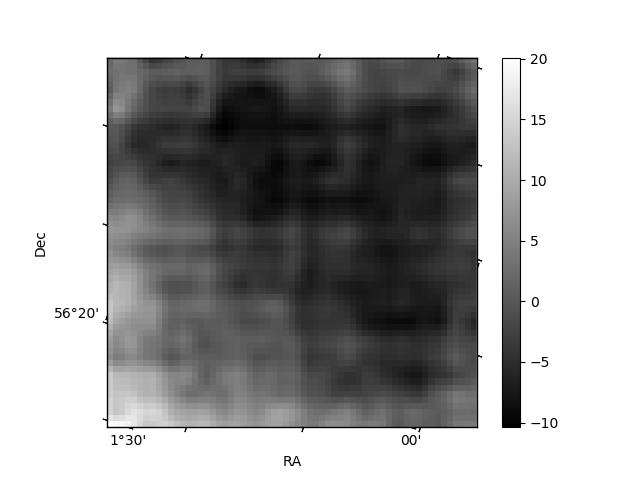
Quadrant B |
|---|---|---|---|
| Quadrant D | 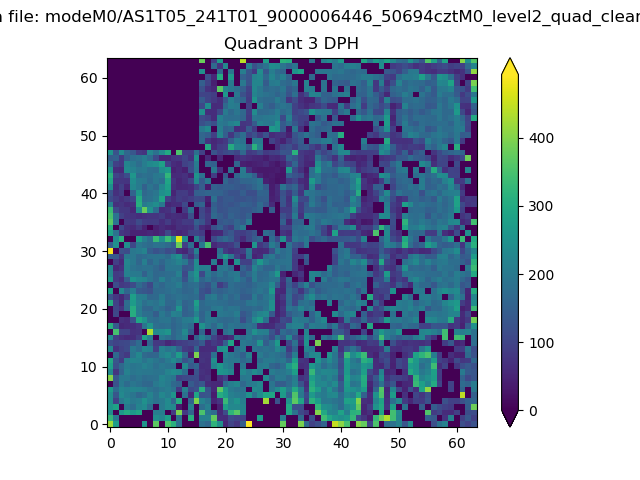 |
 |
Quadrant C |
| Plot type | Count rate plots | Images |
|---|---|---|
| Comparison with Poisson distribution Blue bars denote a histogram of data divided into 1 sec bins. Red curve is a Poisson curve with rate = median count rate of data. |
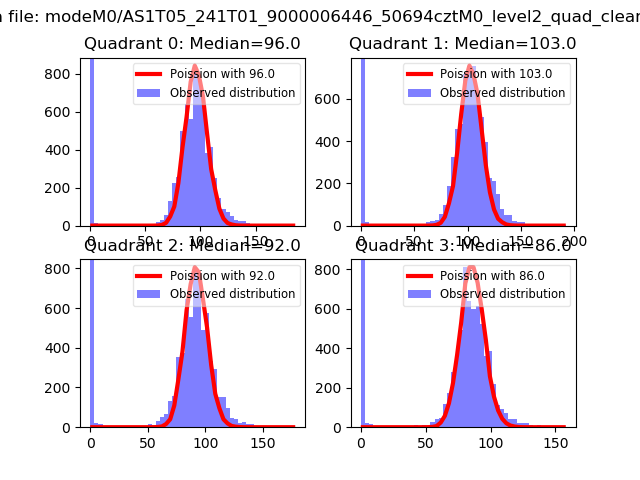 |
 |
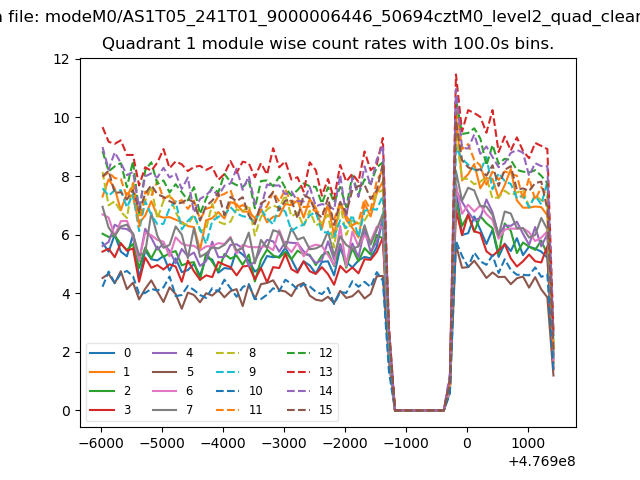
| Quadrant-wise count rates Data is divided into 100 sec bins |
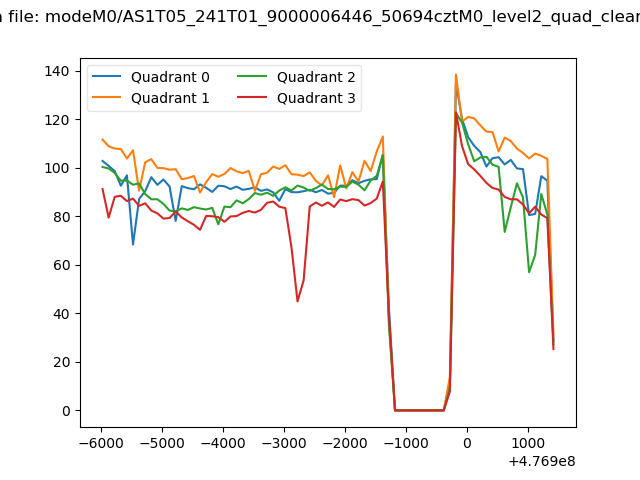 |
|
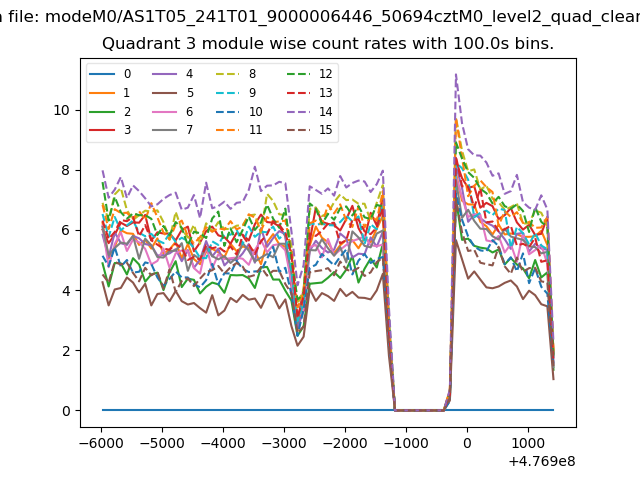
| Module-wise count rates for Quadrant A Data is divided into 100 sec bins |
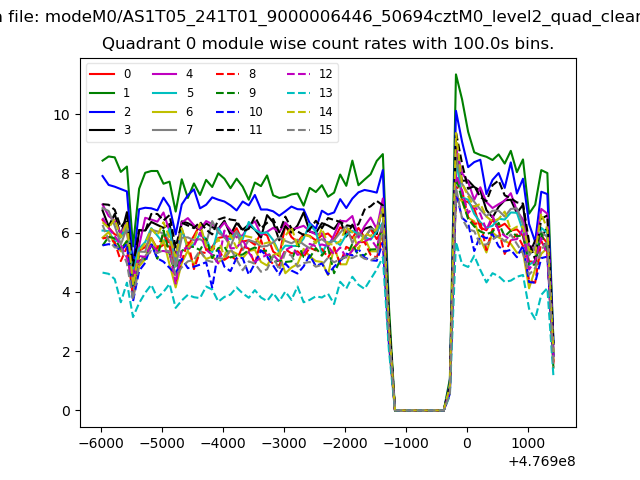 |
 |
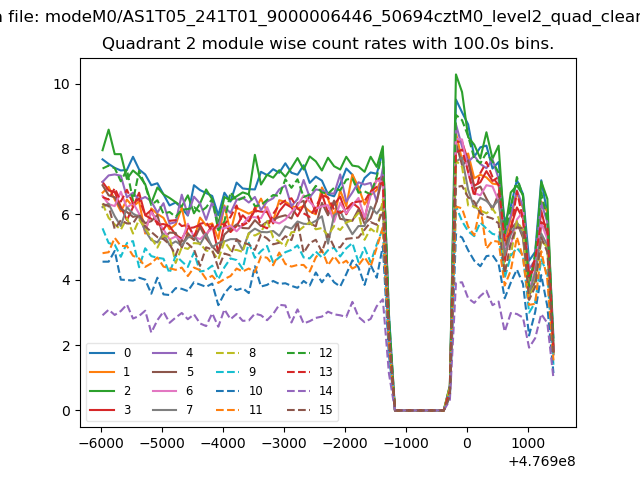
| Module-wise count rates for Quadrant B Data is divided into 100 sec bins |
 |
 |
| Module-wise count rates for Quadrant C Data is divided into 100 sec bins |
 |
 |
| Module-wise count rates for Quadrant D Data is divided into 100 sec bins |
 |
 |
| Parameter | Plot |
|---|---|
| CZT HV Monitor |  |
| D_VDD |  |
| Temperature 1 | 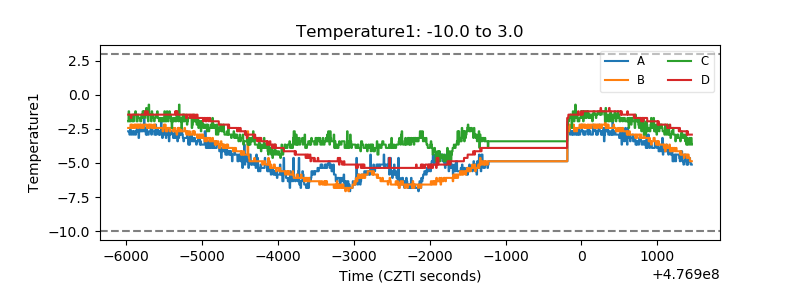 |
| Veto HV Monitor | 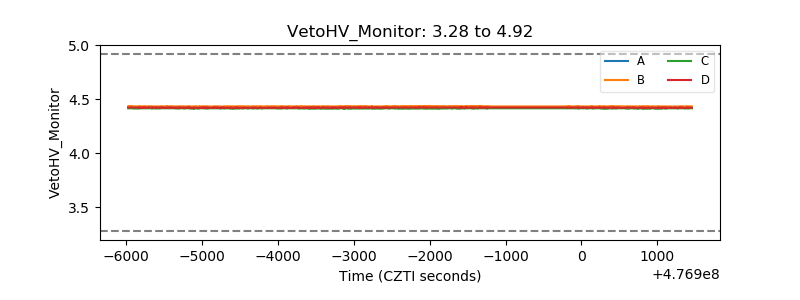 |
| Veto LLD | 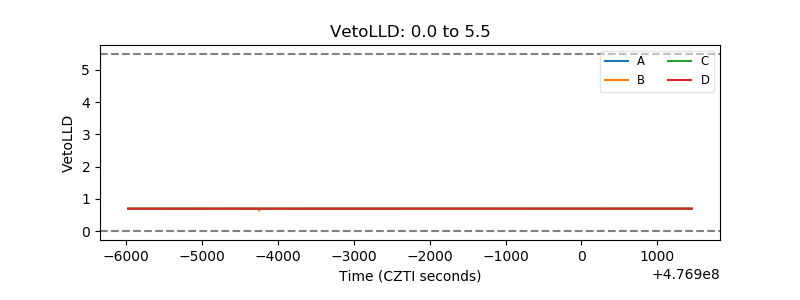 |
| Alpha Counter | 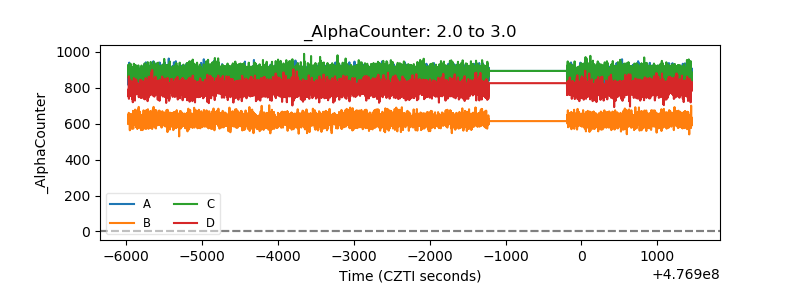 |
| _CPM_Rate | 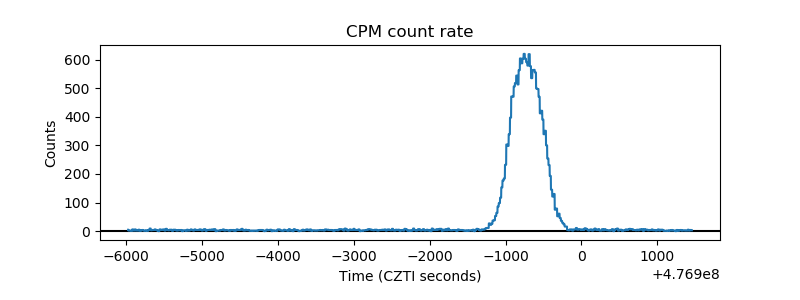 |
| CZT Counter | 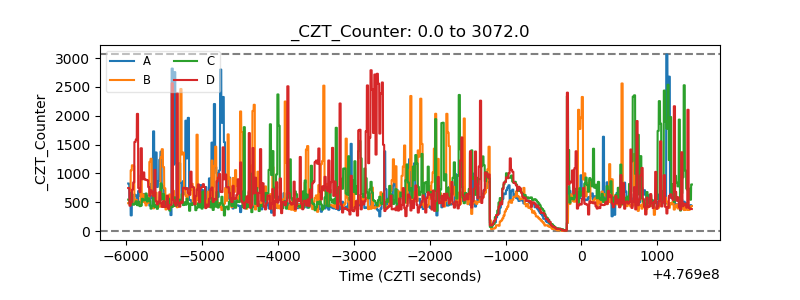 |
| +2.5 Volts monitor | 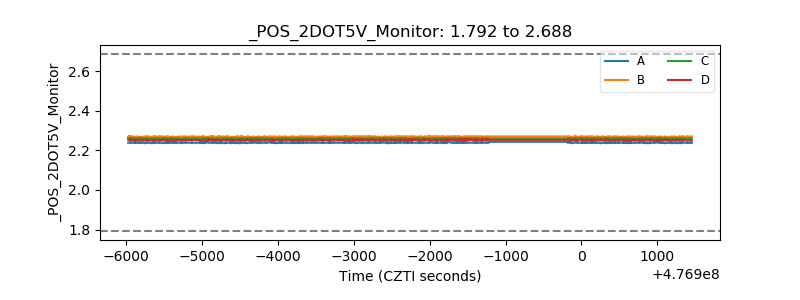 |
| +5 Volts monitor | 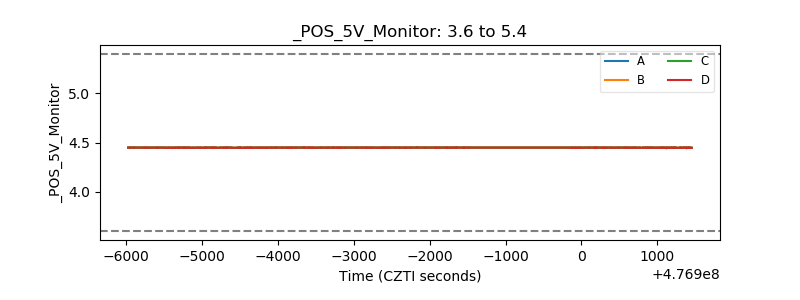 |
| _ROLL_ROT | 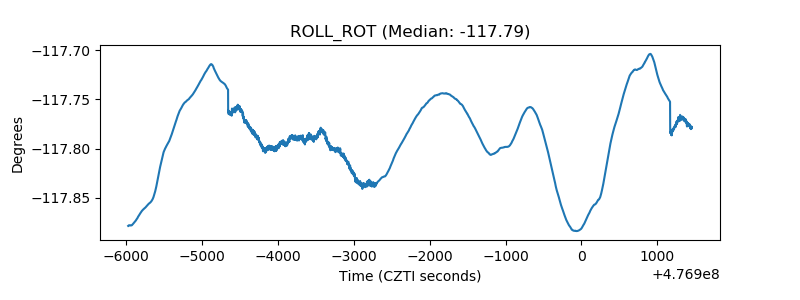 |
| _Roll_DEC | 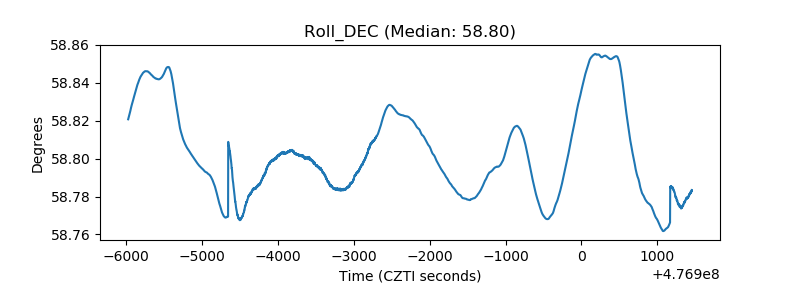 |
| _Roll_RA | 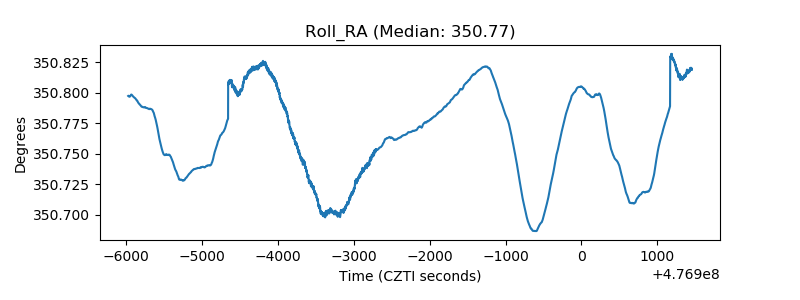 |
| Veto Counter | 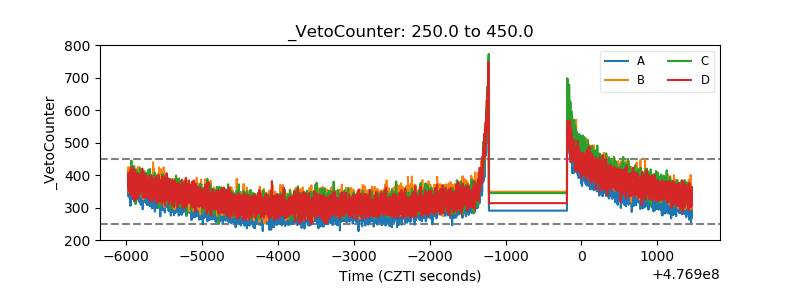 |