| Param | Original file | Final file |
|---|---|---|
| Filename | modeM0/AS1T05_241T01_9000006446_50695cztM0_level2.fits | modeM0/AS1T05_241T01_9000006446_50695cztM0_level2_quad_clean.evt |
| Size (bytes) | 466,070,400 | 93,767,040 |
| Size | 444.5 MB | 89.4 MB |
| Events in quadrant A | 4,113,224 | 612,157 |
| Events in quadrant B | 3,344,360 | 674,359 |
| Events in quadrant C | 5,138,257 | 557,079 |
| Events in quadrant D | 4,162,173 | 552,342 |
| Mode M9 | |||
|---|---|---|---|
| Quadrant | BADHDUFLAG | Total packets | Discarded packets |
| A | 0 | 12 | 0 |
| B | 0 | 12 | 0 |
| C | 0 | 12 | 0 |
| D | 0 | 12 | 0 |
| Mode M0 | |||
|---|---|---|---|
| Quadrant | BADHDUFLAG | Total packets | Discarded packets |
| A | 0 | 16382 | 1 |
| B | 0 | 14446 | 2 |
| C | 0 | 19574 | 1 |
| D | 0 | 16816 | 1 |
| Mode SS | |||
|---|---|---|---|
| Quadrant | BADHDUFLAG | Total packets | Discarded packets |
| A | 0 | 126 | 0 |
| B | 0 | 126 | 0 |
| C | 0 | 126 | 0 |
| D | 0 | 126 | 0 |
| Quadrant | Total seconds | Saturated seconds | Saturation percentage |
|---|---|---|---|
| A | 6362 | 189 | 2.970764% |
| B | 6361 | 110 | 1.729288% |
| C | 6362 | 655 | 10.295505% |
| D | 6362 | 271 | 4.259667% |
Noise dominated data is calculated using 1-second bins in cleaned event files. If a bin has >2000 counts, and if more than 50% of those come from <1% of pixels, then it is considered to be noise-dominated and hence unusable.
| Quadrant | # 1 sec bins | Bins with >0 counts | Bins with >2000 counts | High rate bins dominated by noise | Noise dominated (total time) | Noise dominated (detector-on time) | Marked lightcurve |
|---|---|---|---|---|---|---|---|
| A | 7487 | 6363 | 154 | 154 | 2.06% | 2.42% | 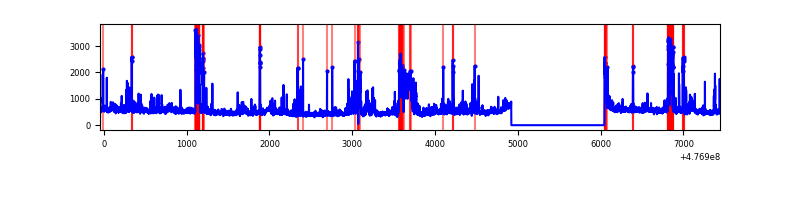 |
| B | 7486 | 6362 | 54 | 54 | 0.72% | 0.85% | 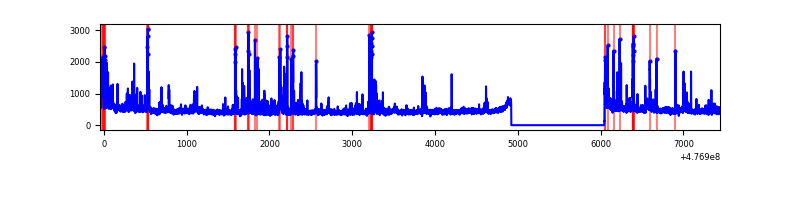 |
| C | 7487 | 6363 | 505 | 505 | 6.75% | 7.94% | 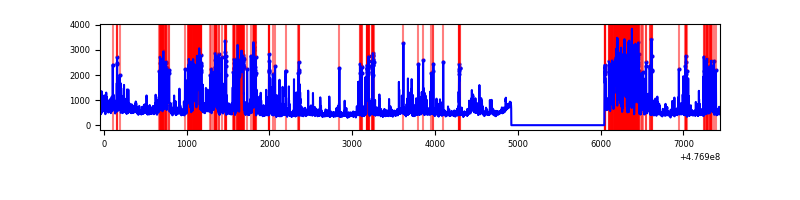 |
| D | 7487 | 6363 | 217 | 217 | 2.90% | 3.41% | 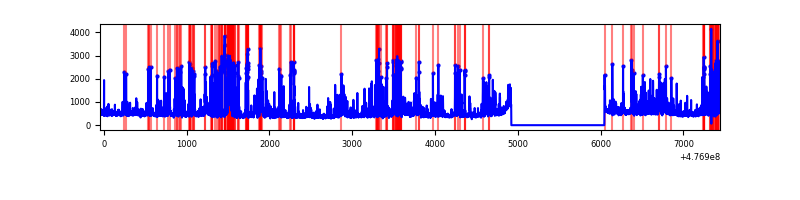 |
Top three noisy pixels from each quadrant. If the there are fewer than three noisy pixels in the level2.evt file, extra rows are filled as -1
| Pixel properties | Quadrant properties | ||||||
|---|---|---|---|---|---|---|---|
| Quadrant | DetID | PixID | Counts | Sigma | Mean | Median | Sigma |
| A | 4 | 3 | 406801 | 2439.78 | 674 | 659 | 166.5 |
| A | 12 | 80 | 365166 | 2189.67 | 674 | 659 | 166.5 |
| A | 8 | 38 | 289582 | 1735.62 | 674 | 659 | 166.5 |
| B | 5 | 172 | 176056 | 1226.37 | 679 | 657 | 143.0 |
| B | 5 | 185 | 57830 | 399.75 | 679 | 657 | 143.0 |
| B | 7 | 252 | 53652 | 370.54 | 679 | 657 | 143.0 |
| C | 15 | 231 | 1601054 | 9081.64 | 644 | 639 | 176.2 |
| C | 13 | 113 | 291636 | 1651.28 | 644 | 639 | 176.2 |
| C | 13 | 3 | 153074 | 865.0 | 644 | 639 | 176.2 |
| D | 2 | 249 | 312774 | 1718.41 | 659 | 635 | 181.6 |
| D | 7 | 96 | 175026 | 960.07 | 659 | 635 | 181.6 |
| D | 15 | 108 | 153835 | 843.41 | 659 | 635 | 181.6 |
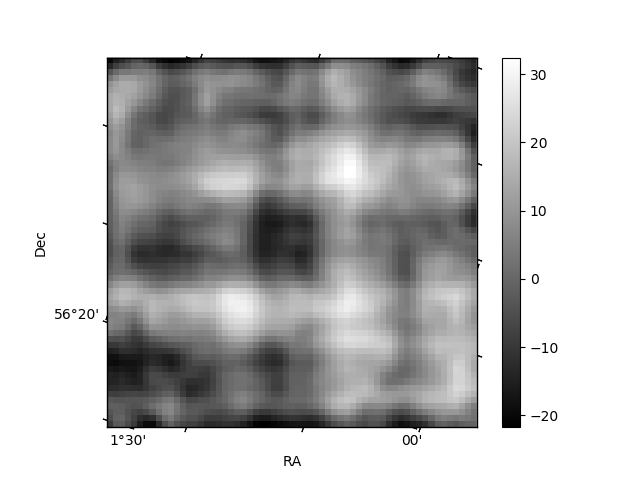
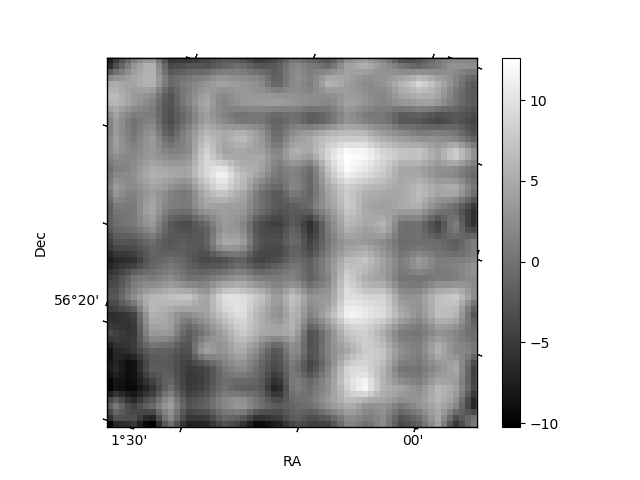
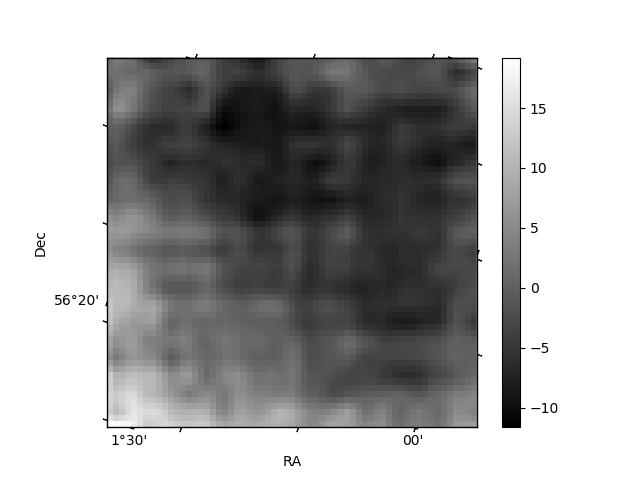
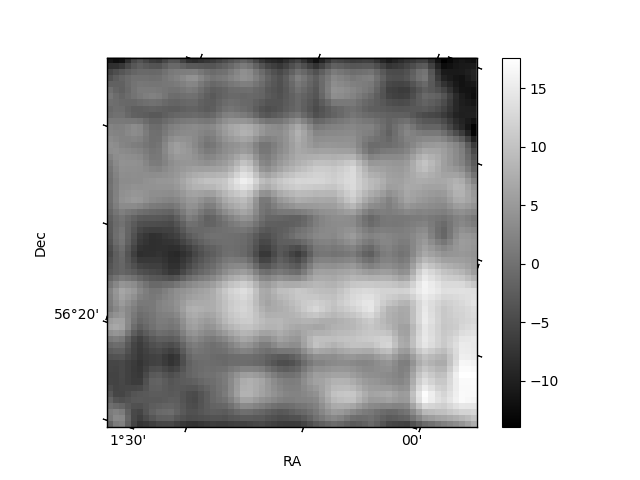
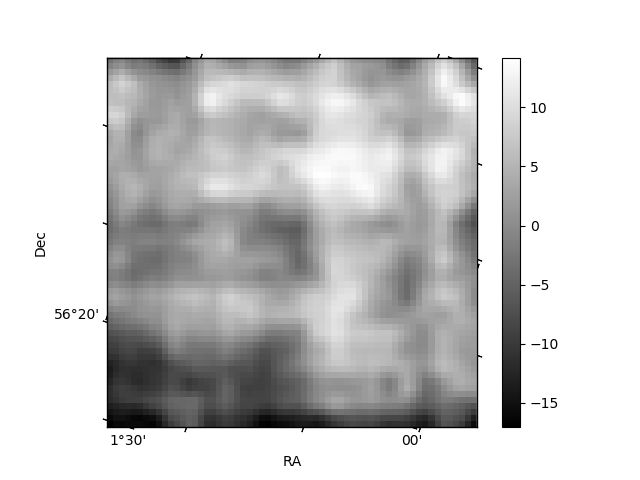
Histogram calculated using DETX and DETY for each event in the final _common_clean file
| Quadrant A | 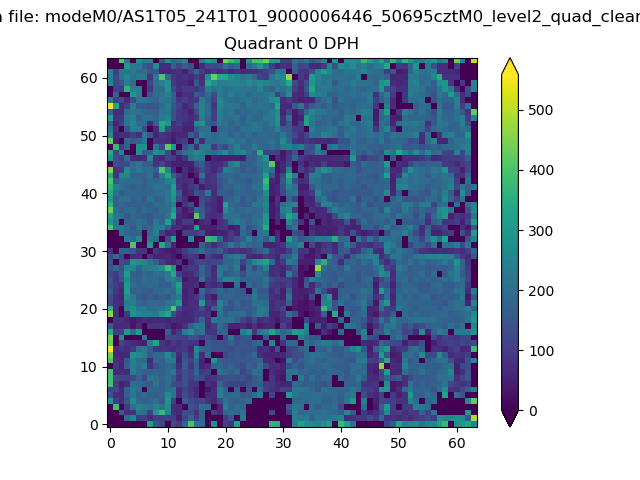 |
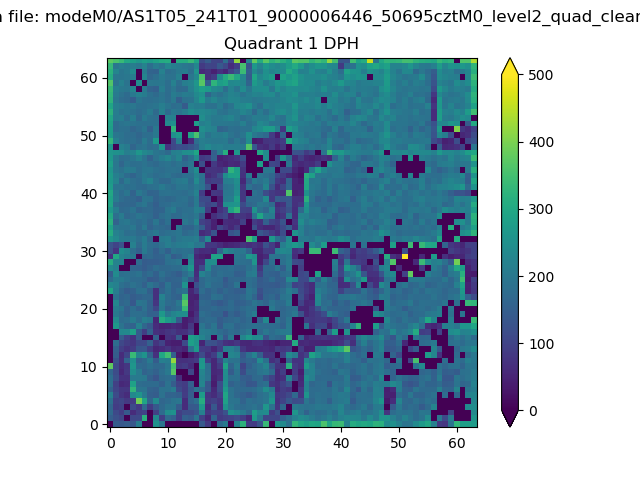 |
Quadrant B |
|---|---|---|---|
| Quadrant D | 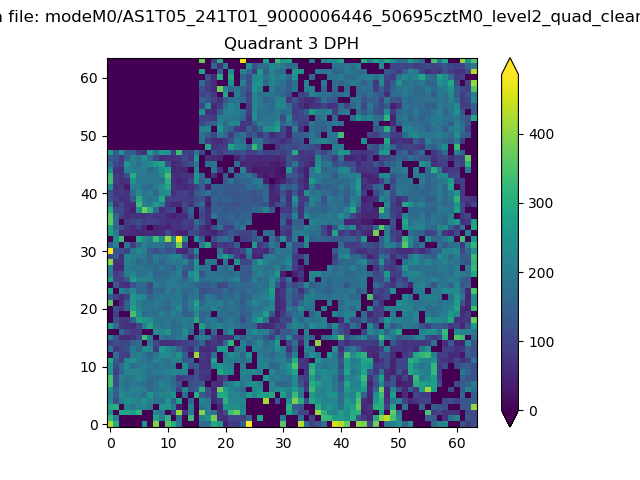 |
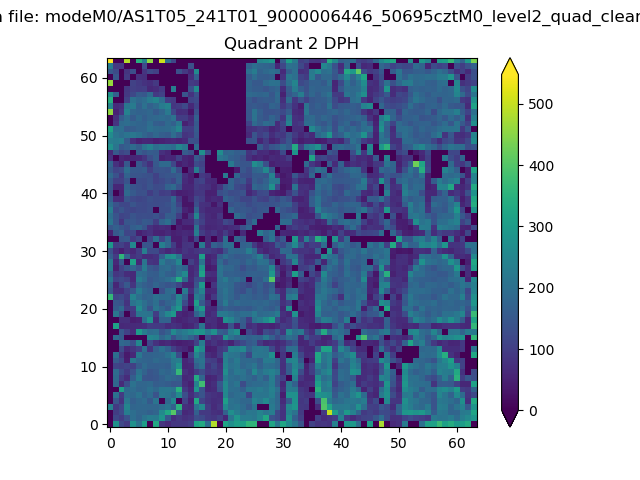 |
Quadrant C |
| Plot type | Count rate plots | Images |
|---|---|---|
| Comparison with Poisson distribution Blue bars denote a histogram of data divided into 1 sec bins. Red curve is a Poisson curve with rate = median count rate of data. |
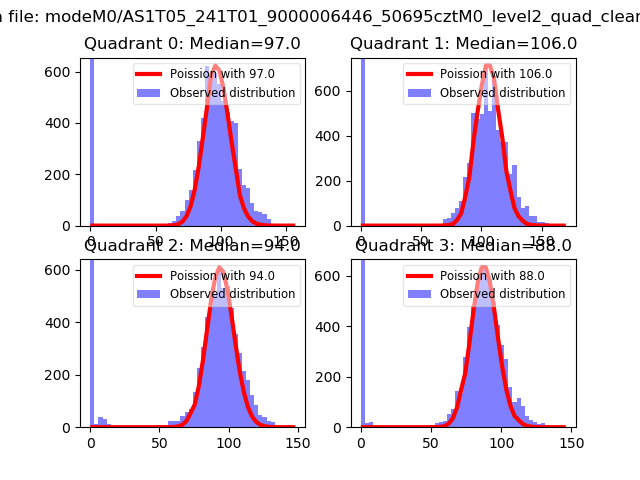 |
 |
| Quadrant-wise count rates Data is divided into 100 sec bins |
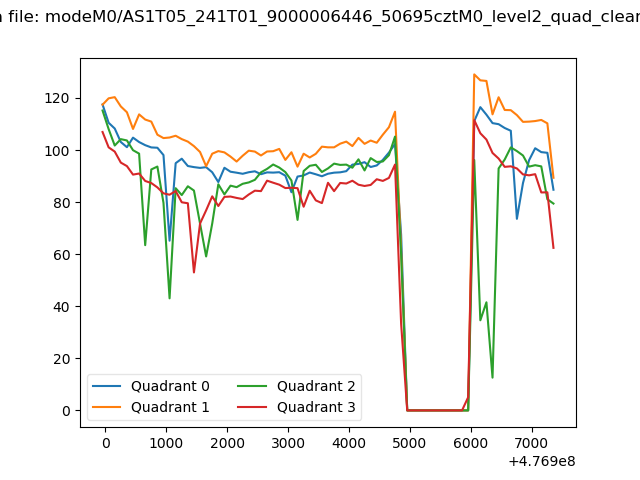 |
|
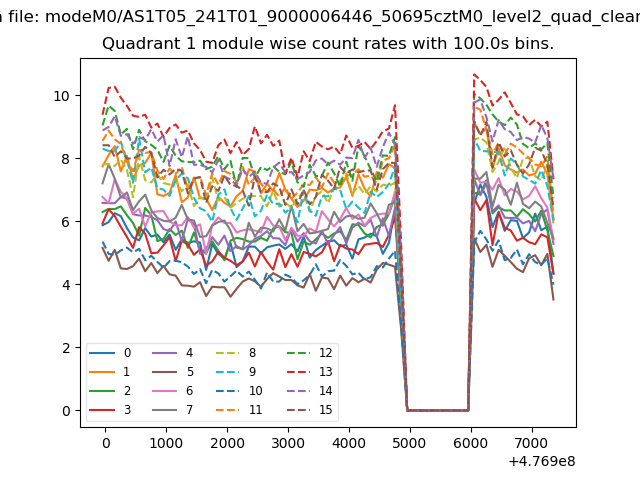
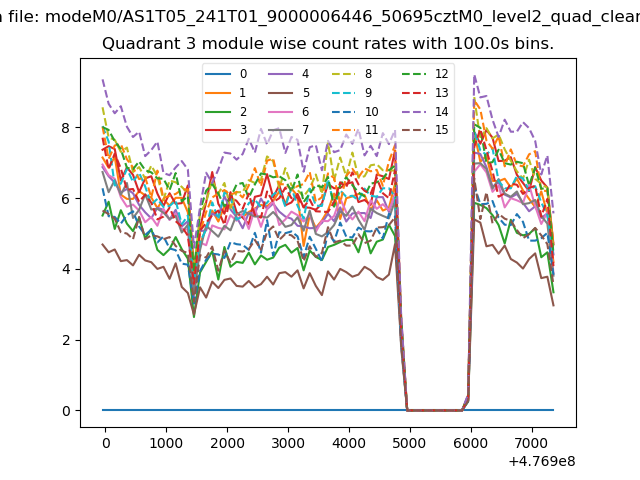
| Module-wise count rates for Quadrant A Data is divided into 100 sec bins |
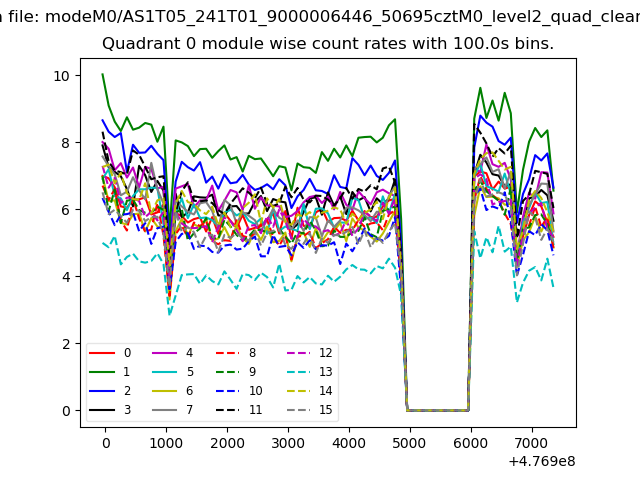 |
 |
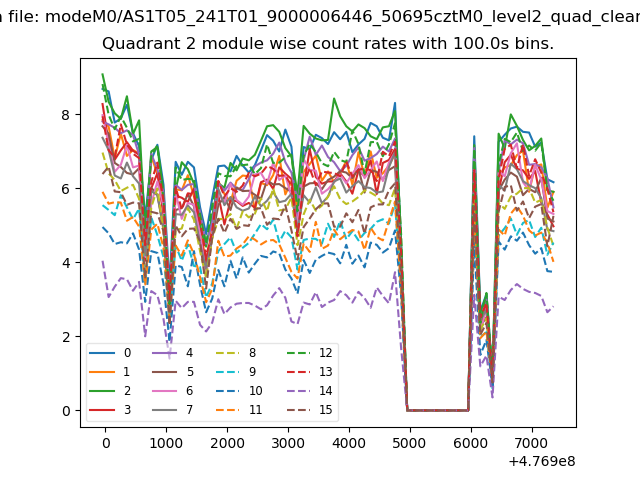
| Module-wise count rates for Quadrant B Data is divided into 100 sec bins |
 |
 |
| Module-wise count rates for Quadrant C Data is divided into 100 sec bins |
 |
 |
| Module-wise count rates for Quadrant D Data is divided into 100 sec bins |
 |
 |
| Parameter | Plot |
|---|---|
| CZT HV Monitor | 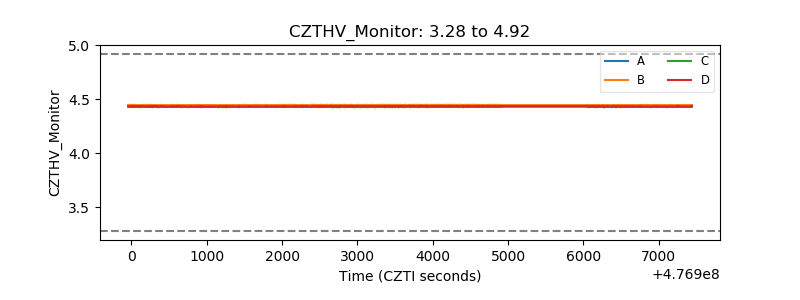 |
| D_VDD | 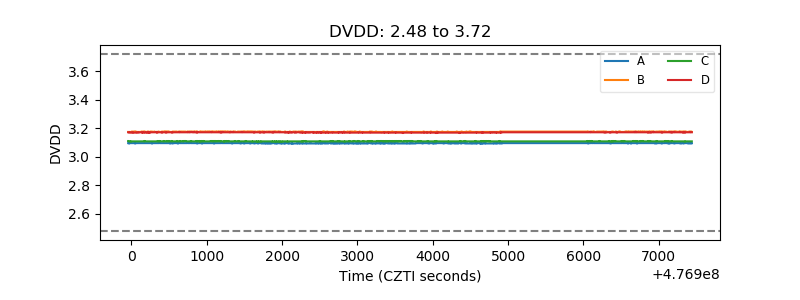 |
| Temperature 1 | 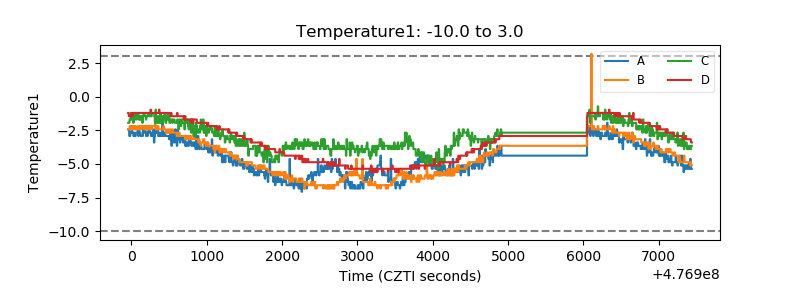 |
| Veto HV Monitor | 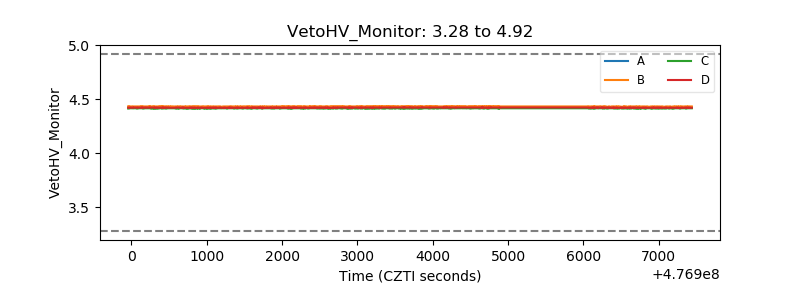 |
| Veto LLD | 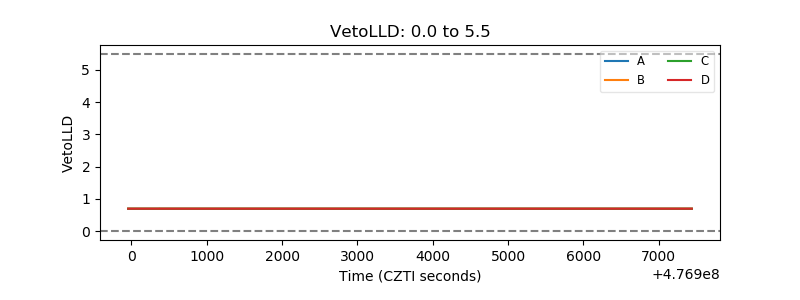 |
| Alpha Counter | 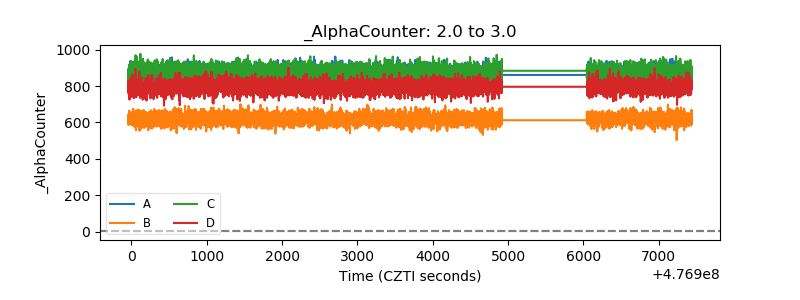 |
| _CPM_Rate | 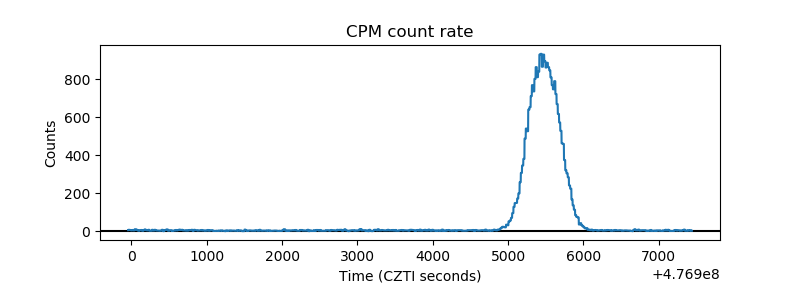 |
| CZT Counter | 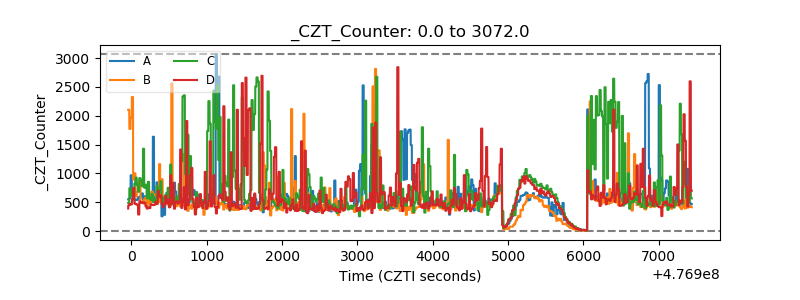 |
| +2.5 Volts monitor | 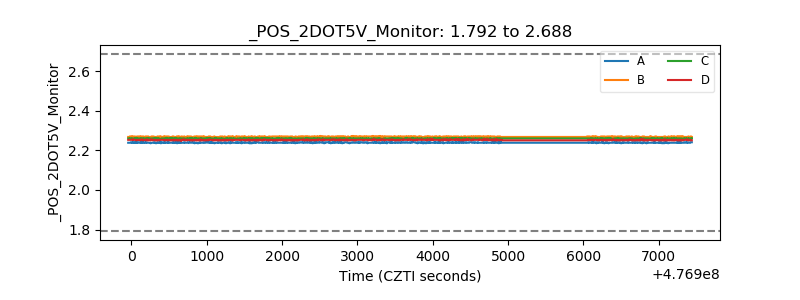 |
| +5 Volts monitor | 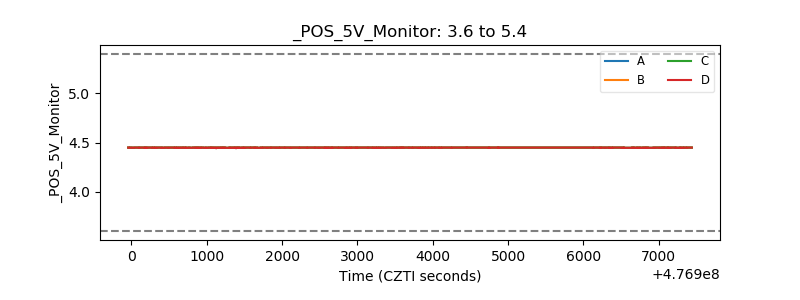 |
| _ROLL_ROT | 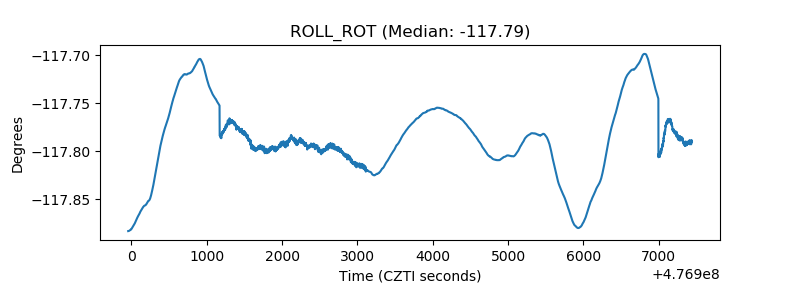 |
| _Roll_DEC | 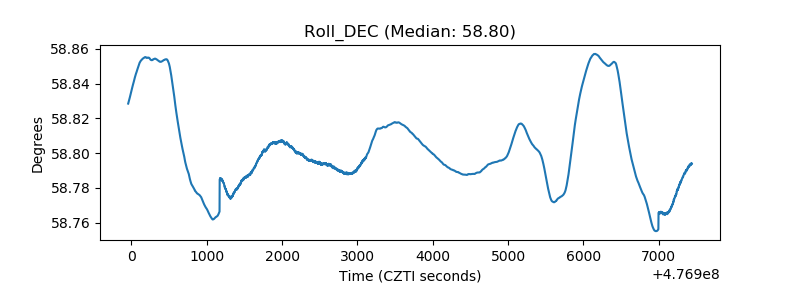 |
| _Roll_RA | 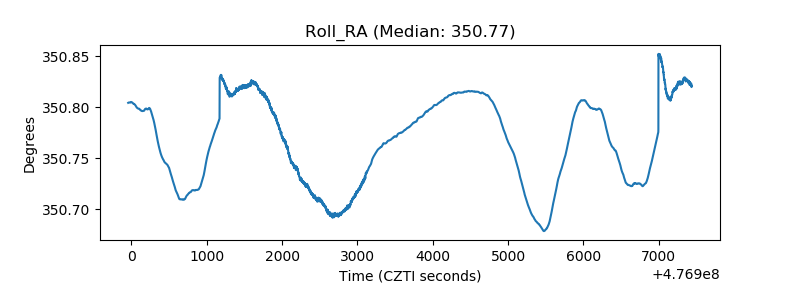 |
| Veto Counter | 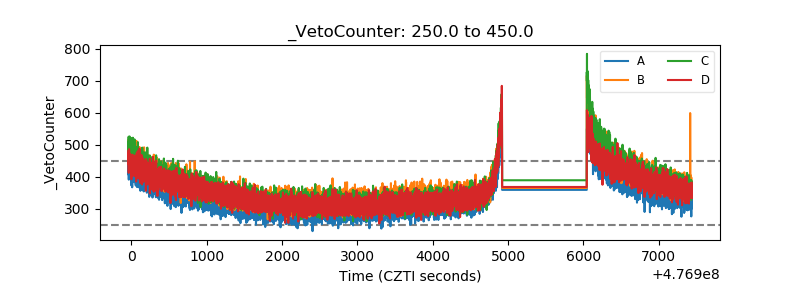 |