| Param | Original file | Final file |
|---|---|---|
| Filename | modeM0/AS1T05_241T01_9000006446_50696cztM0_level2.fits | modeM0/AS1T05_241T01_9000006446_50696cztM0_level2_quad_clean.evt |
| Size (bytes) | 530,377,920 | 94,083,840 |
| Size | 505.8 MB | 89.7 MB |
| Events in quadrant A | 5,241,430 | 604,691 |
| Events in quadrant B | 3,632,896 | 686,246 |
| Events in quadrant C | 5,272,308 | 562,610 |
| Events in quadrant D | 4,988,820 | 548,460 |
| Mode M9 | |||
|---|---|---|---|
| Quadrant | BADHDUFLAG | Total packets | Discarded packets |
| A | 0 | 14 | 0 |
| B | 0 | 15 | 0 |
| C | 0 | 15 | 0 |
| D | 0 | 15 | 0 |
| Mode M0 | |||
|---|---|---|---|
| Quadrant | BADHDUFLAG | Total packets | Discarded packets |
| A | 0 | 19800 | 2 |
| B | 0 | 15268 | 3 |
| C | 0 | 19933 | 2 |
| D | 0 | 19314 | 2 |
| Mode SS | |||
|---|---|---|---|
| Quadrant | BADHDUFLAG | Total packets | Discarded packets |
| A | 0 | 128 | 0 |
| B | 0 | 128 | 0 |
| C | 0 | 128 | 0 |
| D | 0 | 128 | 0 |
| Quadrant | Total seconds | Saturated seconds | Saturation percentage |
|---|---|---|---|
| A | 6409 | 455 | 7.099391% |
| B | 6408 | 160 | 2.496879% |
| C | 6408 | 719 | 11.220350% |
| D | 6408 | 482 | 7.521848% |
Noise dominated data is calculated using 1-second bins in cleaned event files. If a bin has >2000 counts, and if more than 50% of those come from <1% of pixels, then it is considered to be noise-dominated and hence unusable.
| Quadrant | # 1 sec bins | Bins with >0 counts | Bins with >2000 counts | High rate bins dominated by noise | Noise dominated (total time) | Noise dominated (detector-on time) | Marked lightcurve |
|---|---|---|---|---|---|---|---|
| A | 7564 | 6410 | 457 | 457 | 6.04% | 7.13% | 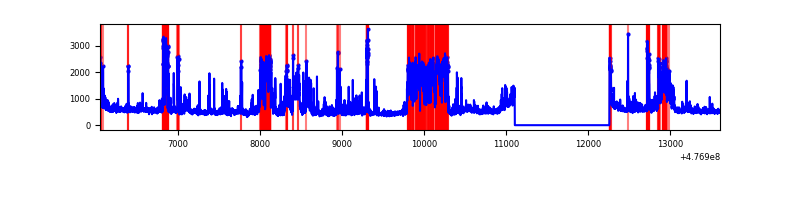 |
| B | 7563 | 6409 | 64 | 64 | 0.85% | 1.00% | 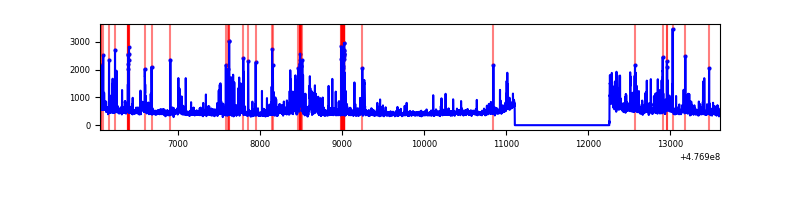 |
| C | 7563 | 6409 | 536 | 536 | 7.09% | 8.36% | 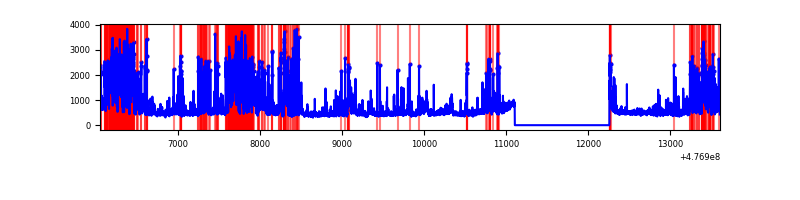 |
| D | 7563 | 6409 | 412 | 412 | 5.45% | 6.43% | 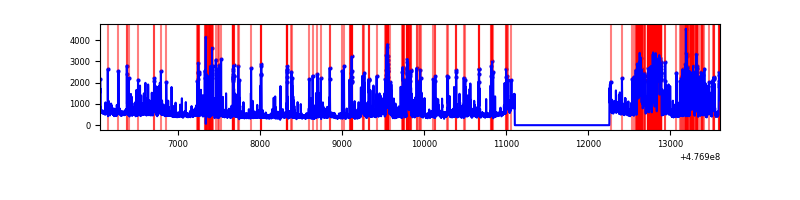 |
Top three noisy pixels from each quadrant. If the there are fewer than three noisy pixels in the level2.evt file, extra rows are filled as -1
| Pixel properties | Quadrant properties | ||||||
|---|---|---|---|---|---|---|---|
| Quadrant | DetID | PixID | Counts | Sigma | Mean | Median | Sigma |
| A | 12 | 80 | 1454711 | 8618.68 | 679 | 662 | 168.7 |
| A | 4 | 3 | 364962 | 2159.34 | 679 | 662 | 168.7 |
| A | 8 | 38 | 188593 | 1113.94 | 679 | 662 | 168.7 |
| B | 4 | 170 | 144700 | 982.94 | 692 | 670 | 146.5 |
| B | 10 | 254 | 143057 | 971.73 | 692 | 670 | 146.5 |
| B | 5 | 172 | 103649 | 702.79 | 692 | 670 | 146.5 |
| C | 15 | 231 | 1349833 | 7533.03 | 655 | 648 | 179.1 |
| C | 4 | 5 | 415982 | 2318.97 | 655 | 648 | 179.1 |
| C | 13 | 3 | 234756 | 1307.12 | 655 | 648 | 179.1 |
| D | 11 | 245 | 519877 | 2794.29 | 664 | 641 | 185.8 |
| D | 7 | 191 | 315059 | 1692.06 | 664 | 641 | 185.8 |
| D | 2 | 249 | 284099 | 1525.44 | 664 | 641 | 185.8 |
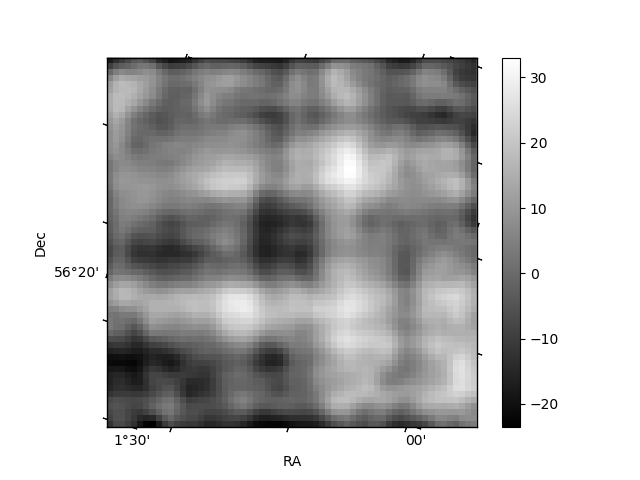
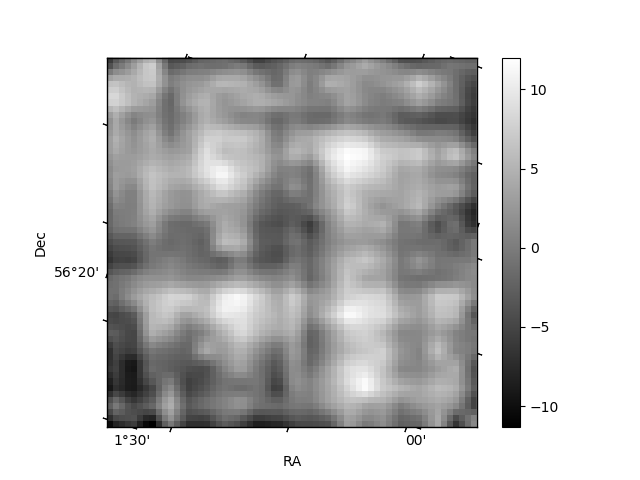
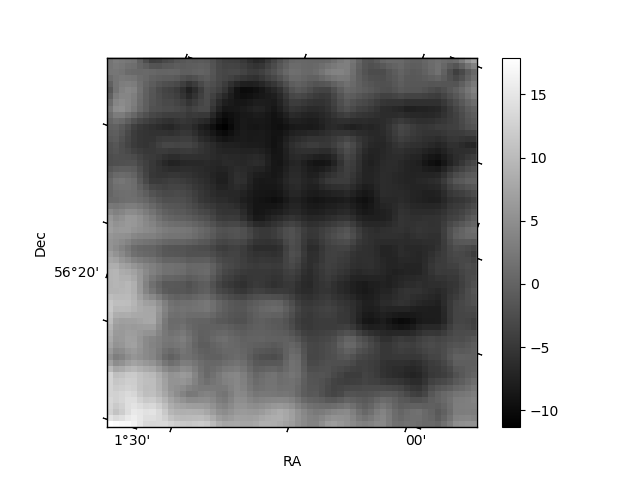
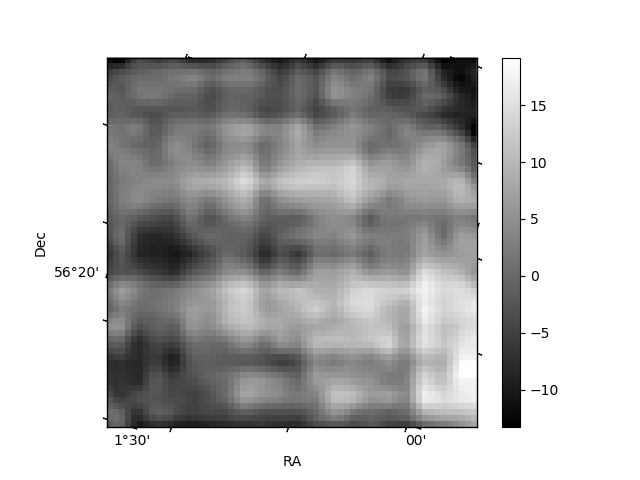
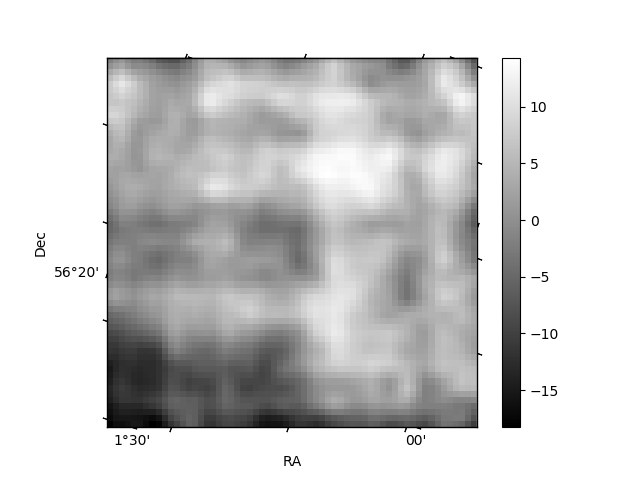
Histogram calculated using DETX and DETY for each event in the final _common_clean file
| Quadrant A | 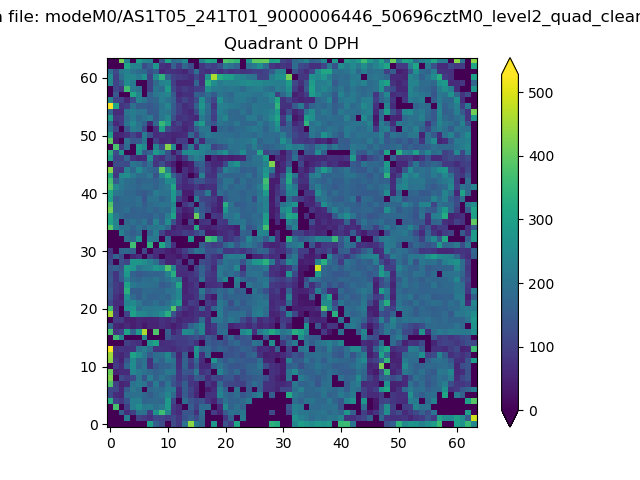 |
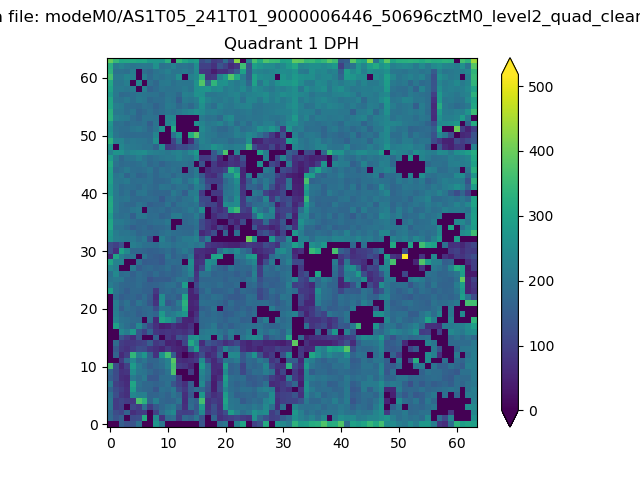 |
Quadrant B |
|---|---|---|---|
| Quadrant D | 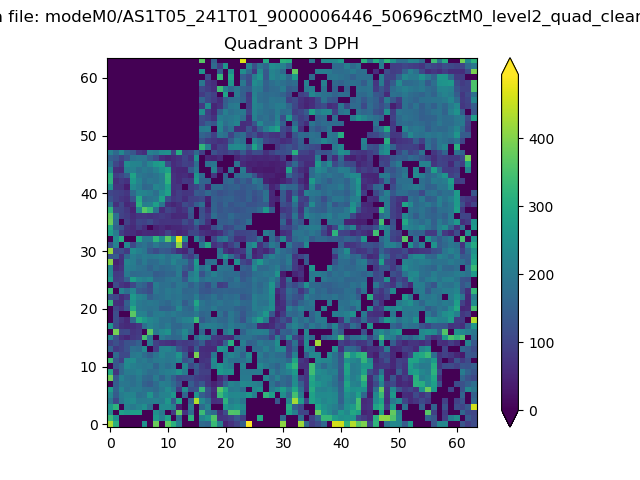 |
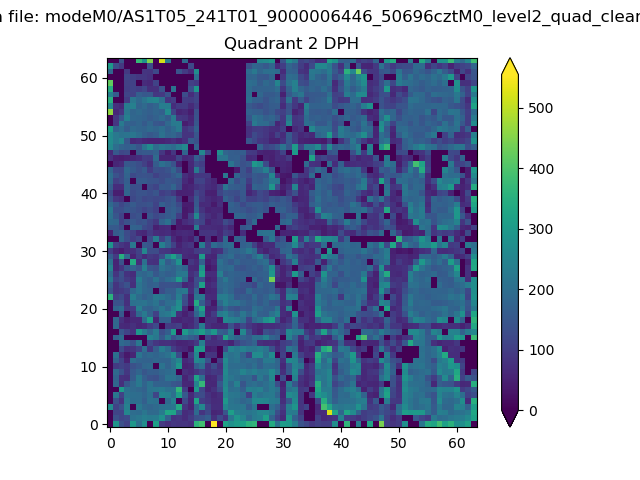 |
Quadrant C |
| Plot type | Count rate plots | Images |
|---|---|---|
| Comparison with Poisson distribution Blue bars denote a histogram of data divided into 1 sec bins. Red curve is a Poisson curve with rate = median count rate of data. |
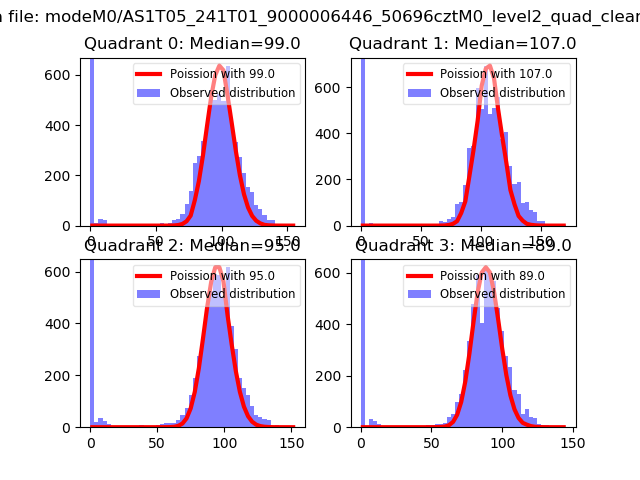 |
 |
| Quadrant-wise count rates Data is divided into 100 sec bins |
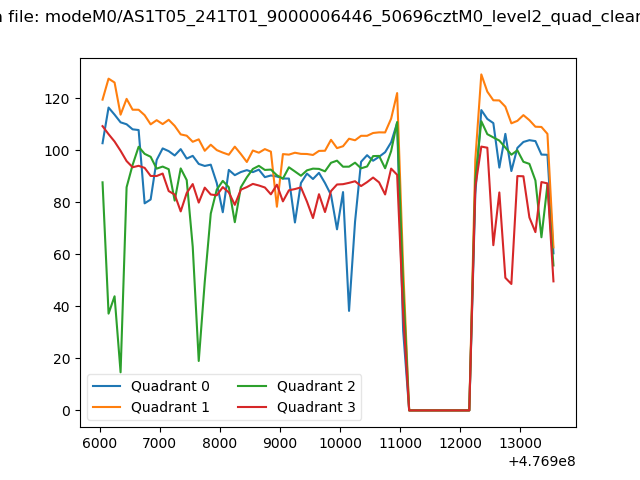 |
|
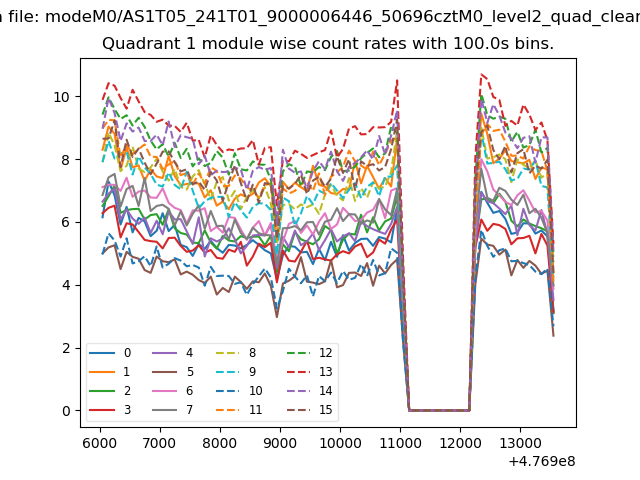
| Module-wise count rates for Quadrant A Data is divided into 100 sec bins |
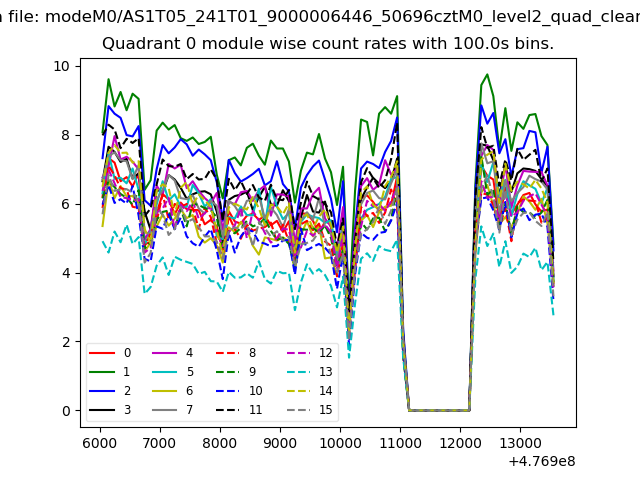 |
 |
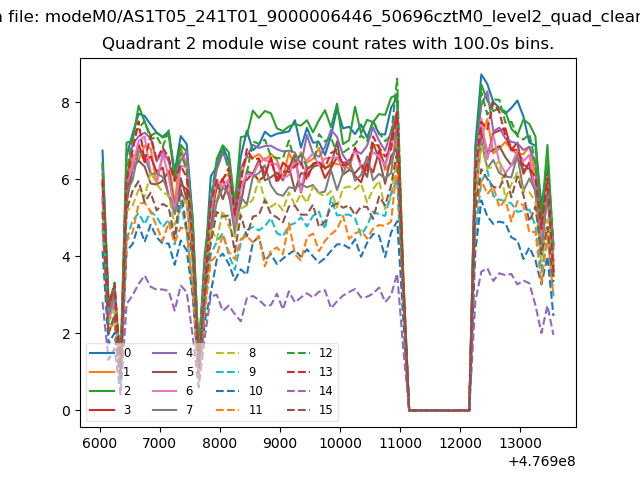
| Module-wise count rates for Quadrant B Data is divided into 100 sec bins |
 |
 |
| Module-wise count rates for Quadrant C Data is divided into 100 sec bins |
 |
 |
| Module-wise count rates for Quadrant D Data is divided into 100 sec bins |
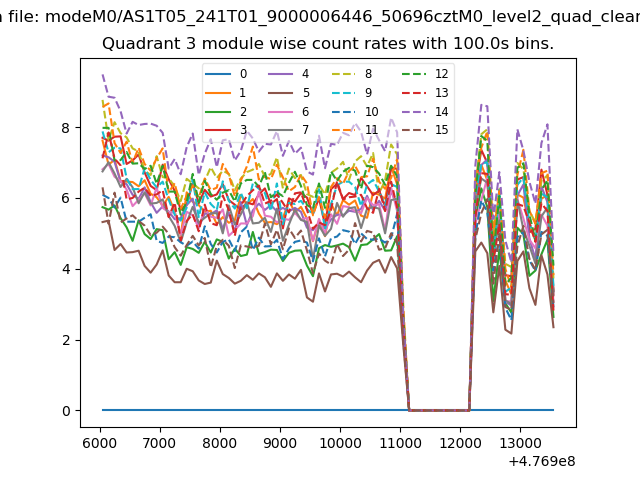 |
 |
| Parameter | Plot |
|---|---|
| CZT HV Monitor | 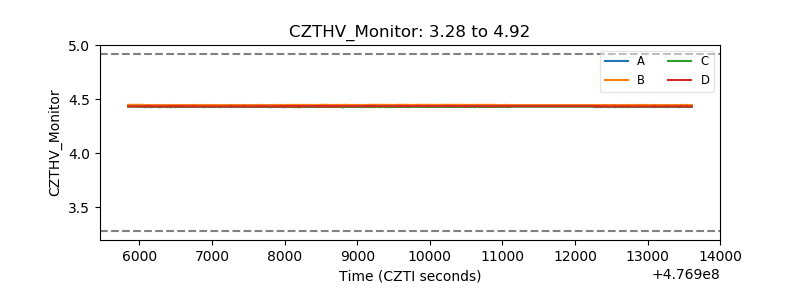 |
| D_VDD | 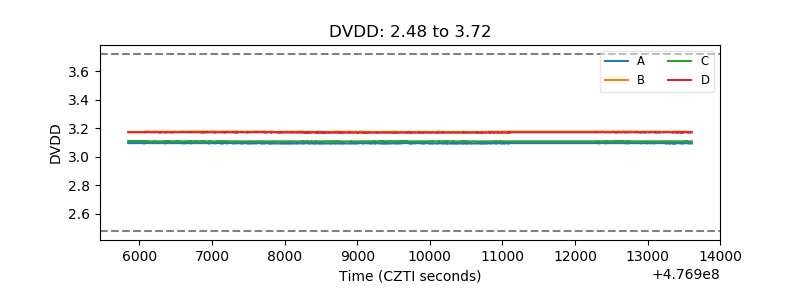 |
| Temperature 1 | 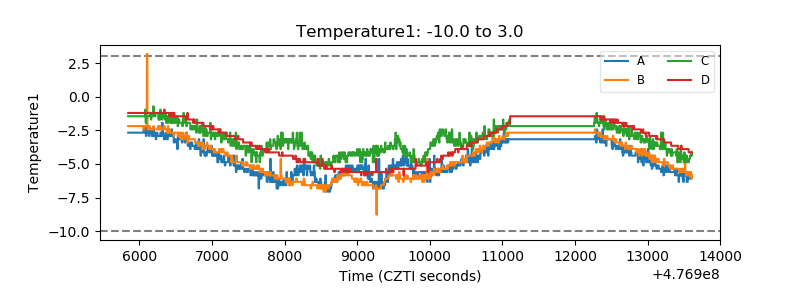 |
| Veto HV Monitor | 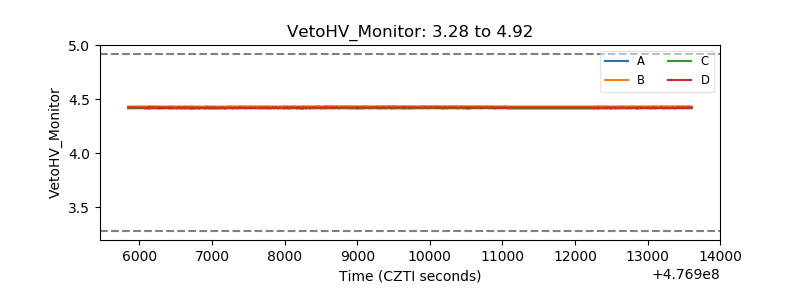 |
| Veto LLD | 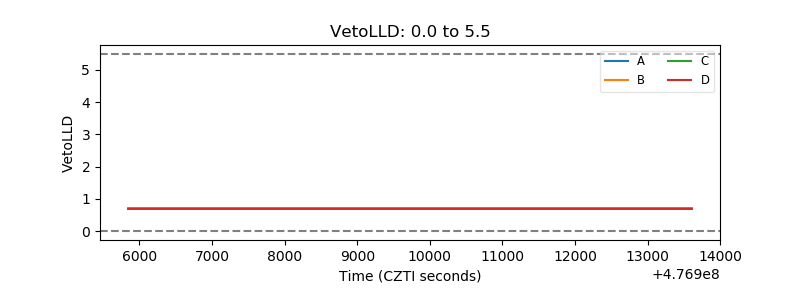 |
| Alpha Counter | 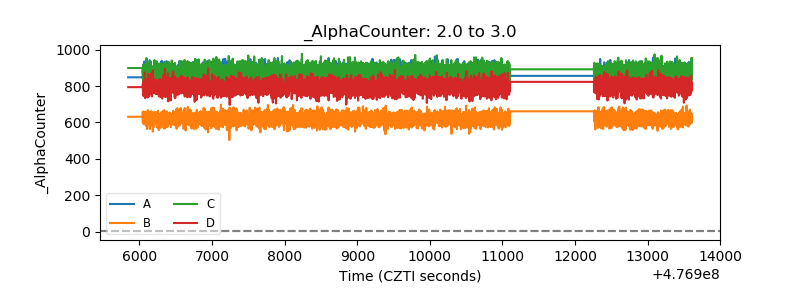 |
| _CPM_Rate | 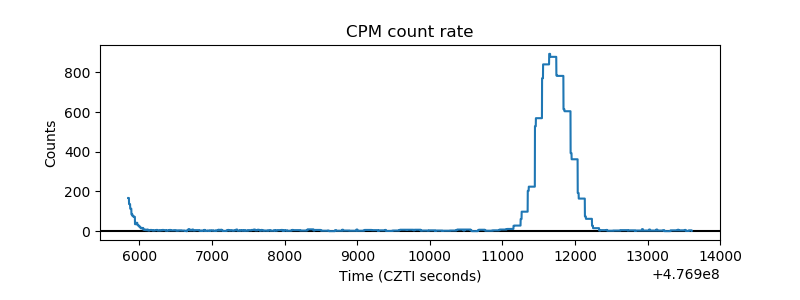 |
| CZT Counter | 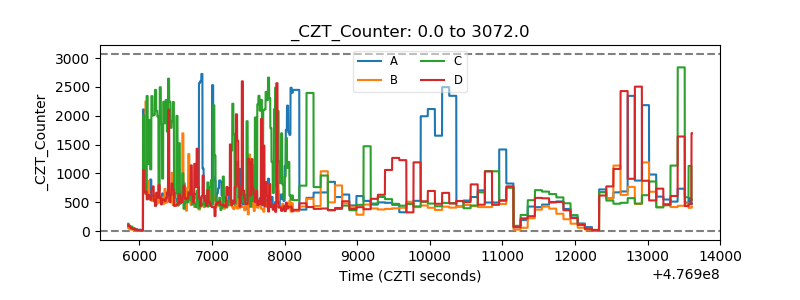 |
| +2.5 Volts monitor | 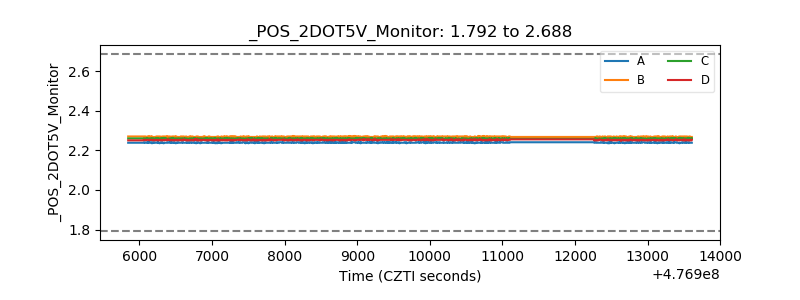 |
| +5 Volts monitor | 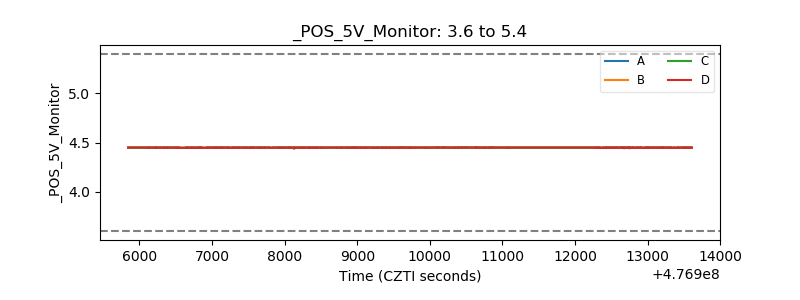 |
| _ROLL_ROT | 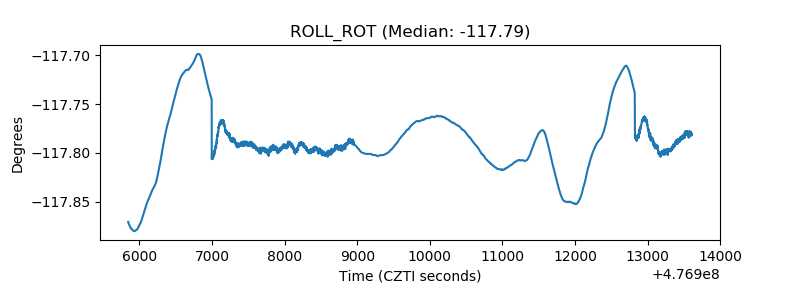 |
| _Roll_DEC | 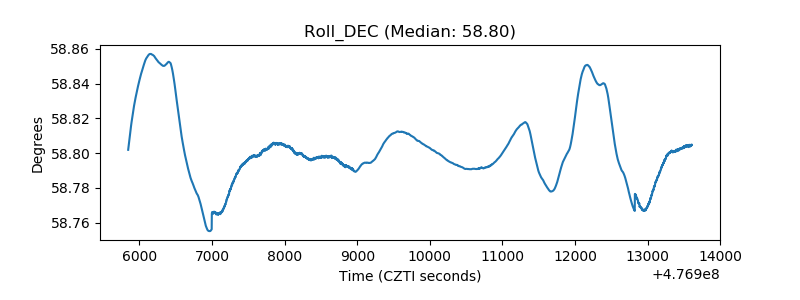 |
| _Roll_RA | 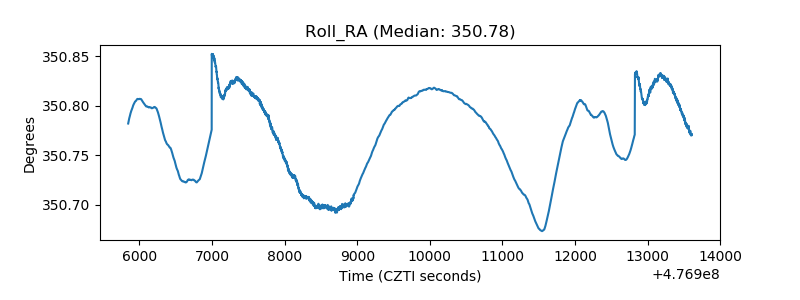 |
| Veto Counter | 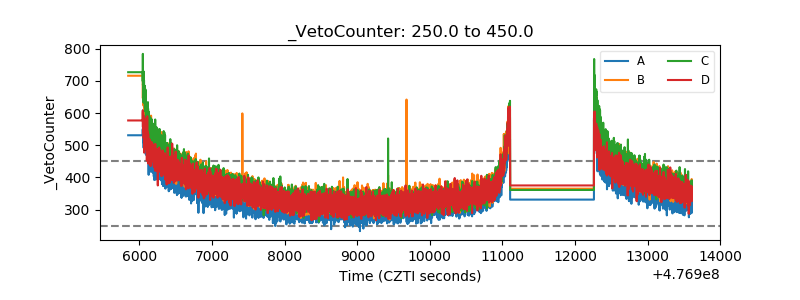 |