| Param | Original file | Final file |
|---|---|---|
| Filename | modeM0/AS1T05_241T01_9000006446_50697cztM0_level2.fits | modeM0/AS1T05_241T01_9000006446_50697cztM0_level2_quad_clean.evt |
| Size (bytes) | 516,677,760 | 94,161,600 |
| Size | 492.7 MB | 89.8 MB |
| Events in quadrant A | 4,019,478 | 618,719 |
| Events in quadrant B | 3,483,226 | 681,695 |
| Events in quadrant C | 5,119,397 | 582,371 |
| Events in quadrant D | 6,006,810 | 522,103 |
| Mode M9 | |||
|---|---|---|---|
| Quadrant | BADHDUFLAG | Total packets | Discarded packets |
| A | 0 | 19 | 0 |
| B | 0 | 19 | 0 |
| C | 0 | 20 | 0 |
| D | 0 | 20 | 0 |
| Mode M0 | |||
|---|---|---|---|
| Quadrant | BADHDUFLAG | Total packets | Discarded packets |
| A | 0 | 16032 | 2 |
| B | 0 | 14947 | 2 |
| C | 0 | 19495 | 2 |
| D | 0 | 22337 | 2 |
| Mode SS | |||
|---|---|---|---|
| Quadrant | BADHDUFLAG | Total packets | Discarded packets |
| A | 0 | 128 | 0 |
| B | 0 | 128 | 0 |
| C | 0 | 128 | 0 |
| D | 0 | 128 | 0 |
| Quadrant | Total seconds | Saturated seconds | Saturation percentage |
|---|---|---|---|
| A | 6400 | 182 | 2.843750% |
| B | 6400 | 140 | 2.187500% |
| C | 6400 | 523 | 8.171875% |
| D | 6400 | 740 | 11.562500% |
Noise dominated data is calculated using 1-second bins in cleaned event files. If a bin has >2000 counts, and if more than 50% of those come from <1% of pixels, then it is considered to be noise-dominated and hence unusable.
| Quadrant | # 1 sec bins | Bins with >0 counts | Bins with >2000 counts | High rate bins dominated by noise | Noise dominated (total time) | Noise dominated (detector-on time) | Marked lightcurve |
|---|---|---|---|---|---|---|---|
| A | 7570 | 6401 | 128 | 128 | 1.69% | 2.00% | 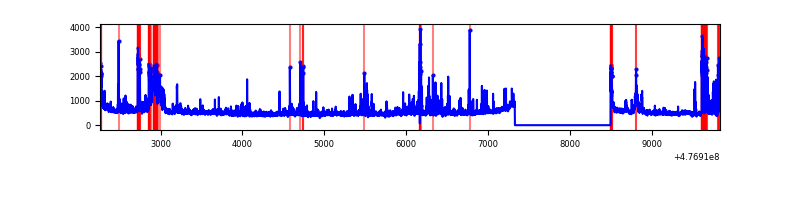 |
| B | 7570 | 6401 | 45 | 45 | 0.59% | 0.70% | 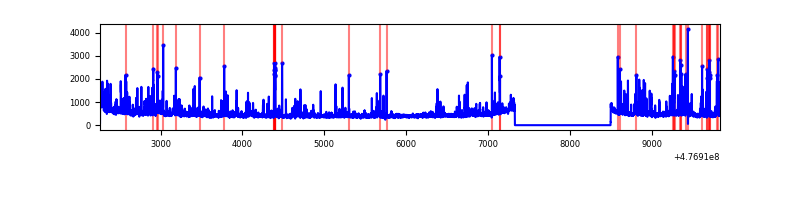 |
| C | 7570 | 6401 | 391 | 391 | 5.17% | 6.11% | 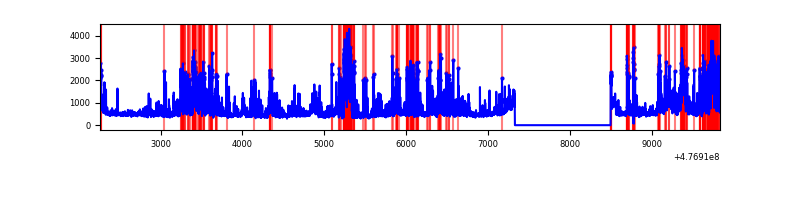 |
| D | 7570 | 6401 | 612 | 612 | 8.08% | 9.56% | 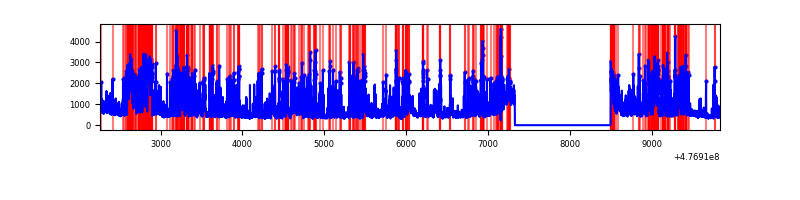 |
Top three noisy pixels from each quadrant. If the there are fewer than three noisy pixels in the level2.evt file, extra rows are filled as -1
| Pixel properties | Quadrant properties | ||||||
|---|---|---|---|---|---|---|---|
| Quadrant | DetID | PixID | Counts | Sigma | Mean | Median | Sigma |
| A | 4 | 3 | 305588 | 1812.11 | 682 | 664 | 168.3 |
| A | 12 | 80 | 189401 | 1121.63 | 682 | 664 | 168.3 |
| A | 8 | 38 | 178379 | 1056.13 | 682 | 664 | 168.3 |
| B | 8 | 128 | 105077 | 720.8 | 688 | 664 | 144.9 |
| B | 4 | 170 | 76475 | 523.35 | 688 | 664 | 144.9 |
| B | 0 | 229 | 70095 | 479.31 | 688 | 664 | 144.9 |
| C | 4 | 5 | 641187 | 3495.05 | 664 | 656 | 183.3 |
| C | 15 | 231 | 360367 | 1962.76 | 664 | 656 | 183.3 |
| C | 15 | 212 | 349461 | 1903.25 | 664 | 656 | 183.3 |
| D | 11 | 245 | 1094108 | 6126.13 | 644 | 622 | 178.5 |
| D | 2 | 249 | 604991 | 3385.91 | 644 | 622 | 178.5 |
| D | 7 | 191 | 542966 | 3038.42 | 644 | 622 | 178.5 |
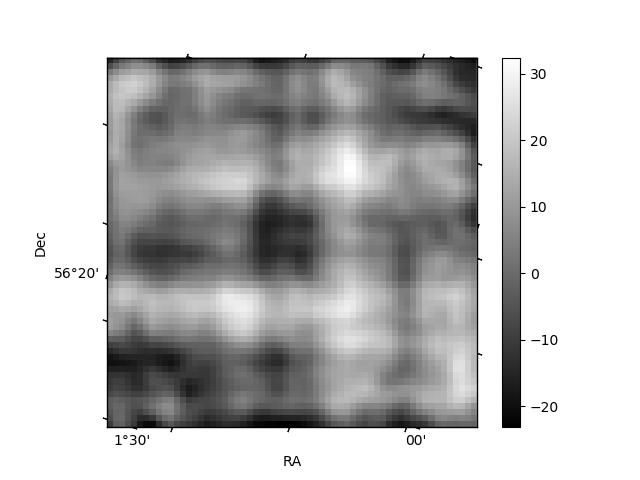
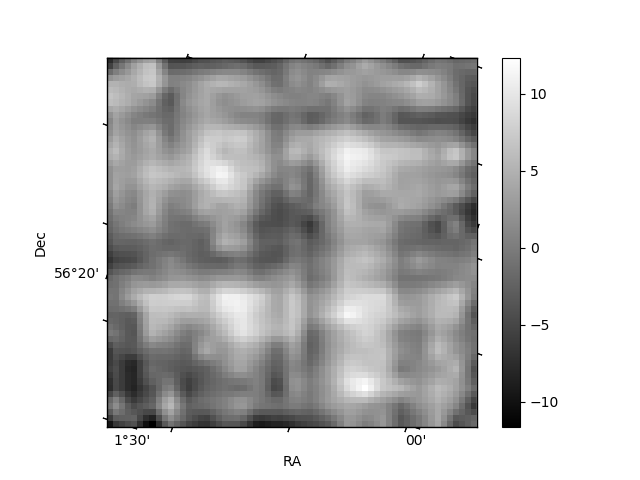
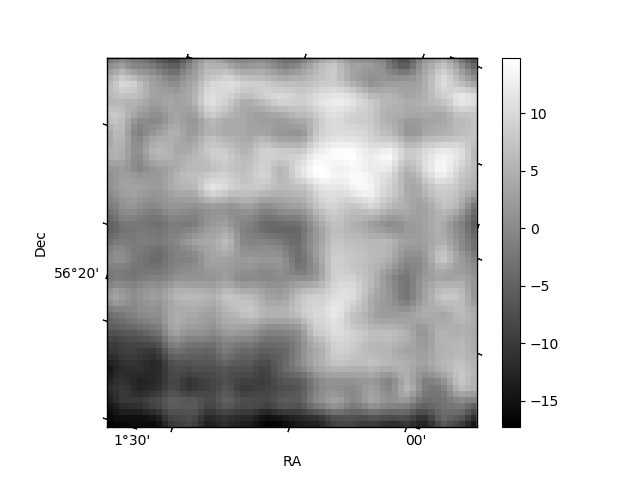
Histogram calculated using DETX and DETY for each event in the final _common_clean file
| Quadrant A | 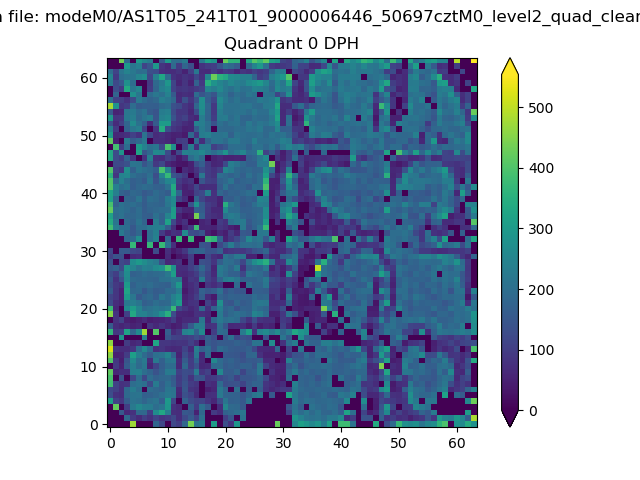 |
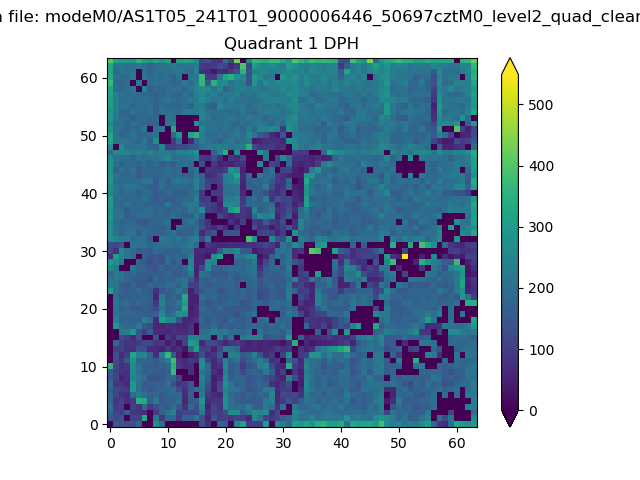 |
Quadrant B |
|---|---|---|---|
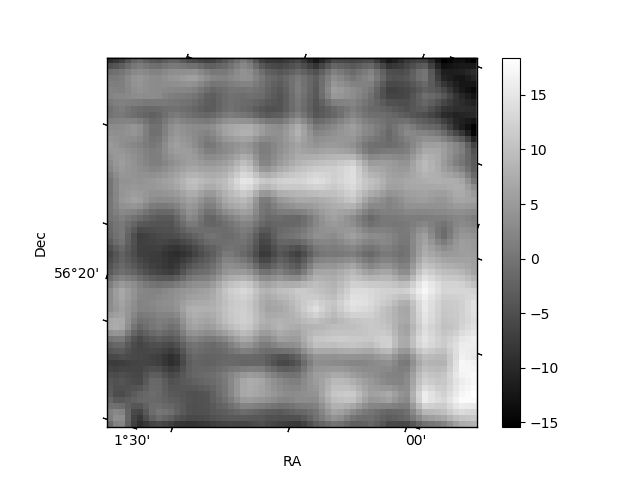
| Quadrant D | 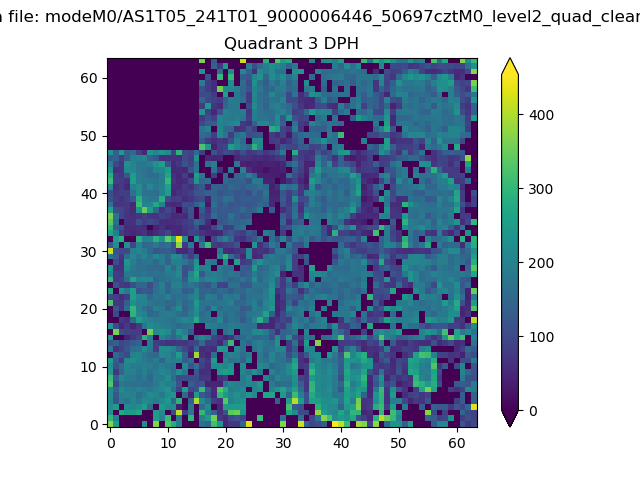 |
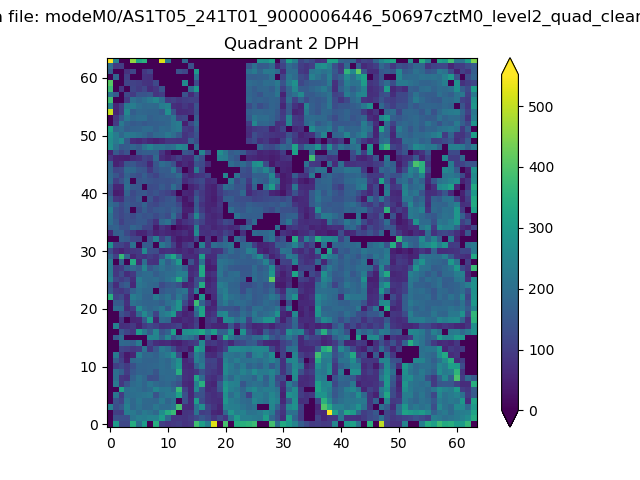 |
Quadrant C |
| Plot type | Count rate plots | Images |
|---|---|---|
| Comparison with Poisson distribution Blue bars denote a histogram of data divided into 1 sec bins. Red curve is a Poisson curve with rate = median count rate of data. |
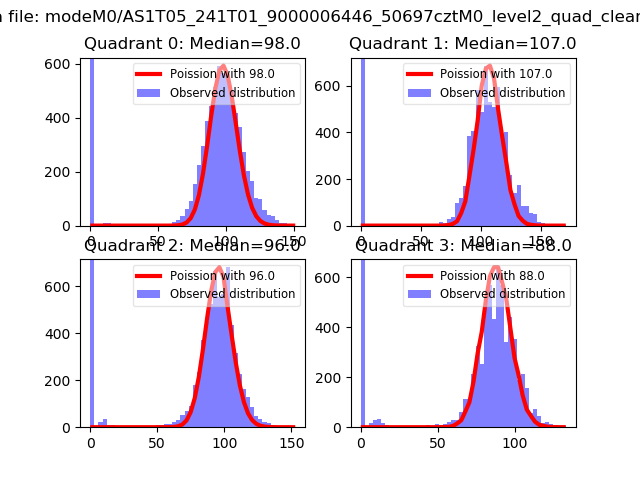 |
 |
| Quadrant-wise count rates Data is divided into 100 sec bins |
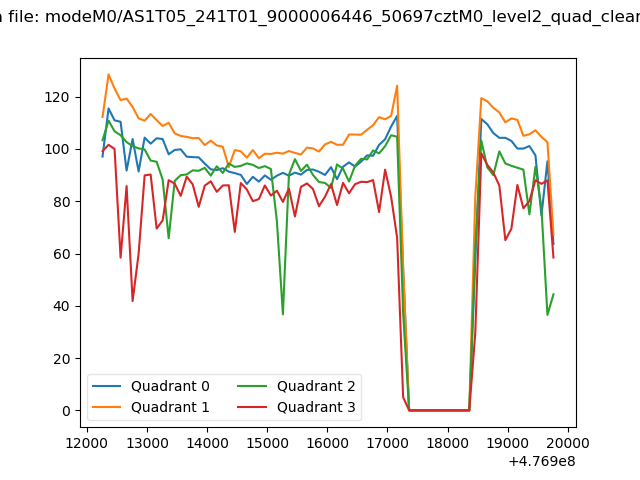 |
|
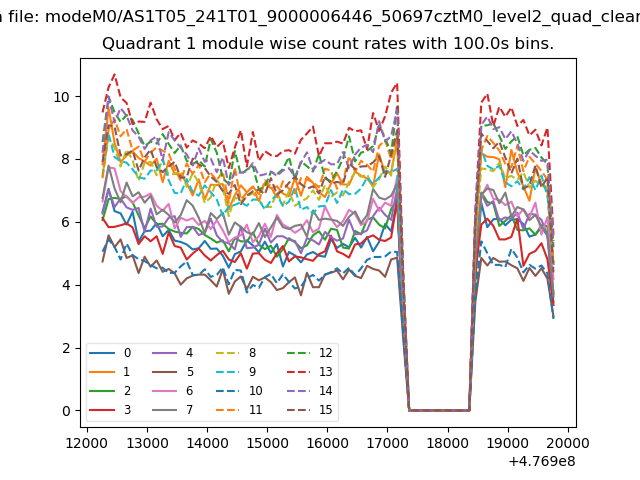
| Module-wise count rates for Quadrant A Data is divided into 100 sec bins |
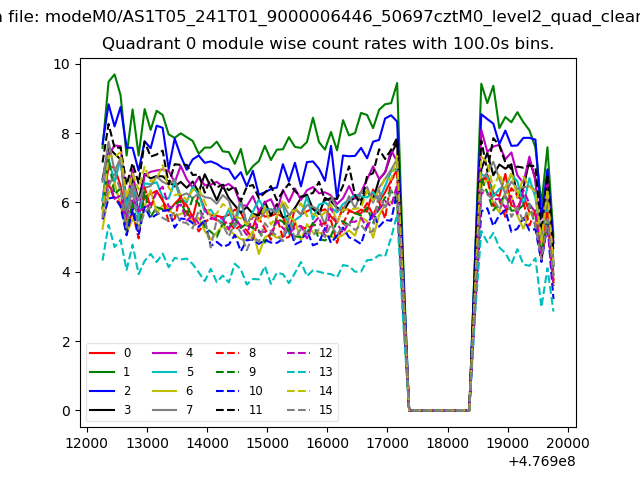 |
 |
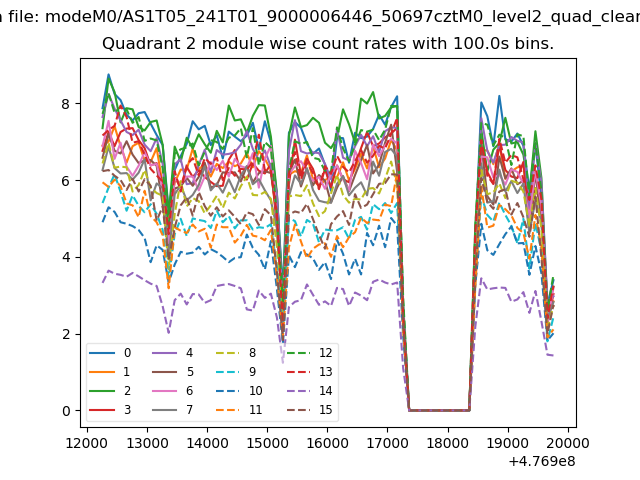
| Module-wise count rates for Quadrant B Data is divided into 100 sec bins |
 |
 |
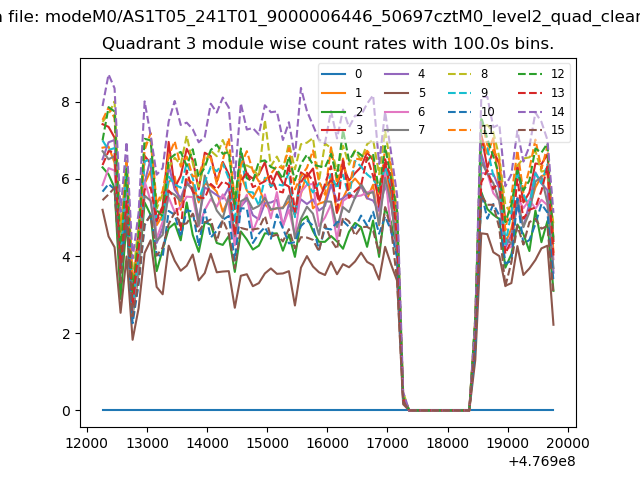
| Module-wise count rates for Quadrant C Data is divided into 100 sec bins |
 |
 |
| Module-wise count rates for Quadrant D Data is divided into 100 sec bins |
 |
 |
| Parameter | Plot |
|---|---|
| CZT HV Monitor | 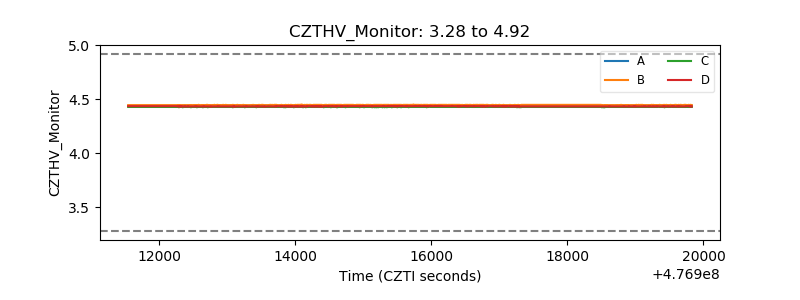 |
| D_VDD | 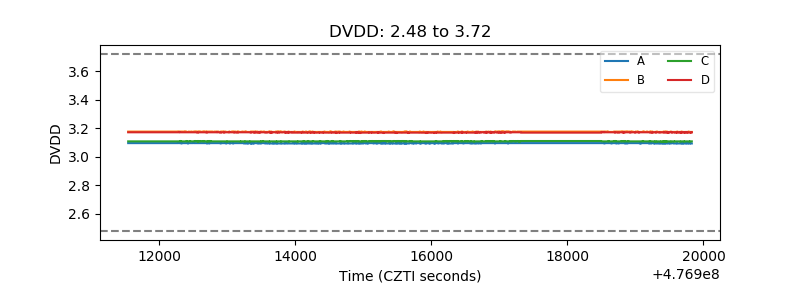 |
| Temperature 1 | 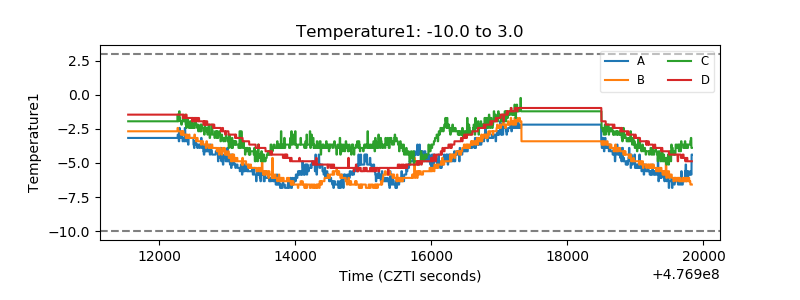 |
| Veto HV Monitor | 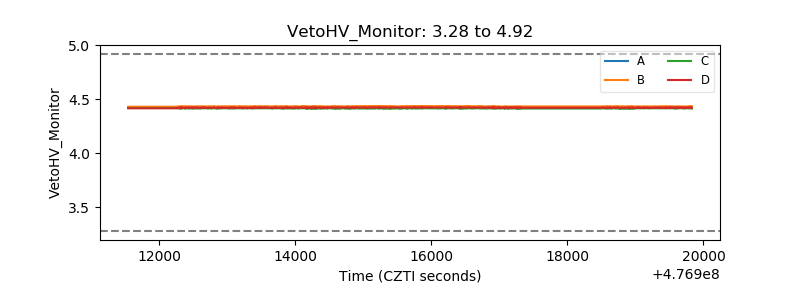 |
| Veto LLD | 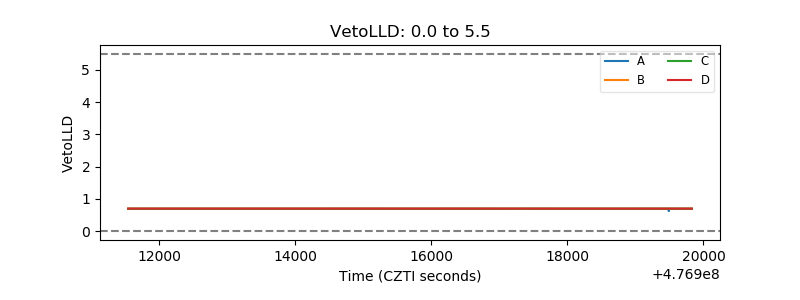 |
| Alpha Counter | 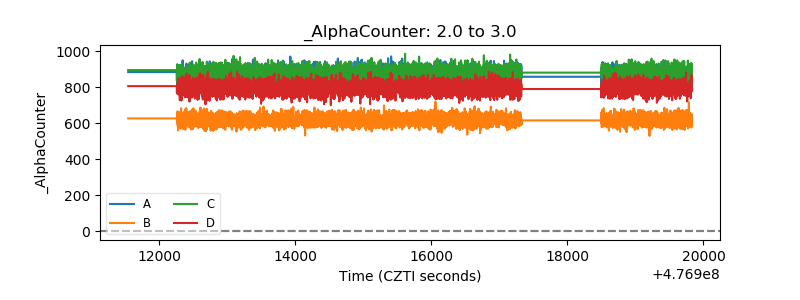 |
| _CPM_Rate | 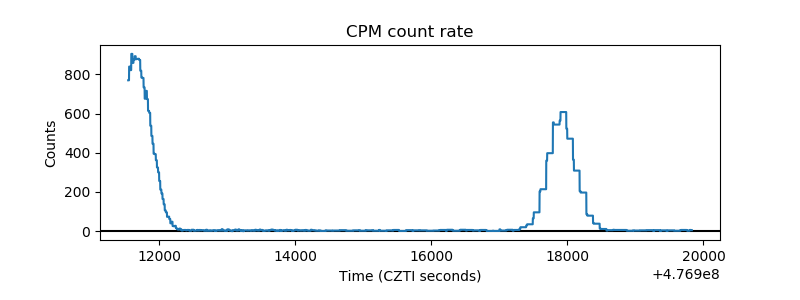 |
| CZT Counter | 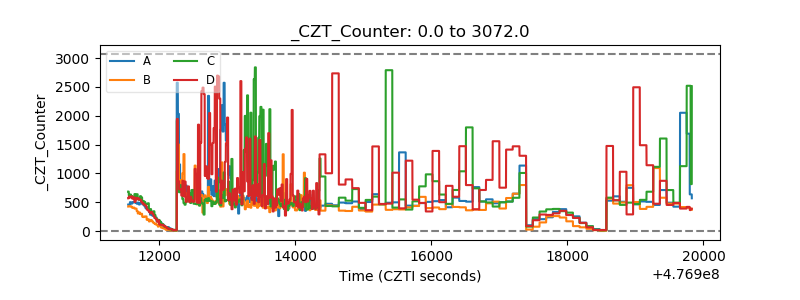 |
| +2.5 Volts monitor | 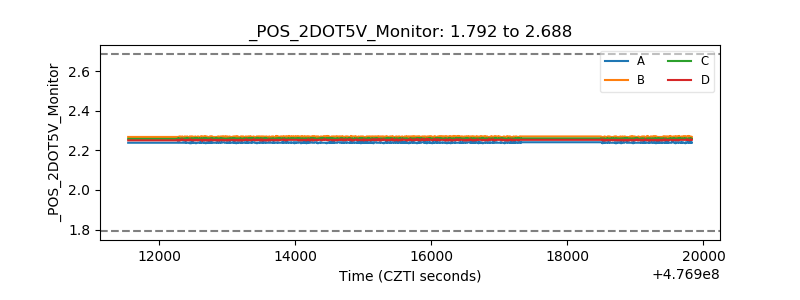 |
| +5 Volts monitor | 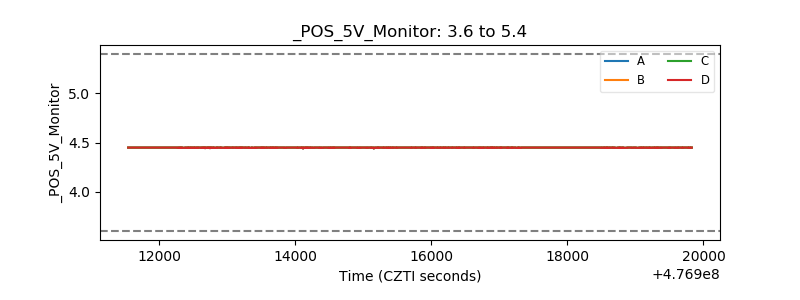 |
| _ROLL_ROT | 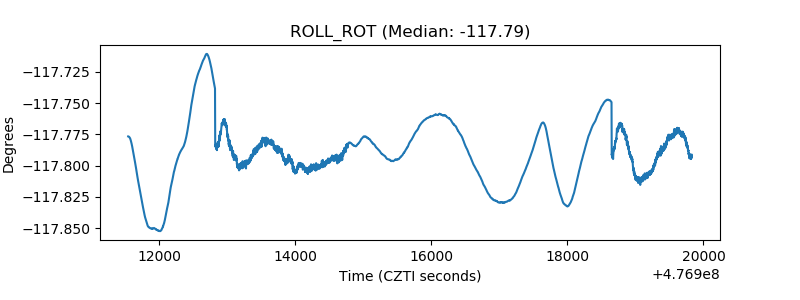 |
| _Roll_DEC | 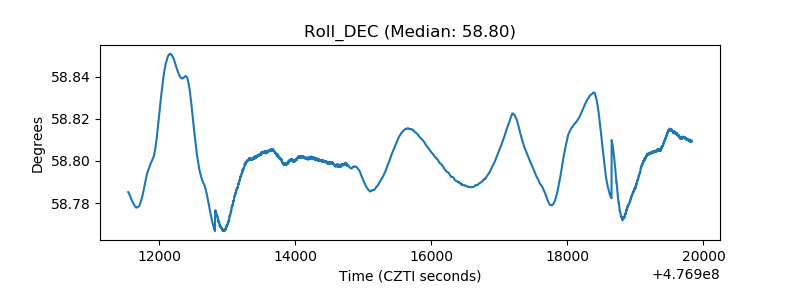 |
| _Roll_RA | 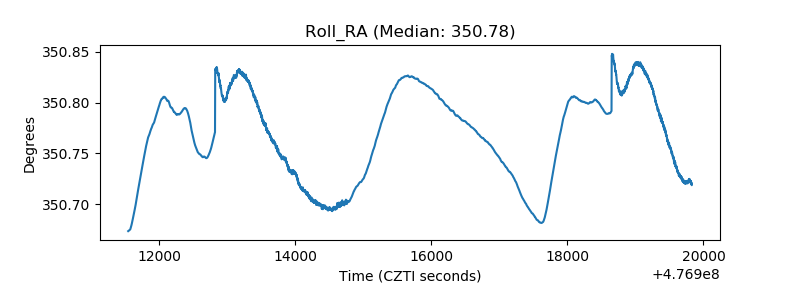 |
| Veto Counter | 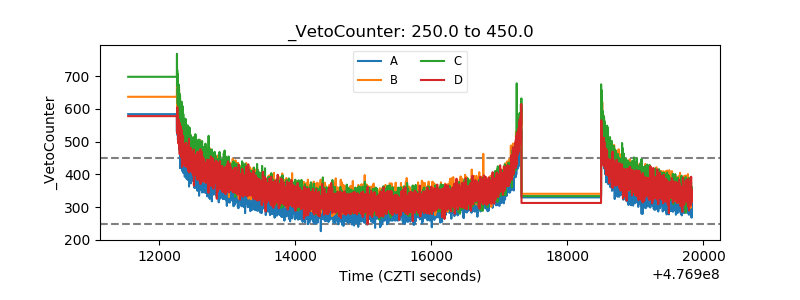 |