| Param | Original file | Final file |
|---|---|---|
| Filename | modeM0/AS1T05_241T01_9000006446_50698cztM0_level2.fits | modeM0/AS1T05_241T01_9000006446_50698cztM0_level2_quad_clean.evt |
| Size (bytes) | 575,539,200 | 95,054,400 |
| Size | 548.9 MB | 90.7 MB |
| Events in quadrant A | 5,756,898 | 580,098 |
| Events in quadrant B | 3,853,589 | 691,968 |
| Events in quadrant C | 5,836,379 | 587,333 |
| Events in quadrant D | 5,336,440 | 550,208 |
| Mode M9 | |||
|---|---|---|---|
| Quadrant | BADHDUFLAG | Total packets | Discarded packets |
| A | 0 | 12 | 0 |
| B | 0 | 12 | 0 |
| C | 0 | 13 | 0 |
| D | 0 | 13 | 0 |
| Mode M0 | |||
|---|---|---|---|
| Quadrant | BADHDUFLAG | Total packets | Discarded packets |
| A | 0 | 21511 | 3 |
| B | 0 | 16307 | 2 |
| C | 0 | 21904 | 2 |
| D | 0 | 20869 | 2 |
| Mode SS | |||
|---|---|---|---|
| Quadrant | BADHDUFLAG | Total packets | Discarded packets |
| A | 0 | 136 | 0 |
| B | 0 | 136 | 0 |
| C | 0 | 136 | 0 |
| D | 0 | 136 | 0 |
| Quadrant | Total seconds | Saturated seconds | Saturation percentage |
|---|---|---|---|
| A | 6721 | 739 | 10.995388% |
| B | 6721 | 194 | 2.886475% |
| C | 6721 | 649 | 9.656301% |
| D | 6721 | 584 | 8.689183% |
Noise dominated data is calculated using 1-second bins in cleaned event files. If a bin has >2000 counts, and if more than 50% of those come from <1% of pixels, then it is considered to be noise-dominated and hence unusable.
| Quadrant | # 1 sec bins | Bins with >0 counts | Bins with >2000 counts | High rate bins dominated by noise | Noise dominated (total time) | Noise dominated (detector-on time) | Marked lightcurve |
|---|---|---|---|---|---|---|---|
| A | 7756 | 6722 | 606 | 606 | 7.81% | 9.02% | 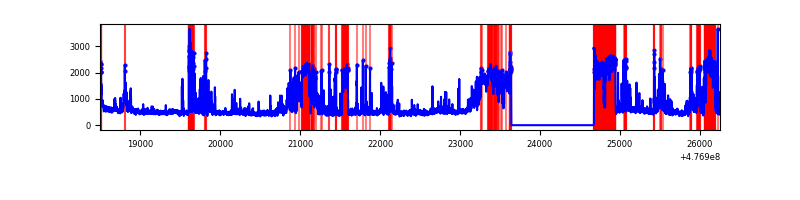 |
| B | 7756 | 6722 | 99 | 99 | 1.28% | 1.47% | 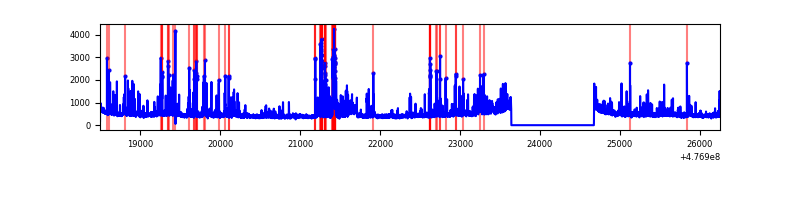 |
| C | 7756 | 6722 | 536 | 536 | 6.91% | 7.97% | 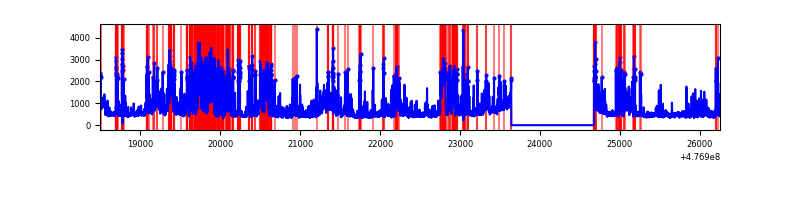 |
| D | 7756 | 6722 | 448 | 448 | 5.78% | 6.66% | 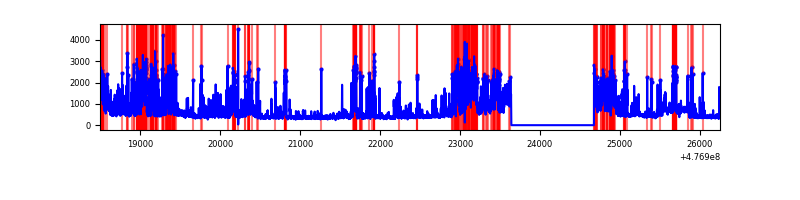 |
Top three noisy pixels from each quadrant. If the there are fewer than three noisy pixels in the level2.evt file, extra rows are filled as -1
| Pixel properties | Quadrant properties | ||||||
|---|---|---|---|---|---|---|---|
| Quadrant | DetID | PixID | Counts | Sigma | Mean | Median | Sigma |
| A | 12 | 80 | 1987314 | 11462.05 | 691 | 673 | 173.3 |
| A | 4 | 3 | 336617 | 1938.25 | 691 | 673 | 173.3 |
| A | 8 | 38 | 173849 | 999.15 | 691 | 673 | 173.3 |
| B | 5 | 172 | 307100 | 2019.14 | 713 | 688 | 151.8 |
| B | 8 | 128 | 94525 | 618.35 | 713 | 688 | 151.8 |
| B | 10 | 29 | 71839 | 468.86 | 713 | 688 | 151.8 |
| C | 15 | 231 | 1157871 | 6118.17 | 684 | 679 | 189.1 |
| C | 0 | 209 | 340080 | 1794.44 | 684 | 679 | 189.1 |
| C | 13 | 3 | 303765 | 1602.44 | 684 | 679 | 189.1 |
| D | 7 | 191 | 537523 | 2851.77 | 677 | 653 | 188.3 |
| D | 2 | 249 | 391501 | 2076.12 | 677 | 653 | 188.3 |
| D | 7 | 110 | 302935 | 1605.67 | 677 | 653 | 188.3 |
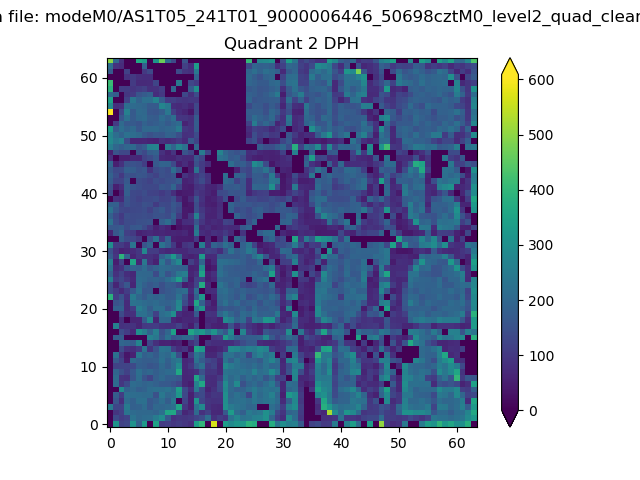
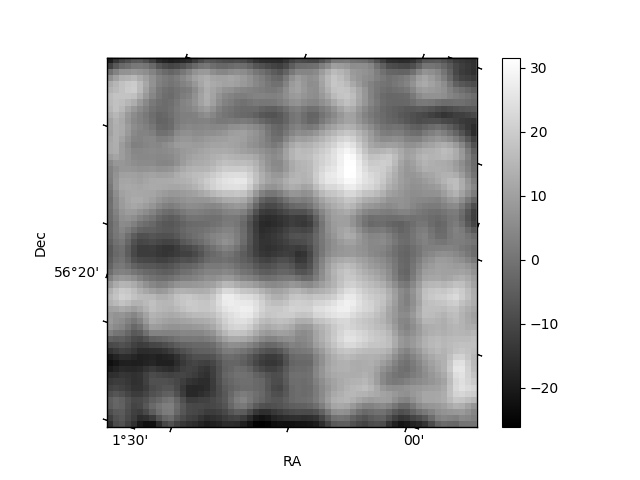
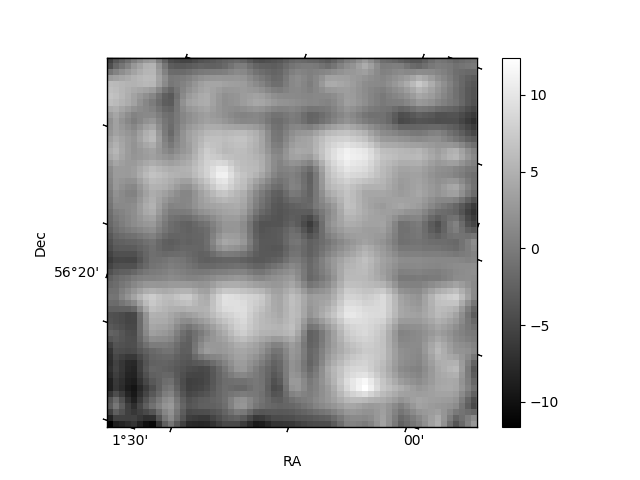
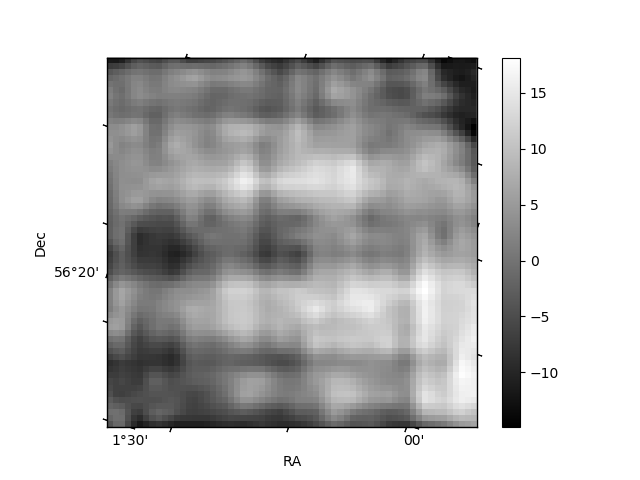
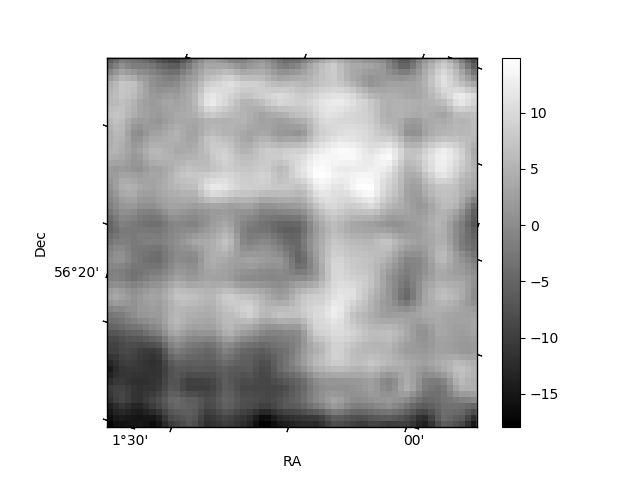
Histogram calculated using DETX and DETY for each event in the final _common_clean file
| Quadrant A | 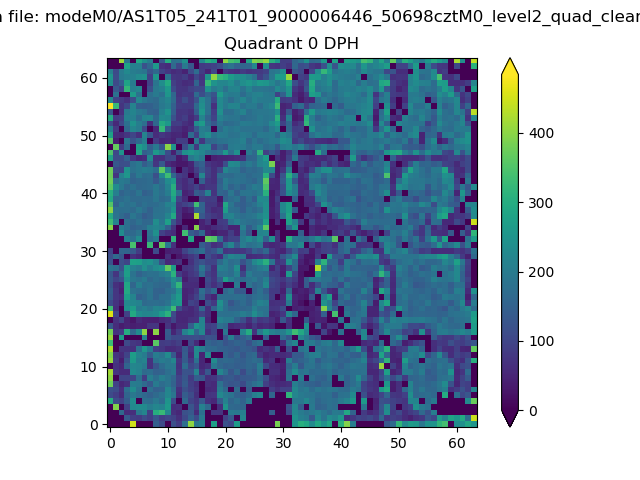 |
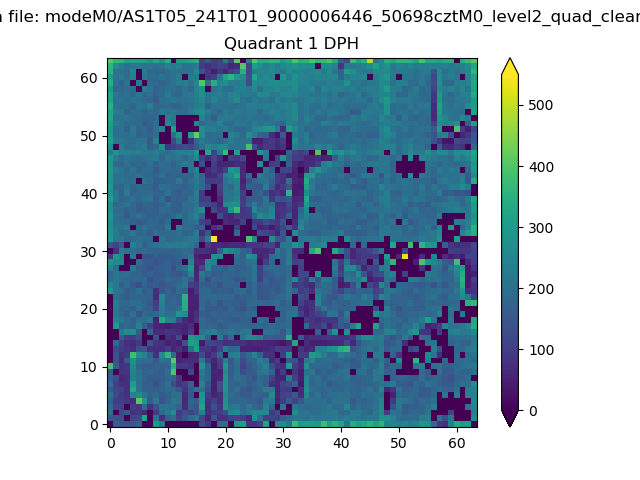 |
Quadrant B |
|---|---|---|---|
| Quadrant D | 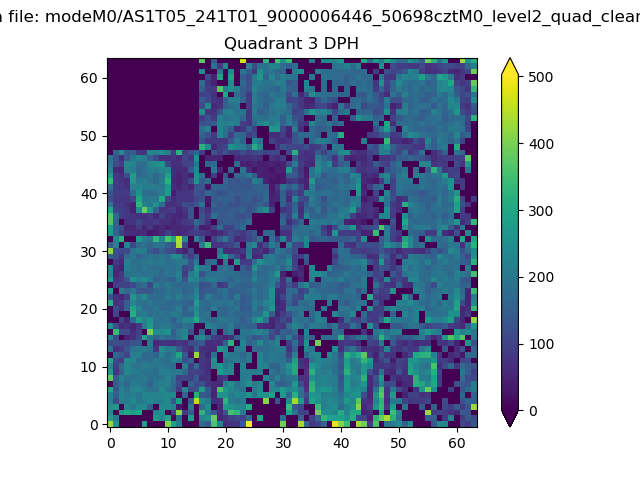 |
 |
Quadrant C |
| Plot type | Count rate plots | Images |
|---|---|---|
| Comparison with Poisson distribution Blue bars denote a histogram of data divided into 1 sec bins. Red curve is a Poisson curve with rate = median count rate of data. |
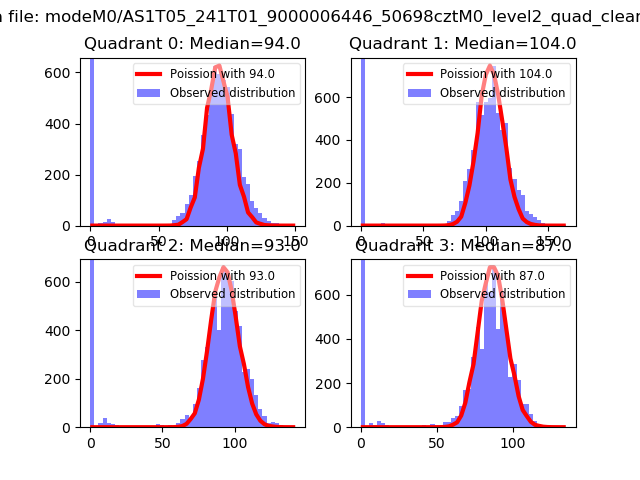 |
 |
| Quadrant-wise count rates Data is divided into 100 sec bins |
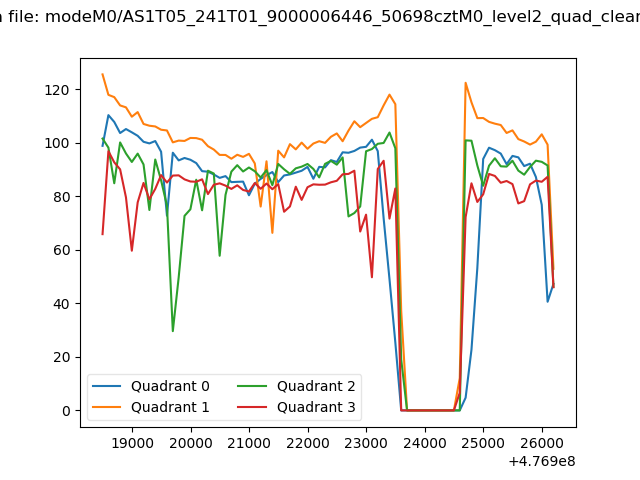 |
|
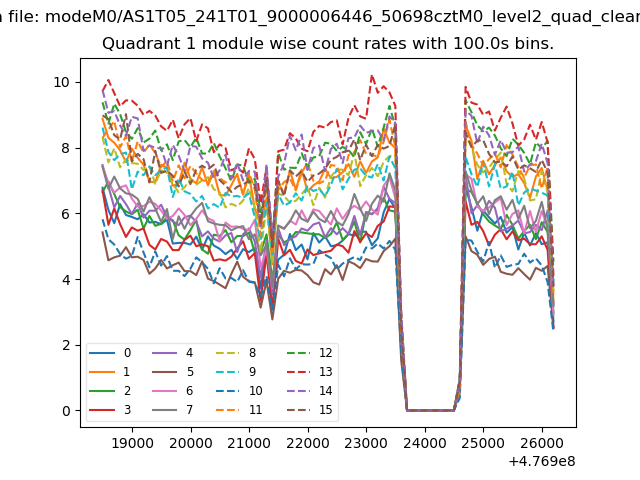
| Module-wise count rates for Quadrant A Data is divided into 100 sec bins |
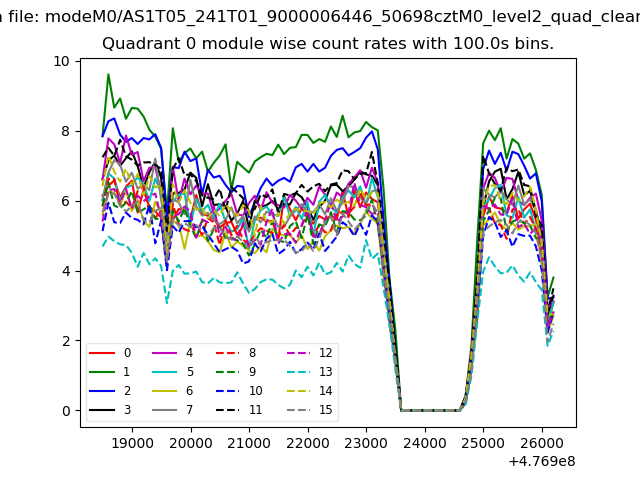 |
 |
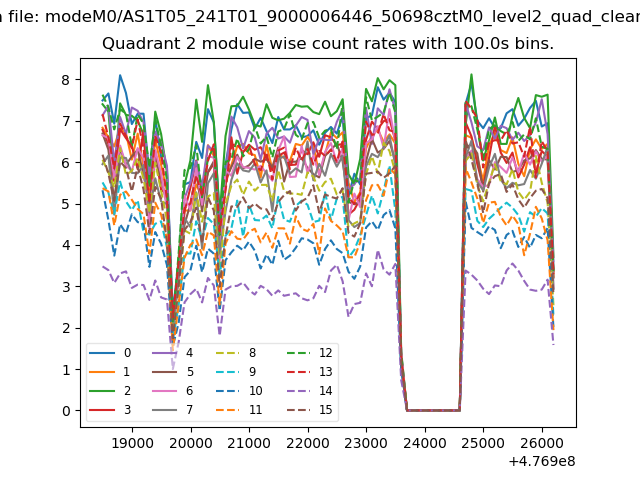
| Module-wise count rates for Quadrant B Data is divided into 100 sec bins |
 |
 |
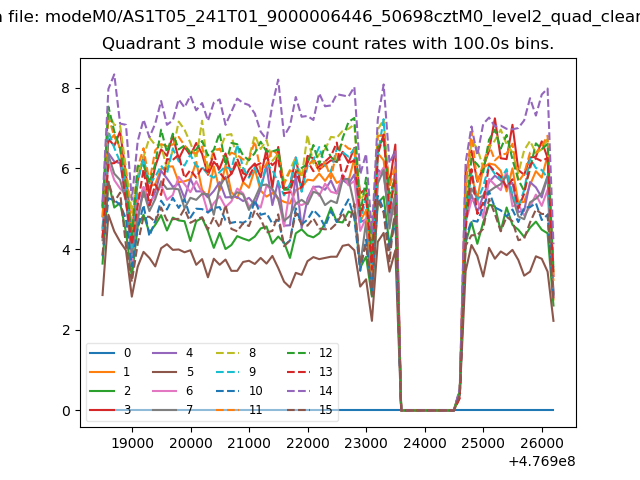
| Module-wise count rates for Quadrant C Data is divided into 100 sec bins |
 |
 |
| Module-wise count rates for Quadrant D Data is divided into 100 sec bins |
 |
 |
| Parameter | Plot |
|---|---|
| CZT HV Monitor | 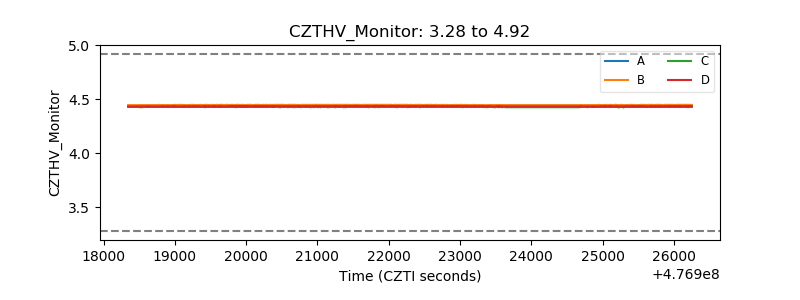 |
| D_VDD | 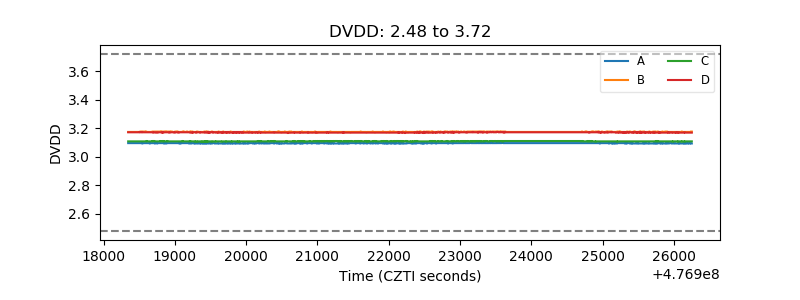 |
| Temperature 1 | 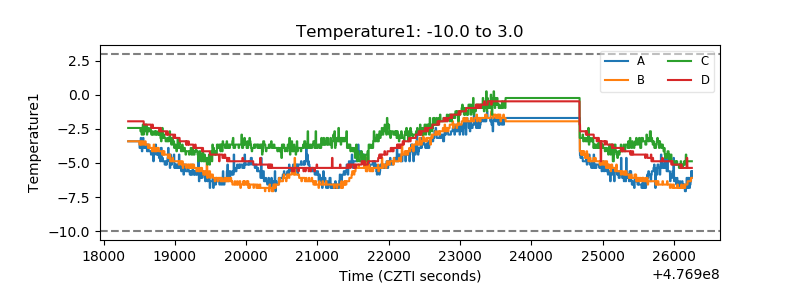 |
| Veto HV Monitor | 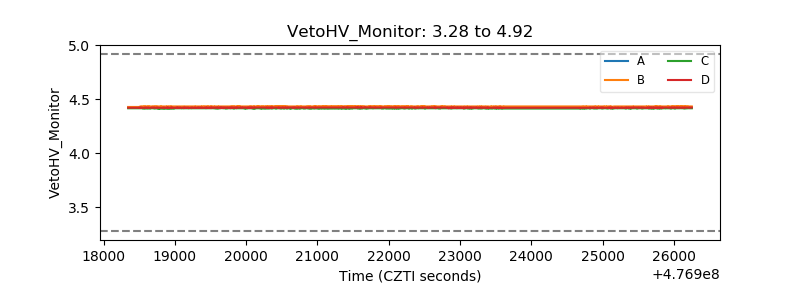 |
| Veto LLD | 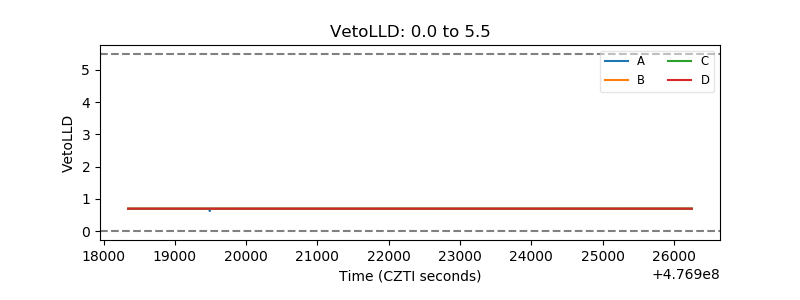 |
| Alpha Counter | 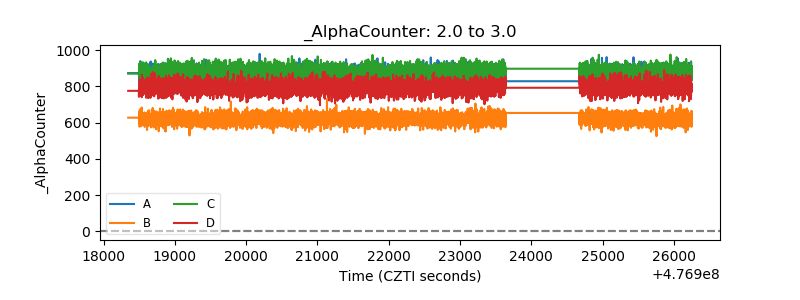 |
| _CPM_Rate | 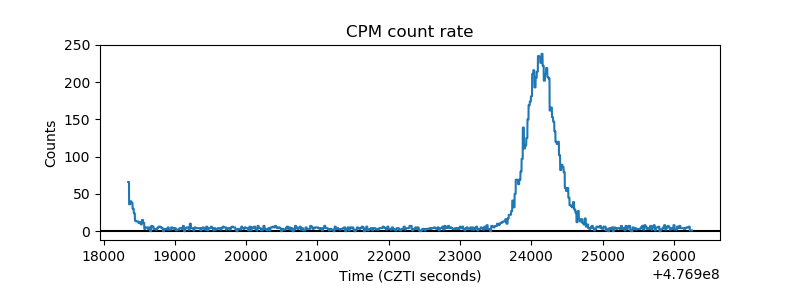 |
| CZT Counter | 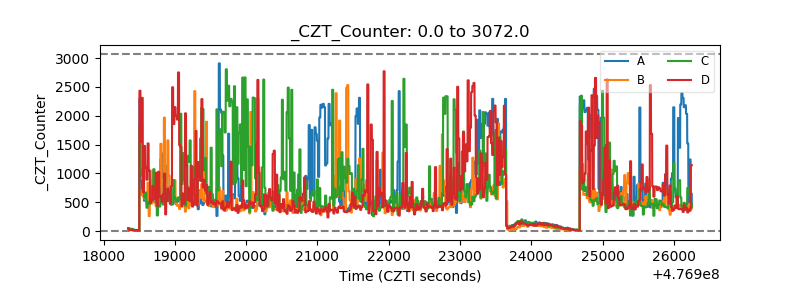 |
| +2.5 Volts monitor | 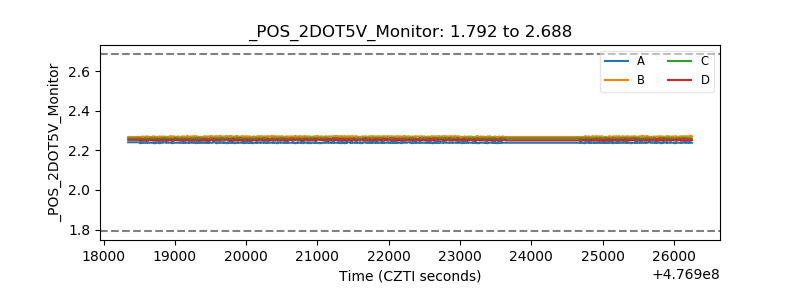 |
| +5 Volts monitor | 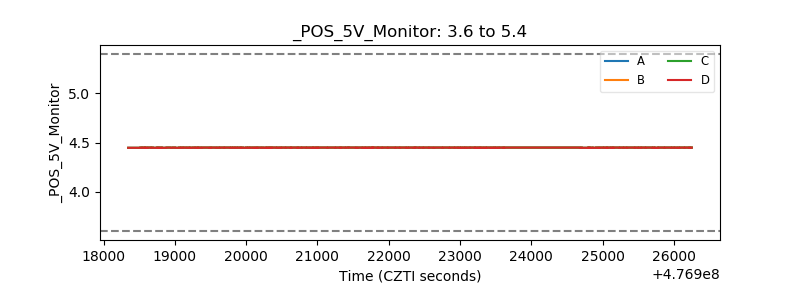 |
| _ROLL_ROT | 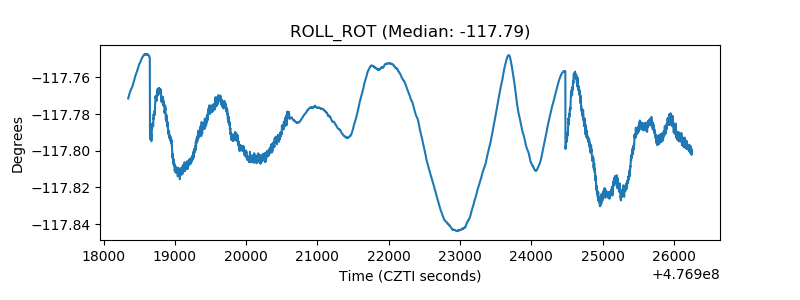 |
| _Roll_DEC | 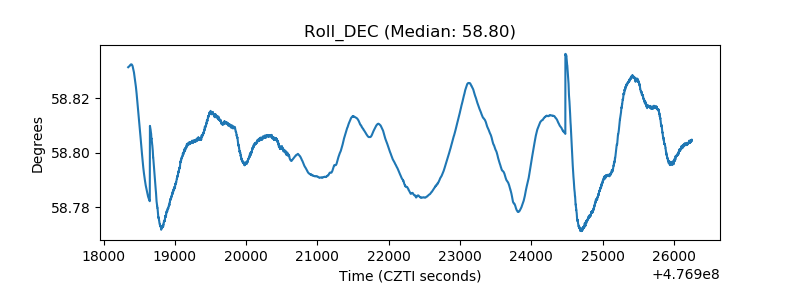 |
| _Roll_RA | 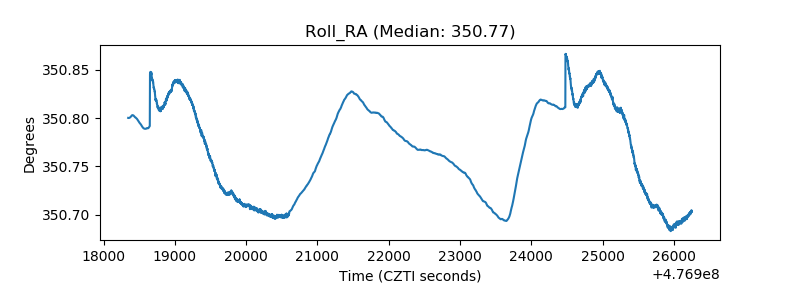 |
| Veto Counter | 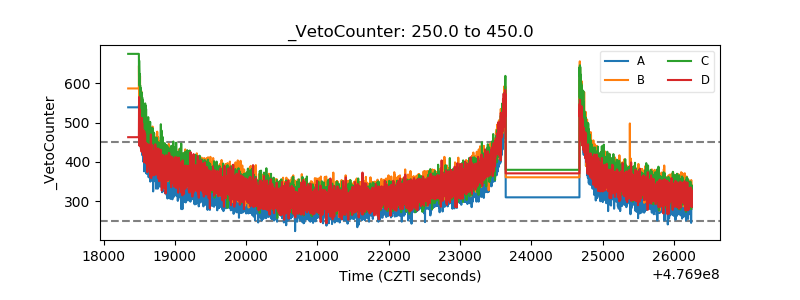 |