| Param | Original file | Final file |
|---|---|---|
| Filename | modeM0/AS1T05_241T01_9000006446_50699cztM0_level2.fits | modeM0/AS1T05_241T01_9000006446_50699cztM0_level2_quad_clean.evt |
| Size (bytes) | 613,863,360 | 98,893,440 |
| Size | 585.4 MB | 94.3 MB |
| Events in quadrant A | 7,289,386 | 576,890 |
| Events in quadrant B | 3,903,977 | 719,217 |
| Events in quadrant C | 5,409,268 | 628,096 |
| Events in quadrant D | 5,569,915 | 575,236 |
| Mode M9 | |||
|---|---|---|---|
| Quadrant | BADHDUFLAG | Total packets | Discarded packets |
| A | 0 | 15 | 0 |
| B | 0 | 16 | 0 |
| C | 0 | 16 | 0 |
| D | 0 | 16 | 0 |
| Mode M0 | |||
|---|---|---|---|
| Quadrant | BADHDUFLAG | Total packets | Discarded packets |
| A | 0 | 26519 | 2 |
| B | 0 | 16771 | 2 |
| C | 0 | 21009 | 2 |
| D | 0 | 21824 | 2 |
| Mode SS | |||
|---|---|---|---|
| Quadrant | BADHDUFLAG | Total packets | Discarded packets |
| A | 0 | 144 | 0 |
| B | 0 | 144 | 0 |
| C | 0 | 144 | 0 |
| D | 0 | 144 | 0 |
| Quadrant | Total seconds | Saturated seconds | Saturation percentage |
|---|---|---|---|
| A | 7107 | 1162 | 16.350077% |
| B | 7107 | 181 | 2.546785% |
| C | 7107 | 436 | 6.134797% |
| D | 7107 | 518 | 7.288589% |
Noise dominated data is calculated using 1-second bins in cleaned event files. If a bin has >2000 counts, and if more than 50% of those come from <1% of pixels, then it is considered to be noise-dominated and hence unusable.
| Quadrant | # 1 sec bins | Bins with >0 counts | Bins with >2000 counts | High rate bins dominated by noise | Noise dominated (total time) | Noise dominated (detector-on time) | Marked lightcurve |
|---|---|---|---|---|---|---|---|
| A | 7877 | 7108 | 1235 | 1235 | 15.68% | 17.37% | 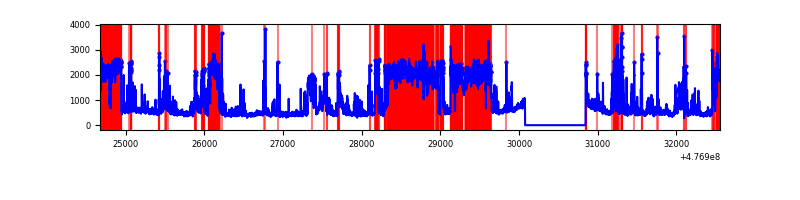 |
| B | 7877 | 7108 | 60 | 60 | 0.76% | 0.84% | 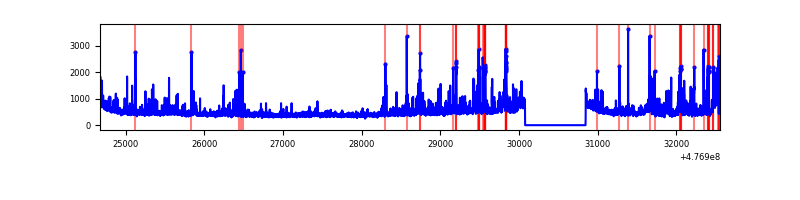 |
| C | 7877 | 7108 | 323 | 323 | 4.10% | 4.54% | 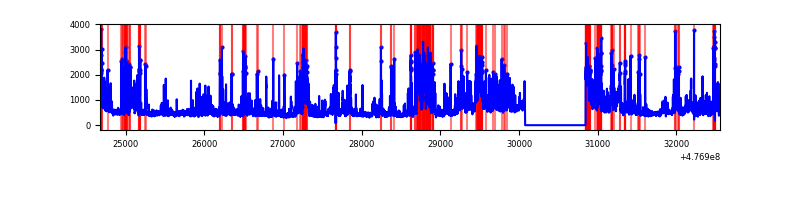 |
| D | 7877 | 7108 | 431 | 431 | 5.47% | 6.06% | 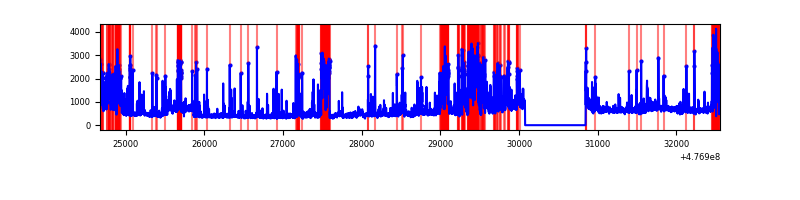 |
Top three noisy pixels from each quadrant. If the there are fewer than three noisy pixels in the level2.evt file, extra rows are filled as -1
| Pixel properties | Quadrant properties | ||||||
|---|---|---|---|---|---|---|---|
| Quadrant | DetID | PixID | Counts | Sigma | Mean | Median | Sigma |
| A | 12 | 80 | 3391954 | 18972.76 | 721 | 704 | 178.7 |
| A | 4 | 3 | 294329 | 1642.72 | 721 | 704 | 178.7 |
| A | 3 | 114 | 100179 | 556.52 | 721 | 704 | 178.7 |
| B | 0 | 229 | 317769 | 1972.05 | 751 | 722 | 160.8 |
| B | 4 | 170 | 65965 | 405.81 | 751 | 722 | 160.8 |
| B | 0 | 213 | 61238 | 376.41 | 751 | 722 | 160.8 |
| C | 0 | 209 | 439804 | 2201.81 | 723 | 719 | 199.4 |
| C | 15 | 205 | 265155 | 1326.02 | 723 | 719 | 199.4 |
| C | 13 | 3 | 228700 | 1143.22 | 723 | 719 | 199.4 |
| D | 2 | 226 | 795865 | 3990.99 | 711 | 684 | 199.2 |
| D | 2 | 249 | 448881 | 2249.49 | 711 | 684 | 199.2 |
| D | 7 | 110 | 350838 | 1757.41 | 711 | 684 | 199.2 |
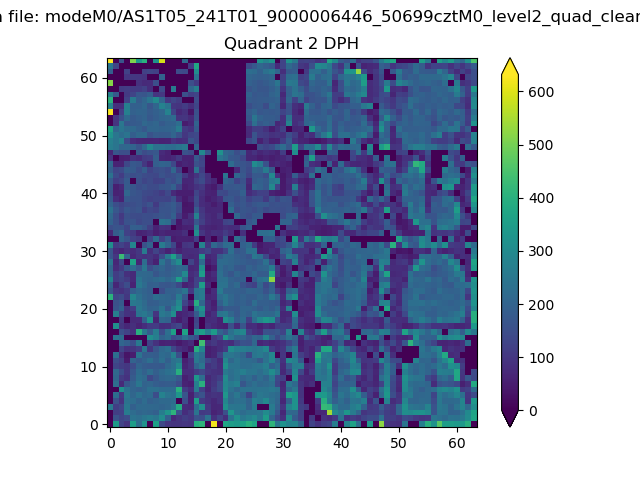
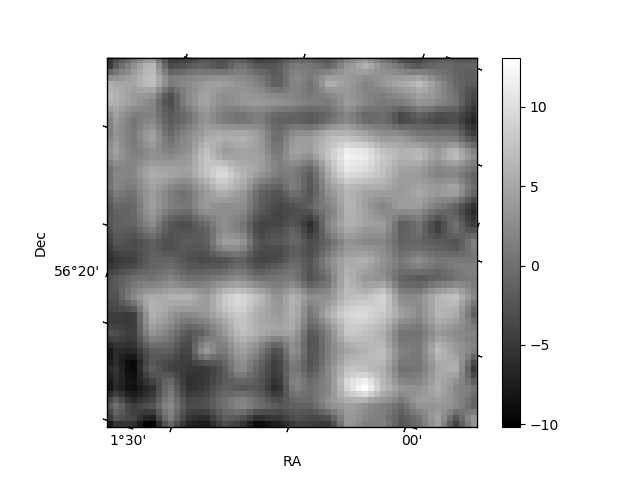
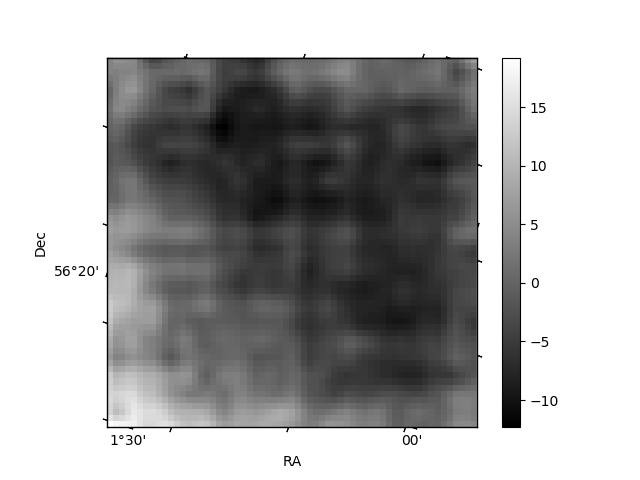
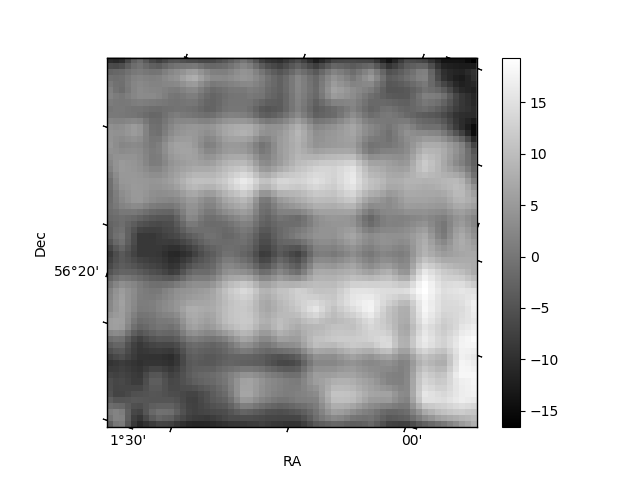
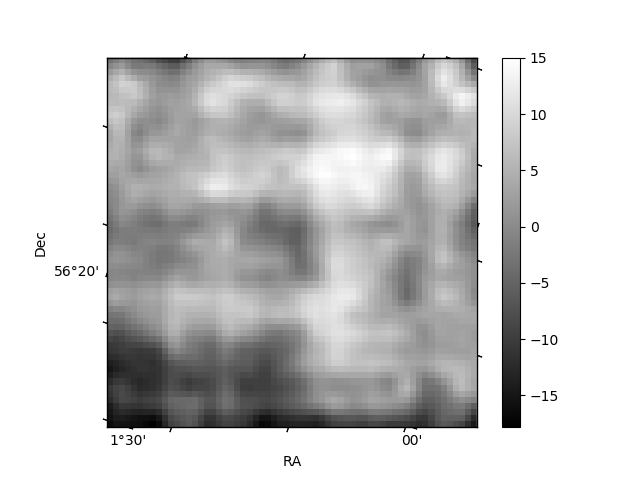
Histogram calculated using DETX and DETY for each event in the final _common_clean file
| Quadrant A | 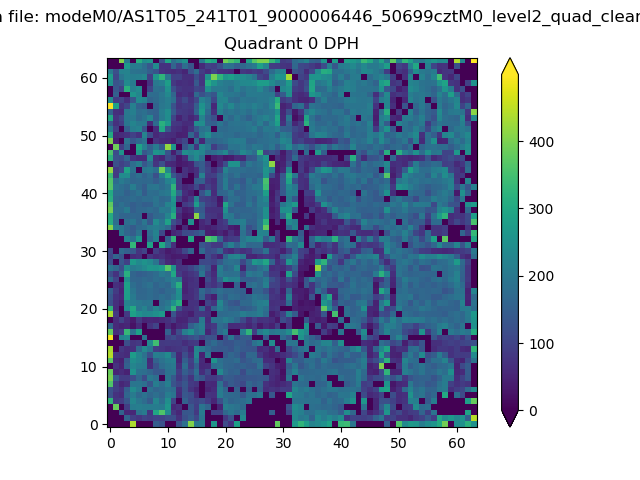 |
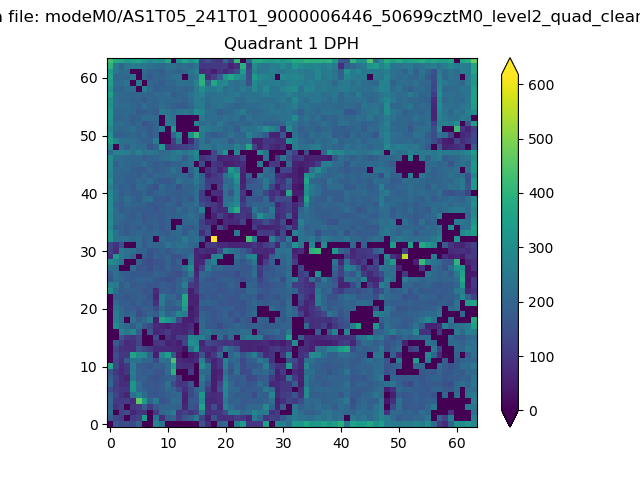 |
Quadrant B |
|---|---|---|---|
| Quadrant D | 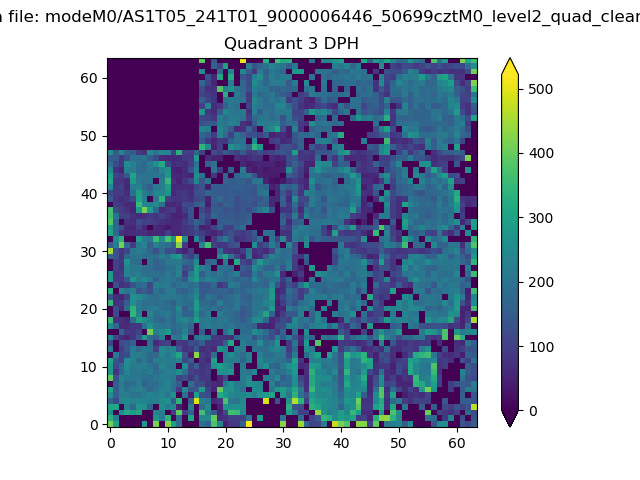 |
 |
Quadrant C |
| Plot type | Count rate plots | Images |
|---|---|---|
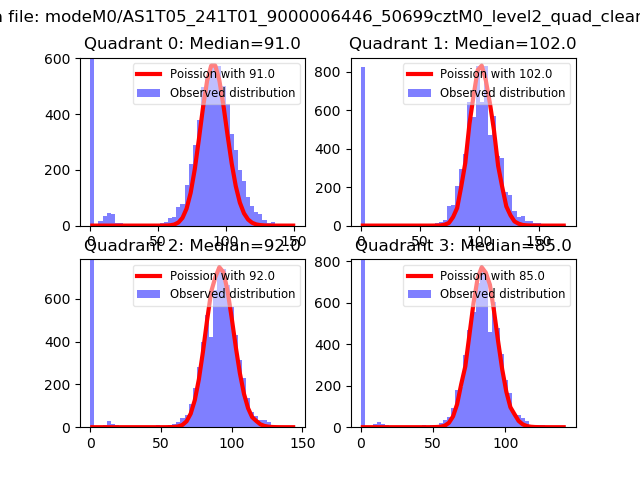
| Comparison with Poisson distribution Blue bars denote a histogram of data divided into 1 sec bins. Red curve is a Poisson curve with rate = median count rate of data. |
 |
 |
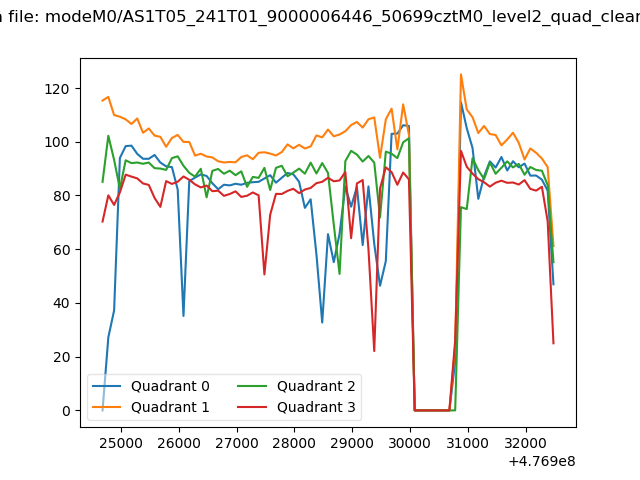
| Quadrant-wise count rates Data is divided into 100 sec bins |
 |
|
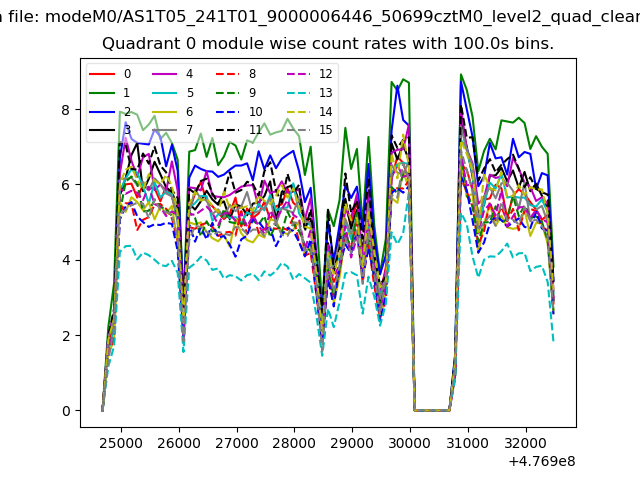
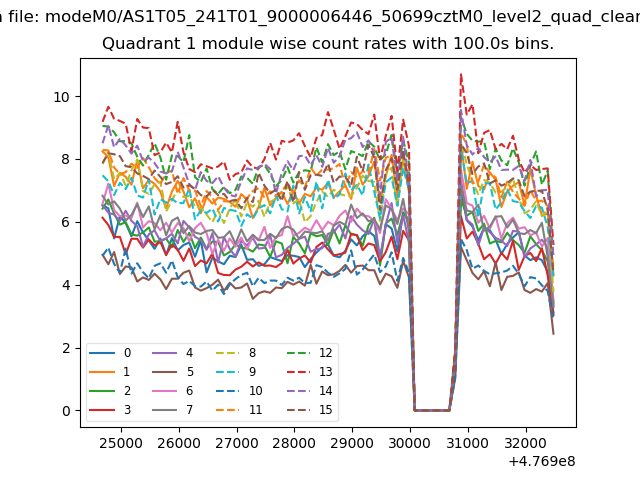
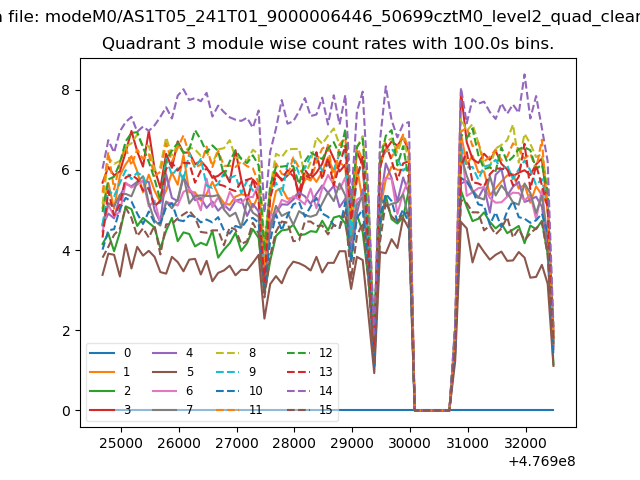
| Module-wise count rates for Quadrant A Data is divided into 100 sec bins |
 |
 |
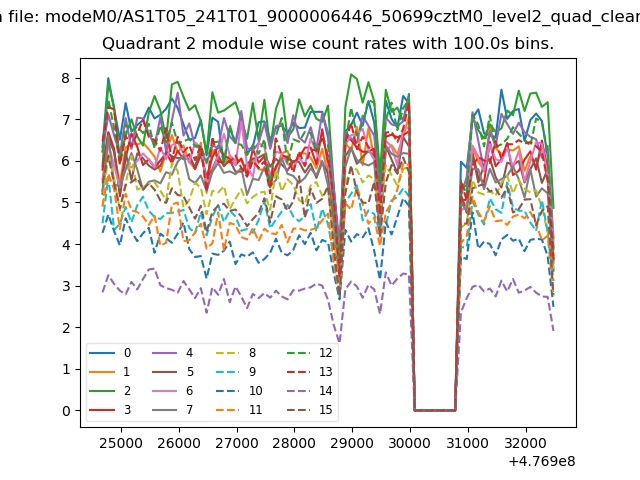
| Module-wise count rates for Quadrant B Data is divided into 100 sec bins |
 |
 |
| Module-wise count rates for Quadrant C Data is divided into 100 sec bins |
 |
 |
| Module-wise count rates for Quadrant D Data is divided into 100 sec bins |
 |
 |
| Parameter | Plot |
|---|---|
| CZT HV Monitor | 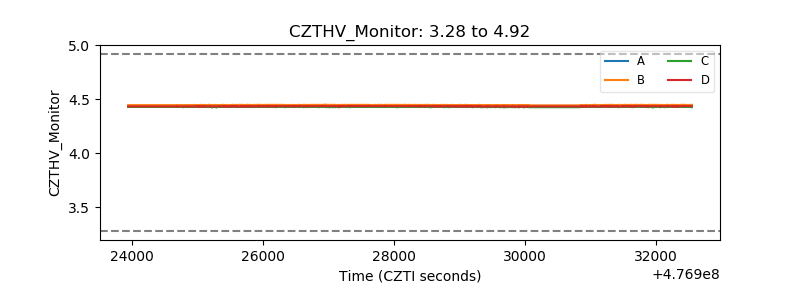 |
| D_VDD | 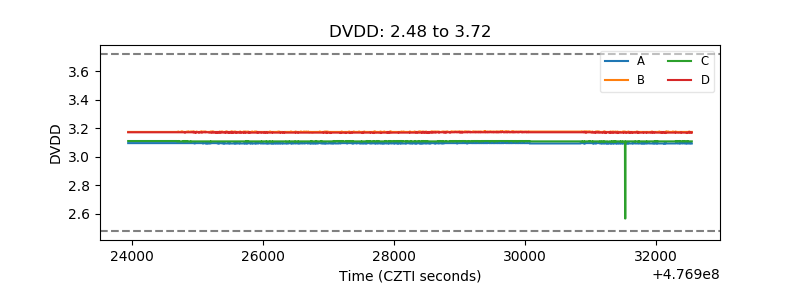 |
| Temperature 1 | 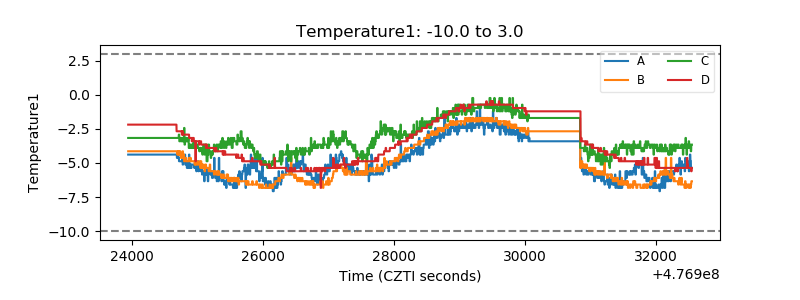 |
| Veto HV Monitor | 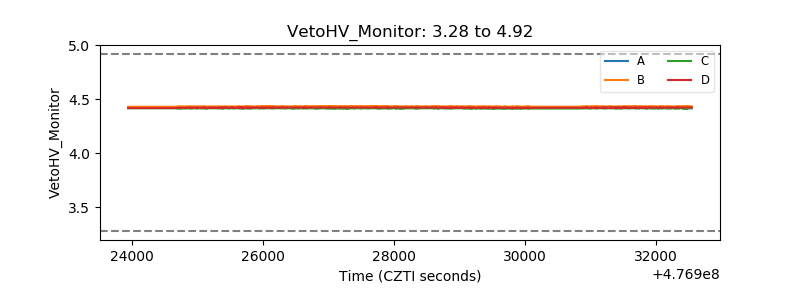 |
| Veto LLD | 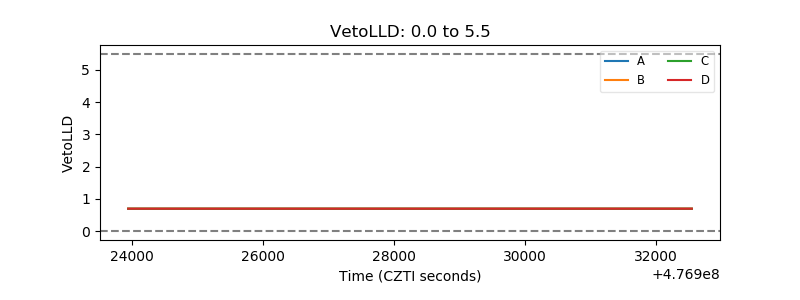 |
| Alpha Counter | 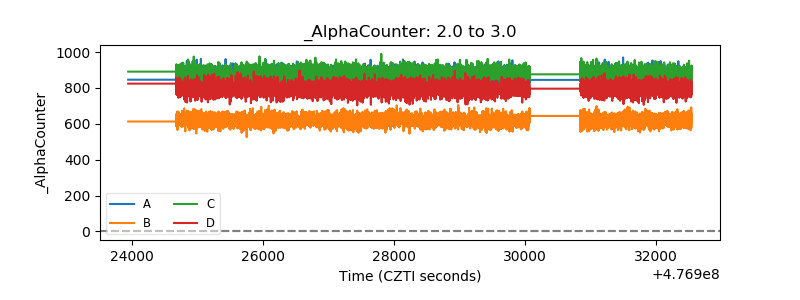 |
| _CPM_Rate | 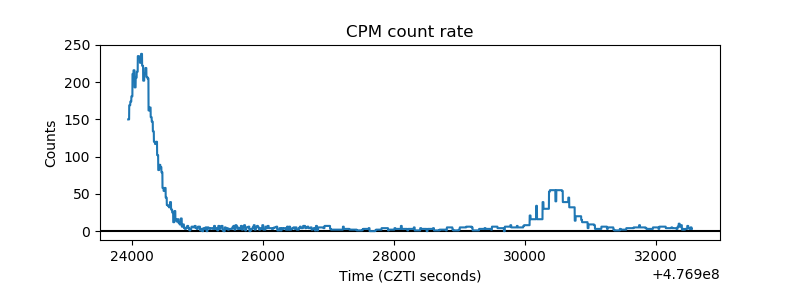 |
| CZT Counter | 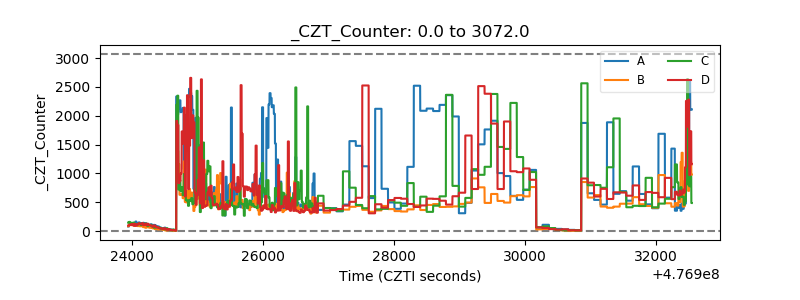 |
| +2.5 Volts monitor | 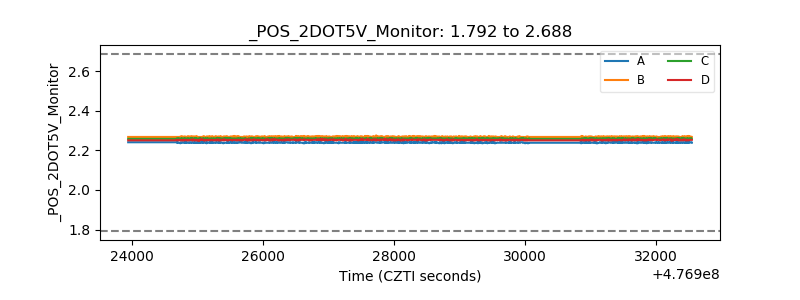 |
| +5 Volts monitor | 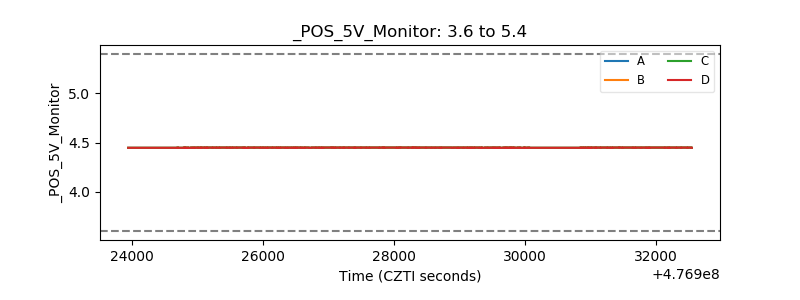 |
| _ROLL_ROT | 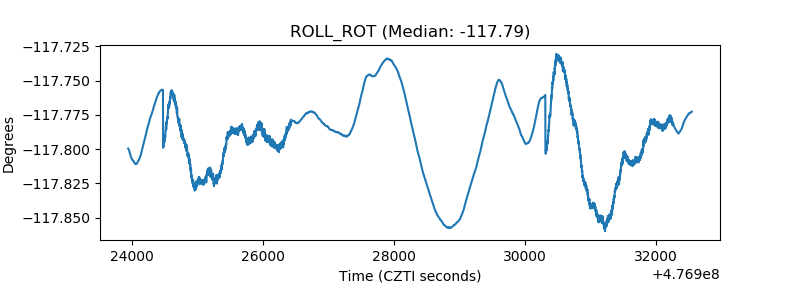 |
| _Roll_DEC | 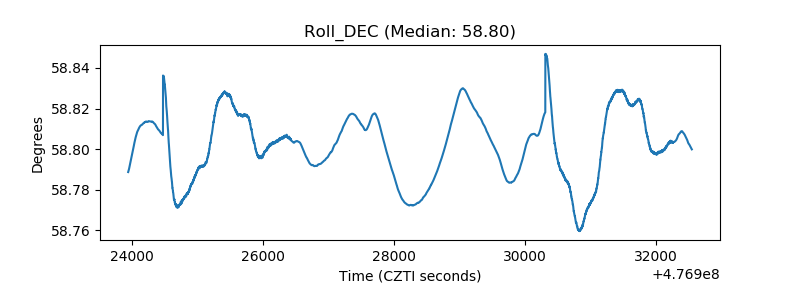 |
| _Roll_RA | 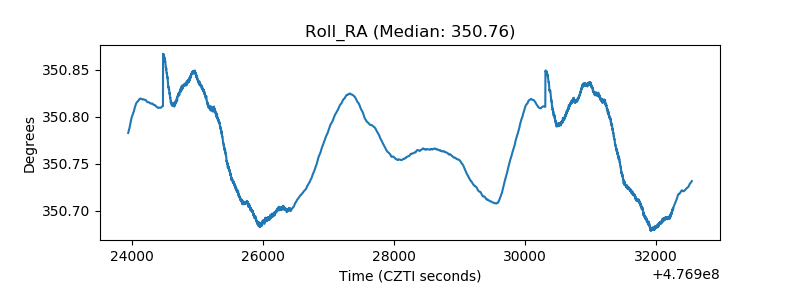 |
| Veto Counter | 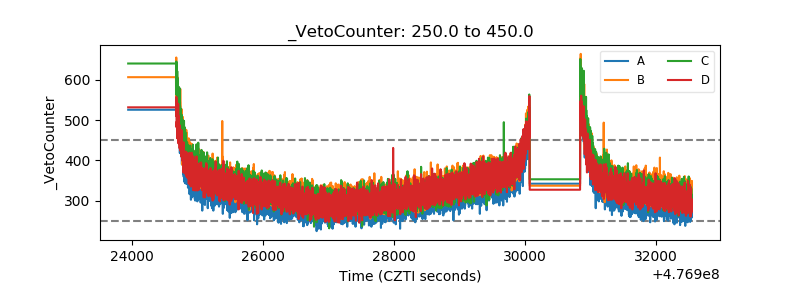 |