| Param | Original file | Final file |
|---|---|---|
| Filename | modeM0/AS1T05_241T01_9000006446_50700cztM0_level2.fits | modeM0/AS1T05_241T01_9000006446_50700cztM0_level2_quad_clean.evt |
| Size (bytes) | 719,683,200 | 108,403,200 |
| Size | 686.3 MB | 103.4 MB |
| Events in quadrant A | 8,039,329 | 646,766 |
| Events in quadrant B | 4,743,802 | 786,672 |
| Events in quadrant C | 6,292,099 | 674,693 |
| Events in quadrant D | 6,957,270 | 627,955 |
| Mode M9 | |||
|---|---|---|---|
| Quadrant | BADHDUFLAG | Total packets | Discarded packets |
| A | 0 | 2 | 0 |
| B | 0 | 3 | 0 |
| C | 0 | 3 | 0 |
| D | 0 | 3 | 0 |
| Mode M0 | |||
|---|---|---|---|
| Quadrant | BADHDUFLAG | Total packets | Discarded packets |
| A | 0 | 29328 | 3 |
| B | 0 | 19607 | 3 |
| C | 0 | 24216 | 3 |
| D | 0 | 26489 | 4 |
| Mode SS | |||
|---|---|---|---|
| Quadrant | BADHDUFLAG | Total packets | Discarded packets |
| A | 0 | 158 | 0 |
| B | 0 | 158 | 0 |
| C | 0 | 158 | 0 |
| D | 0 | 158 | 0 |
| Quadrant | Total seconds | Saturated seconds | Saturation percentage |
|---|---|---|---|
| A | 7850 | 1204 | 15.337580% |
| B | 7850 | 350 | 4.458599% |
| C | 7850 | 704 | 8.968153% |
| D | 7849 | 722 | 9.198624% |
Noise dominated data is calculated using 1-second bins in cleaned event files. If a bin has >2000 counts, and if more than 50% of those come from <1% of pixels, then it is considered to be noise-dominated and hence unusable.
| Quadrant | # 1 sec bins | Bins with >0 counts | Bins with >2000 counts | High rate bins dominated by noise | Noise dominated (total time) | Noise dominated (detector-on time) | Marked lightcurve |
|---|---|---|---|---|---|---|---|
| A | 7900 | 7852 | 1031 | 1031 | 13.05% | 13.13% | 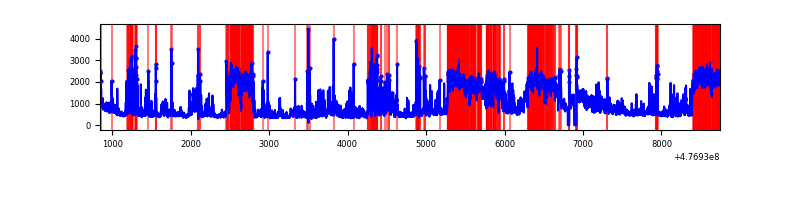 |
| B | 7900 | 7852 | 141 | 141 | 1.78% | 1.80% | 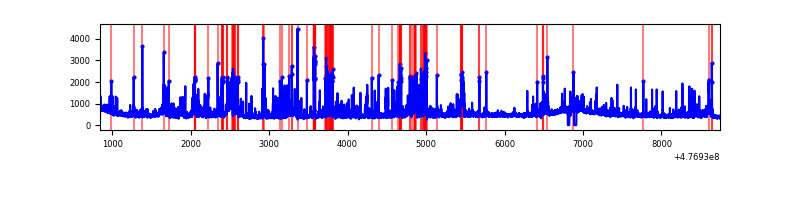 |
| C | 7900 | 7852 | 429 | 429 | 5.43% | 5.46% |  |
| D | 7899 | 7851 | 575 | 575 | 7.28% | 7.32% | 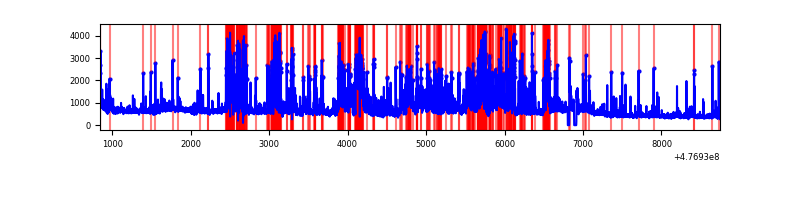 |
Top three noisy pixels from each quadrant. If the there are fewer than three noisy pixels in the level2.evt file, extra rows are filled as -1
| Pixel properties | Quadrant properties | ||||||
|---|---|---|---|---|---|---|---|
| Quadrant | DetID | PixID | Counts | Sigma | Mean | Median | Sigma |
| A | 12 | 80 | 3053407 | 15171.47 | 815 | 794 | 201.2 |
| A | 12 | 250 | 342977 | 1700.65 | 815 | 794 | 201.2 |
| A | 4 | 3 | 326944 | 1620.96 | 815 | 794 | 201.2 |
| B | 0 | 229 | 659577 | 3721.67 | 837 | 807 | 177.0 |
| B | 4 | 170 | 140588 | 789.68 | 837 | 807 | 177.0 |
| B | 0 | 213 | 114403 | 641.75 | 837 | 807 | 177.0 |
| C | 0 | 209 | 617544 | 2801.0 | 803 | 798 | 220.2 |
| C | 4 | 5 | 459930 | 2085.18 | 803 | 798 | 220.2 |
| C | 5 | 10 | 372599 | 1688.56 | 803 | 798 | 220.2 |
| D | 2 | 226 | 1022374 | 4661.74 | 788 | 758 | 219.1 |
| D | 15 | 185 | 981167 | 4473.71 | 788 | 758 | 219.1 |
| D | 2 | 249 | 386137 | 1758.52 | 788 | 758 | 219.1 |
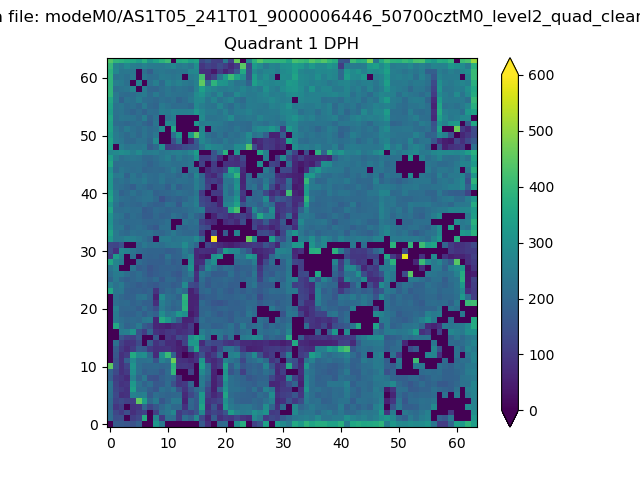
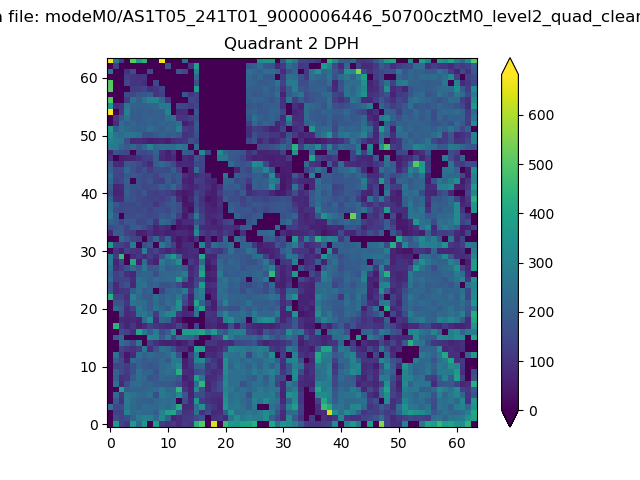
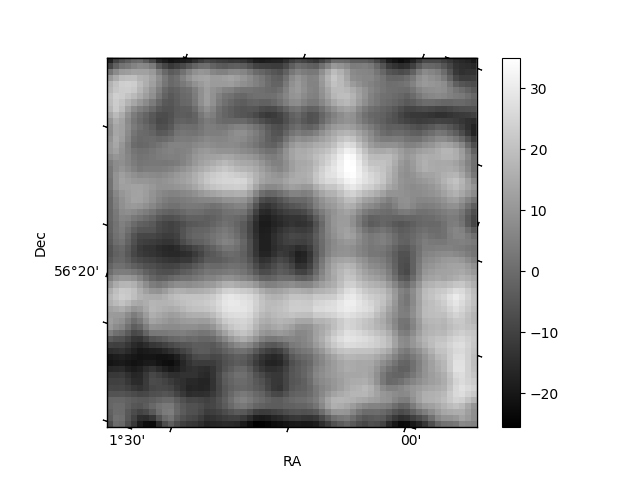
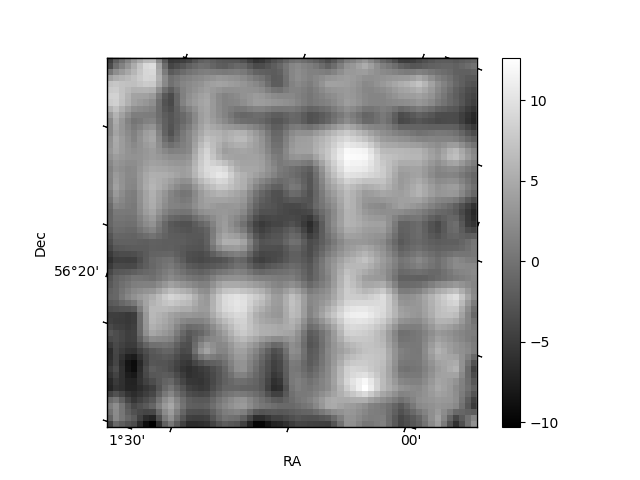
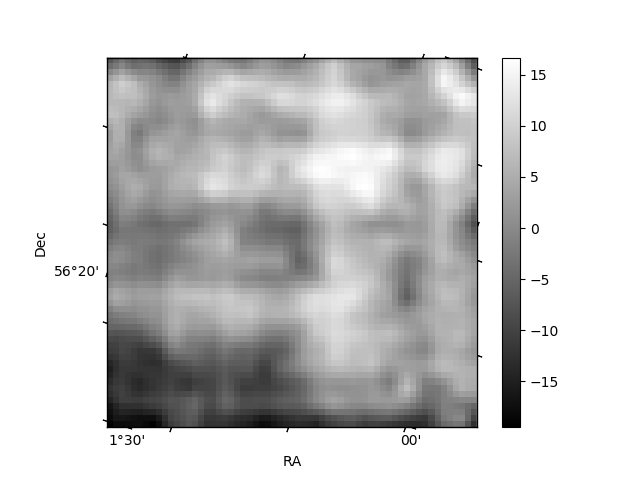
Histogram calculated using DETX and DETY for each event in the final _common_clean file
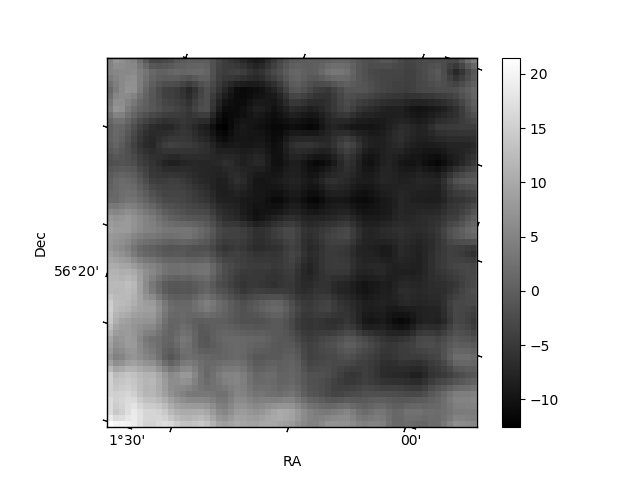
| Quadrant A | 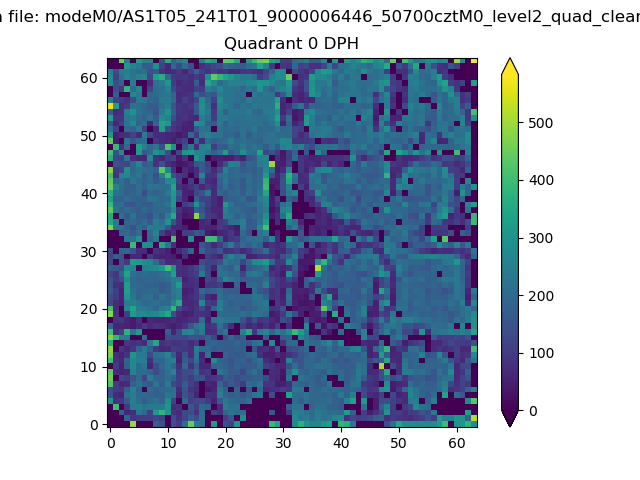 |
 |
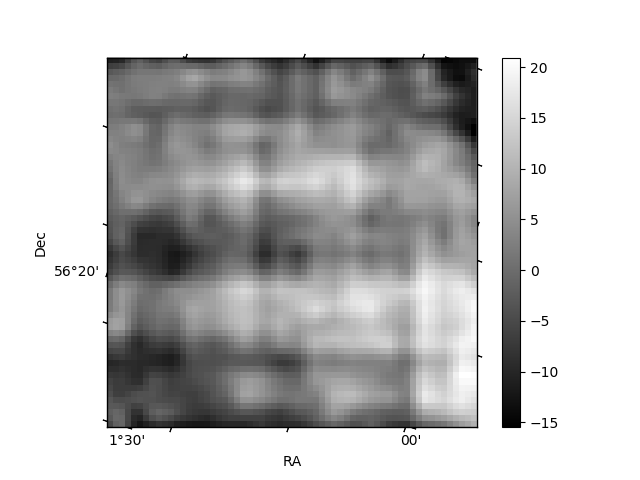
Quadrant B |
|---|---|---|---|
| Quadrant D | 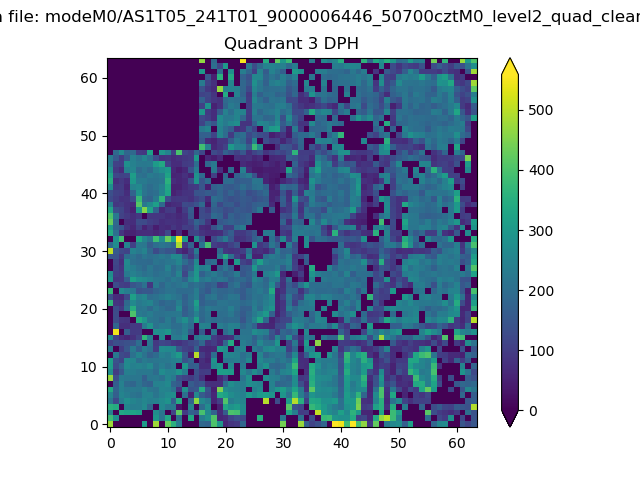 |
 |
Quadrant C |
| Plot type | Count rate plots | Images |
|---|---|---|
| Comparison with Poisson distribution Blue bars denote a histogram of data divided into 1 sec bins. Red curve is a Poisson curve with rate = median count rate of data. |
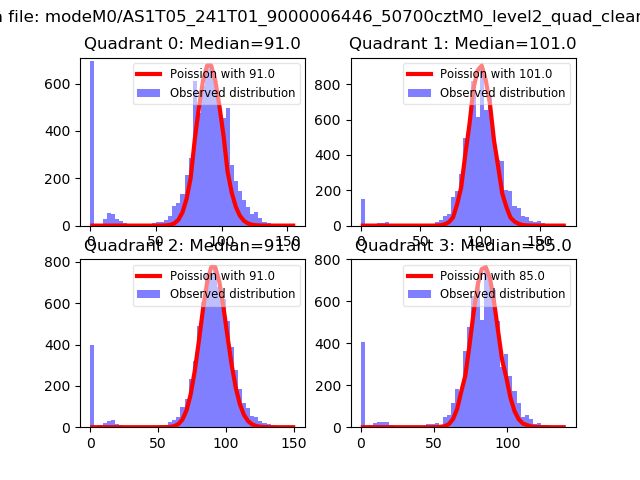 |
 |
| Quadrant-wise count rates Data is divided into 100 sec bins |
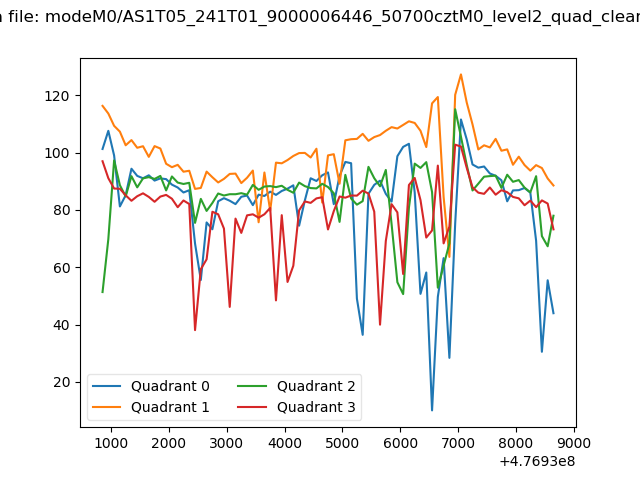 |
|
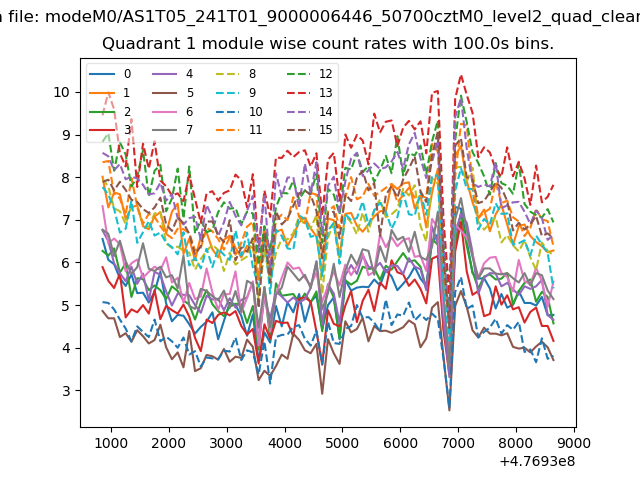
| Module-wise count rates for Quadrant A Data is divided into 100 sec bins |
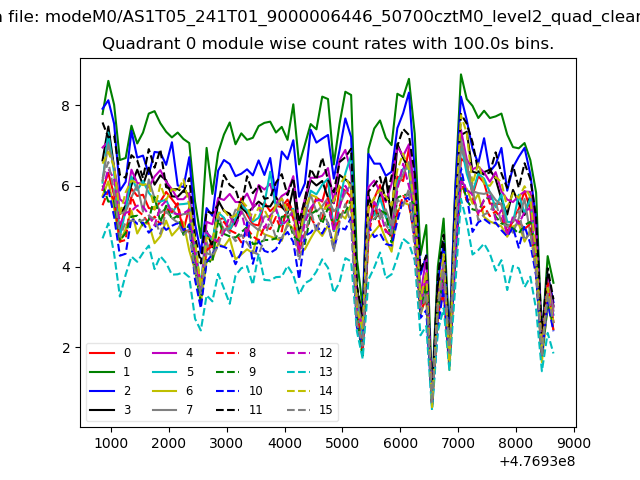 |
 |
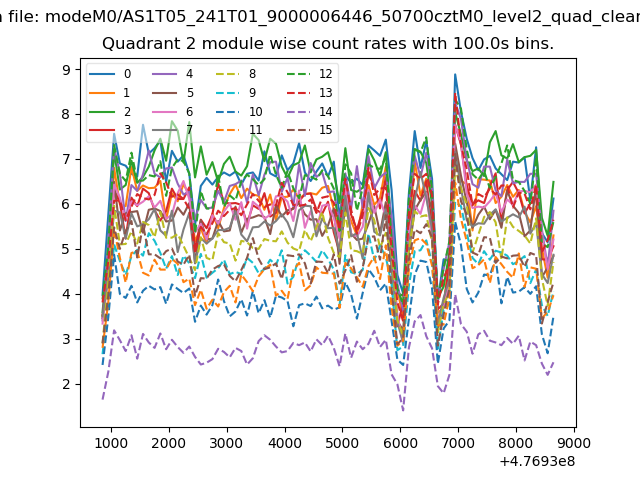
| Module-wise count rates for Quadrant B Data is divided into 100 sec bins |
 |
 |
| Module-wise count rates for Quadrant C Data is divided into 100 sec bins |
 |
 |
| Module-wise count rates for Quadrant D Data is divided into 100 sec bins |
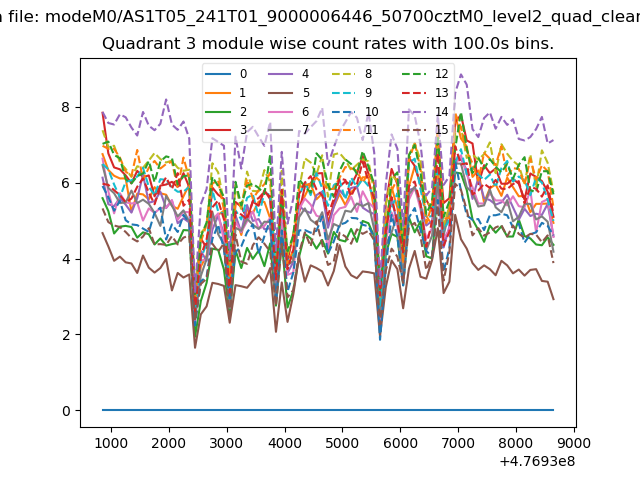 |
 |
| Parameter | Plot |
|---|---|
| CZT HV Monitor | 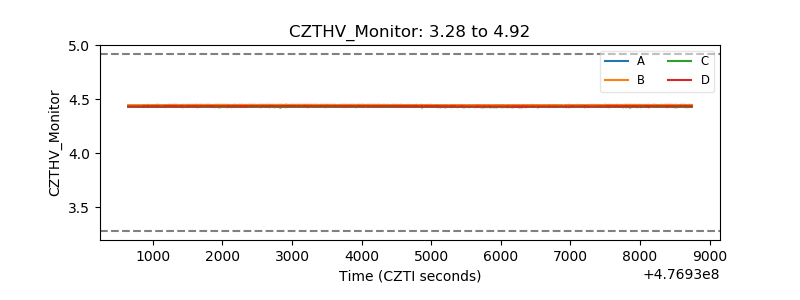 |
| D_VDD | 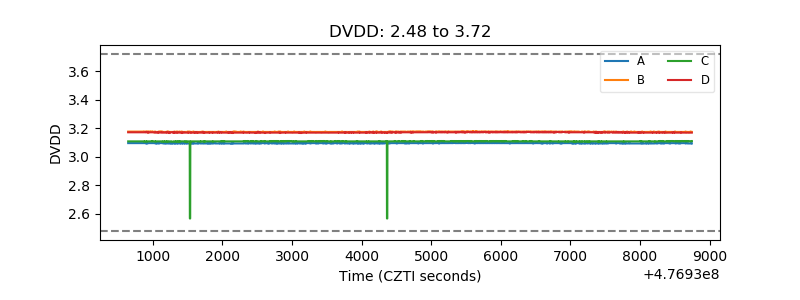 |
| Temperature 1 | 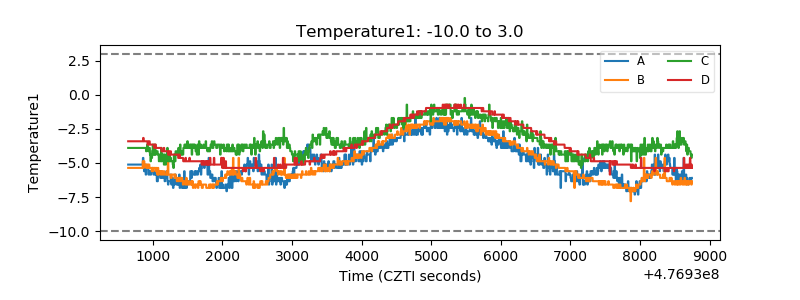 |
| Veto HV Monitor | 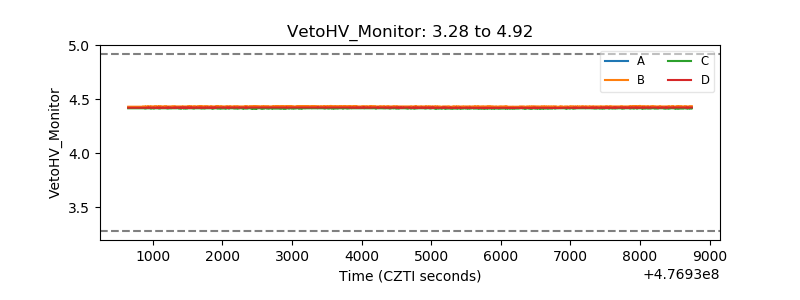 |
| Veto LLD | 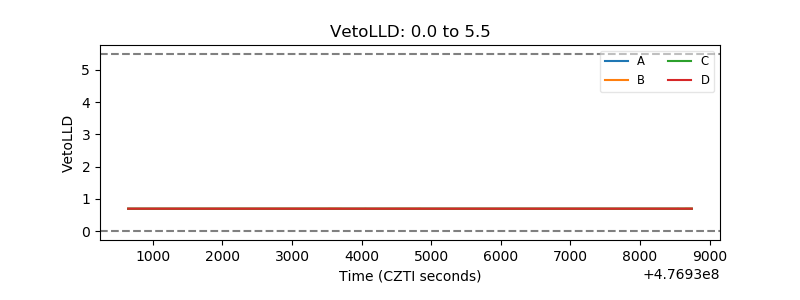 |
| Alpha Counter | 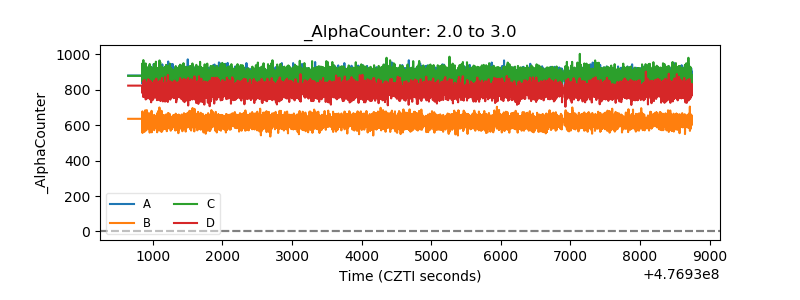 |
| _CPM_Rate | 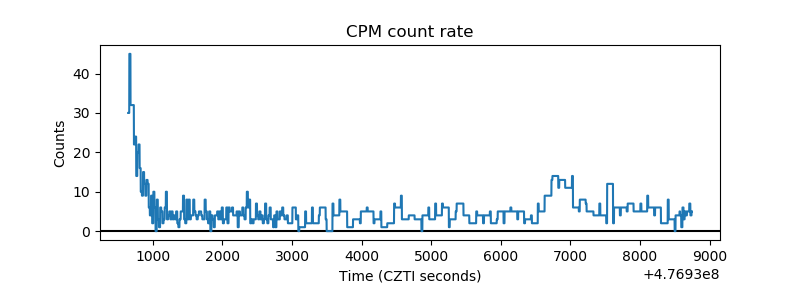 |
| CZT Counter | 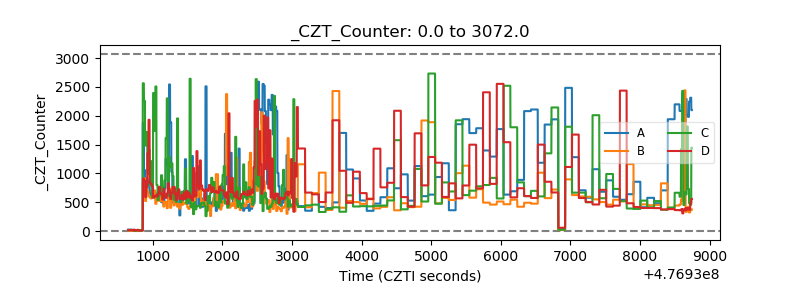 |
| +2.5 Volts monitor | 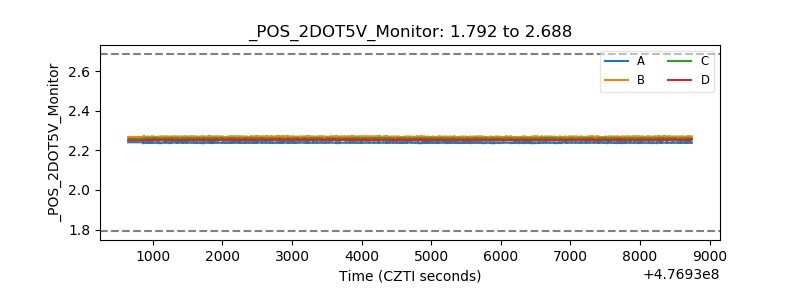 |
| +5 Volts monitor | 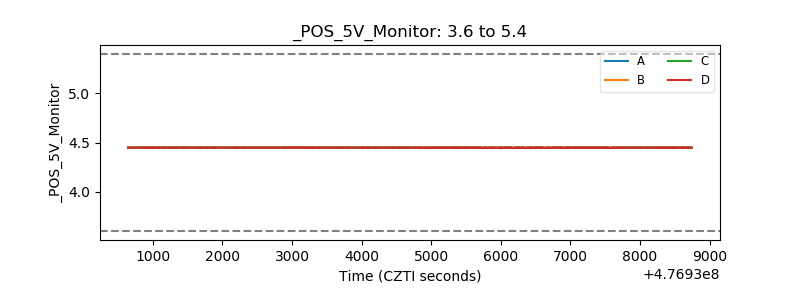 |
| _ROLL_ROT | 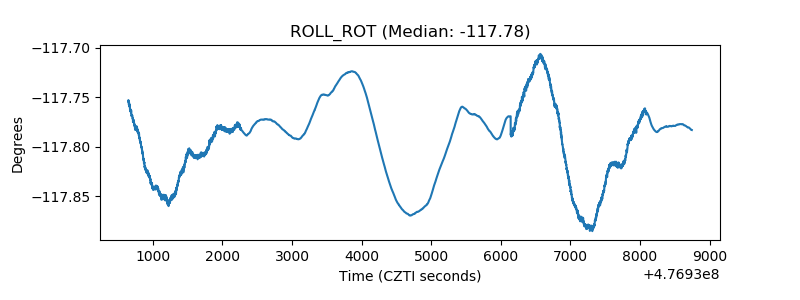 |
| _Roll_DEC | 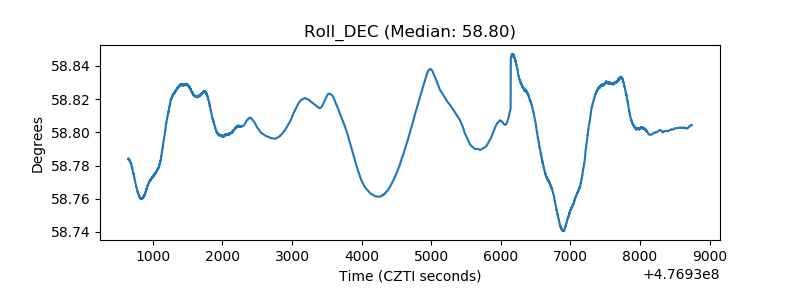 |
| _Roll_RA | 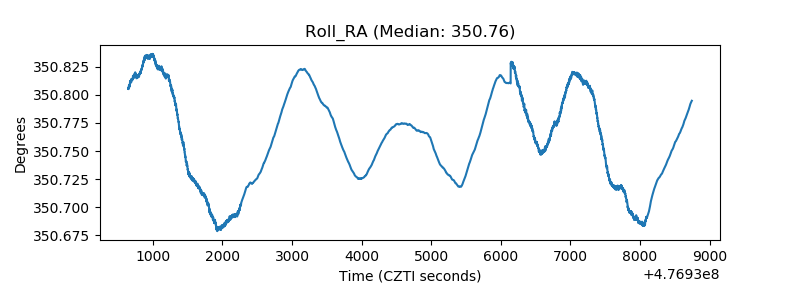 |
| Veto Counter | 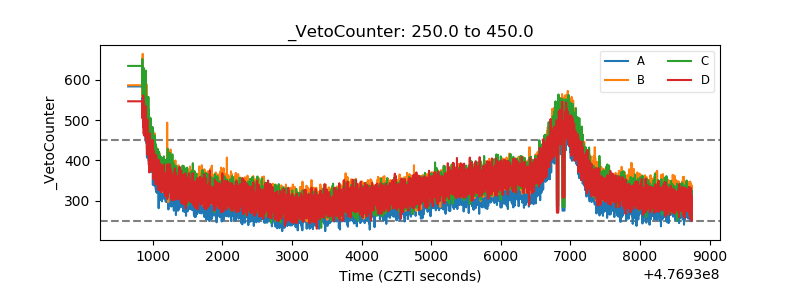 |