| Param | Original file | Final file |
|---|---|---|
| Filename | modeM0/AS1T05_241T01_9000006446_50701cztM0_level2.fits | modeM0/AS1T05_241T01_9000006446_50701cztM0_level2_quad_clean.evt |
| Size (bytes) | 702,083,520 | 111,556,800 |
| Size | 669.6 MB | 106.4 MB |
| Events in quadrant A | 7,727,455 | 688,921 |
| Events in quadrant B | 4,650,802 | 794,732 |
| Events in quadrant C | 6,943,998 | 683,403 |
| Events in quadrant D | 6,043,519 | 651,401 |
| Mode M0 | |||
|---|---|---|---|
| Quadrant | BADHDUFLAG | Total packets | Discarded packets |
| A | 0 | 28335 | 0 |
| B | 0 | 19608 | 0 |
| C | 0 | 26280 | 0 |
| D | 0 | 23712 | 0 |
| Mode SS | |||
|---|---|---|---|
| Quadrant | BADHDUFLAG | Total packets | Discarded packets |
| A | 0 | 160 | 0 |
| B | 0 | 160 | 0 |
| C | 0 | 160 | 0 |
| D | 0 | 160 | 0 |
| Quadrant | Total seconds | Saturated seconds | Saturation percentage |
|---|---|---|---|
| A | 8047 | 847 | 10.525662% |
| B | 8048 | 308 | 3.827038% |
| C | 8048 | 800 | 9.940358% |
| D | 8048 | 517 | 6.423956% |
Noise dominated data is calculated using 1-second bins in cleaned event files. If a bin has >2000 counts, and if more than 50% of those come from <1% of pixels, then it is considered to be noise-dominated and hence unusable.
| Quadrant | # 1 sec bins | Bins with >0 counts | Bins with >2000 counts | High rate bins dominated by noise | Noise dominated (total time) | Noise dominated (detector-on time) | Marked lightcurve |
|---|---|---|---|---|---|---|---|
| A | 8047 | 8047 | 986 | 986 | 12.25% | 12.25% | 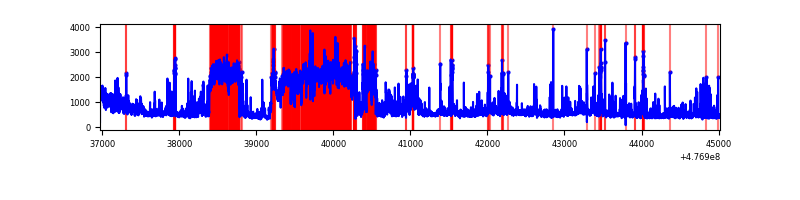 |
| B | 8048 | 8048 | 201 | 201 | 2.50% | 2.50% | 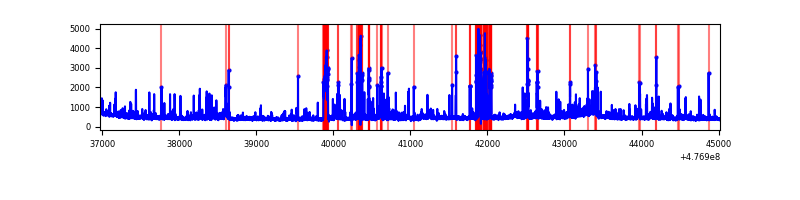 |
| C | 8048 | 8048 | 640 | 640 | 7.95% | 7.95% | 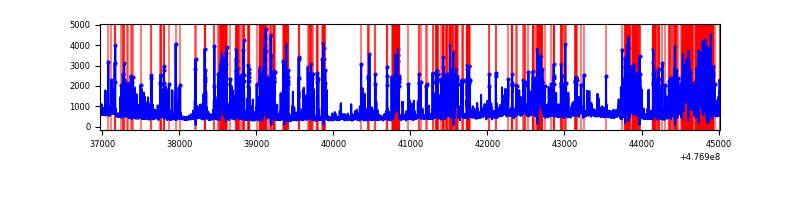 |
| D | 8048 | 8048 | 488 | 488 | 6.06% | 6.06% | 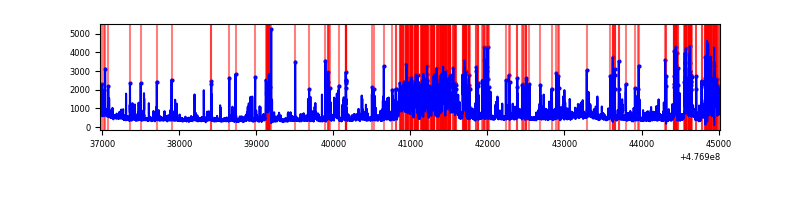 |
Top three noisy pixels from each quadrant. If the there are fewer than three noisy pixels in the level2.evt file, extra rows are filled as -1
| Pixel properties | Quadrant properties | ||||||
|---|---|---|---|---|---|---|---|
| Quadrant | DetID | PixID | Counts | Sigma | Mean | Median | Sigma |
| A | 12 | 80 | 2793225 | 13503.37 | 832 | 811 | 206.8 |
| A | 4 | 3 | 355399 | 1714.69 | 832 | 811 | 206.8 |
| A | 4 | 249 | 215868 | 1039.96 | 832 | 811 | 206.8 |
| B | 0 | 229 | 549504 | 3062.81 | 839 | 808 | 179.1 |
| B | 4 | 170 | 309288 | 1721.93 | 839 | 808 | 179.1 |
| B | 0 | 213 | 60463 | 332.99 | 839 | 808 | 179.1 |
| C | 5 | 10 | 1403432 | 6253.81 | 806 | 800 | 224.3 |
| C | 4 | 5 | 497972 | 2216.71 | 806 | 800 | 224.3 |
| C | 0 | 209 | 309934 | 1378.31 | 806 | 800 | 224.3 |
| D | 2 | 249 | 578402 | 2596.91 | 804 | 777 | 222.4 |
| D | 15 | 108 | 576776 | 2589.6 | 804 | 777 | 222.4 |
| D | 1 | 47 | 343964 | 1542.91 | 804 | 777 | 222.4 |
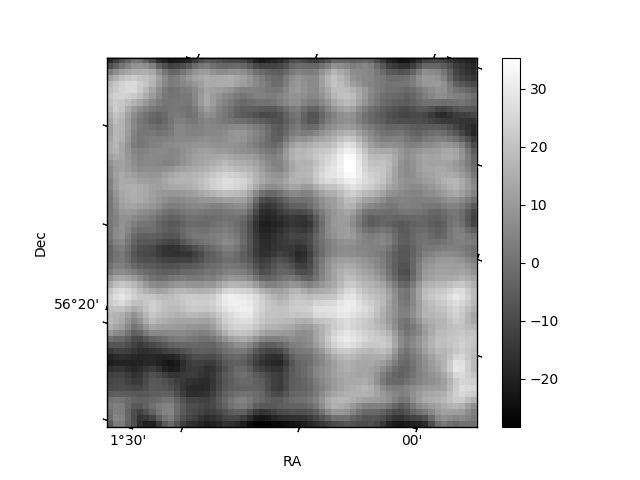
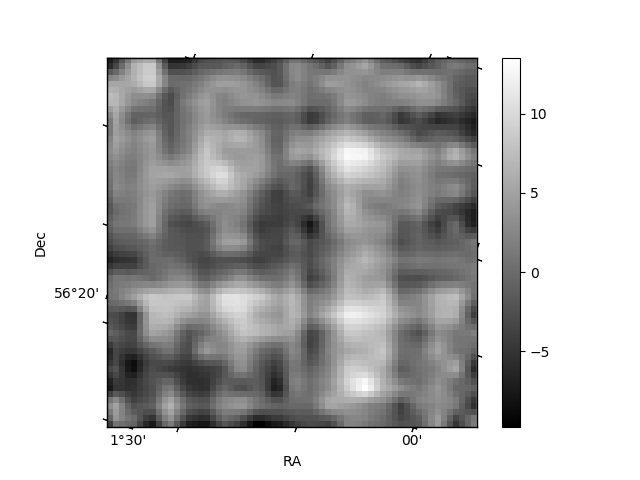
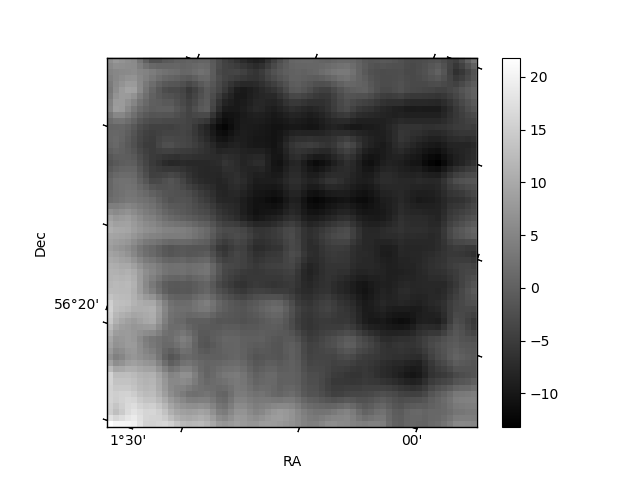
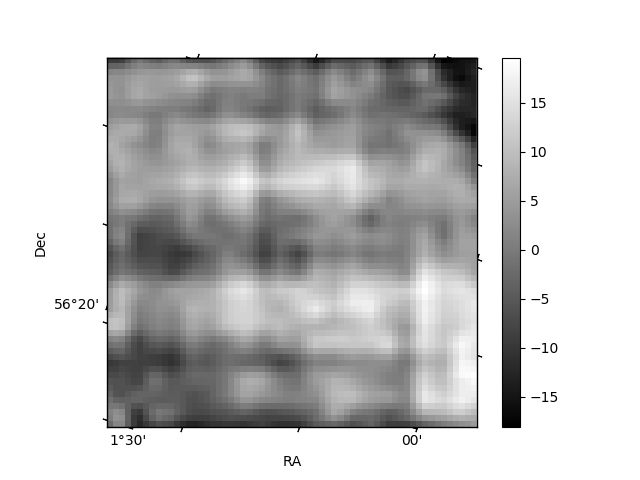
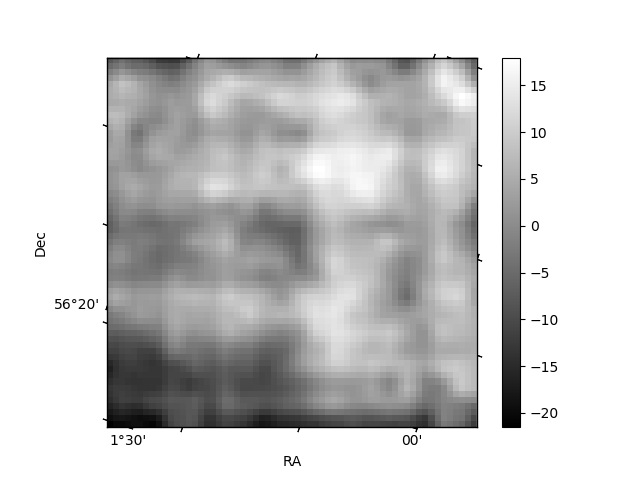
Histogram calculated using DETX and DETY for each event in the final _common_clean file
| Quadrant A | 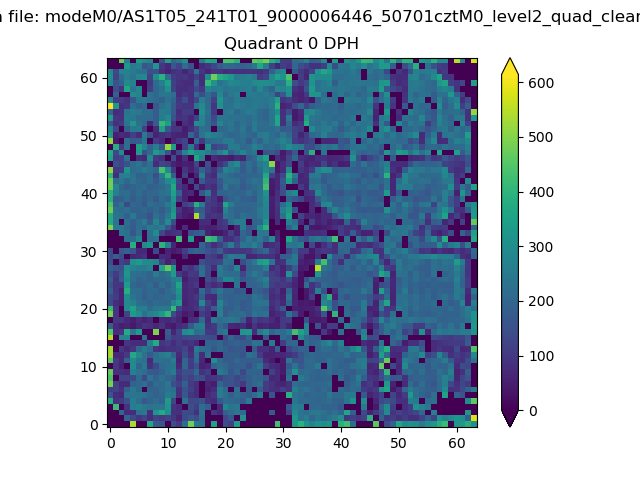 |
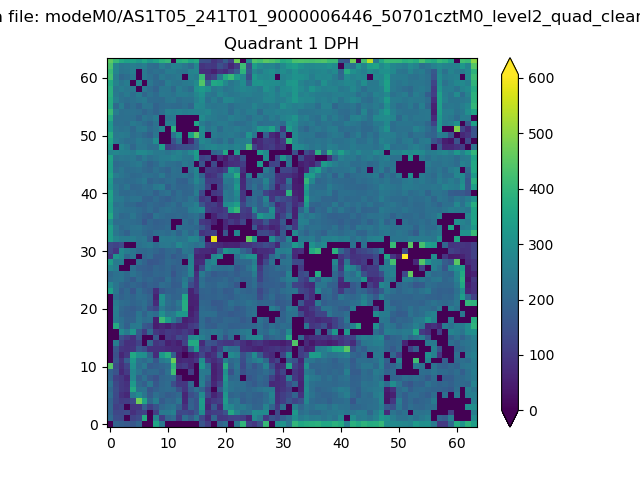 |
Quadrant B |
|---|---|---|---|
| Quadrant D | 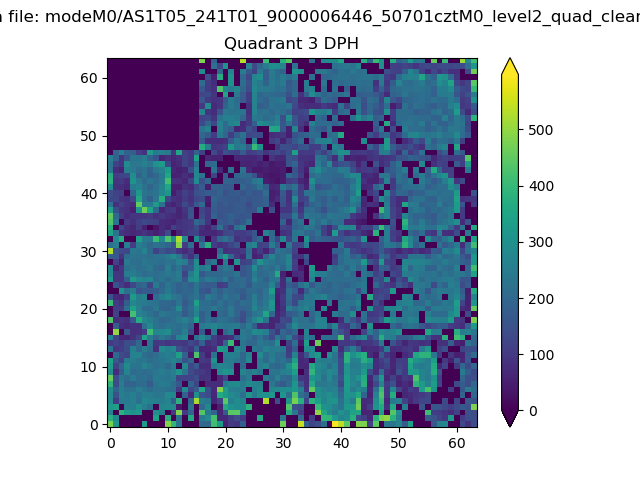 |
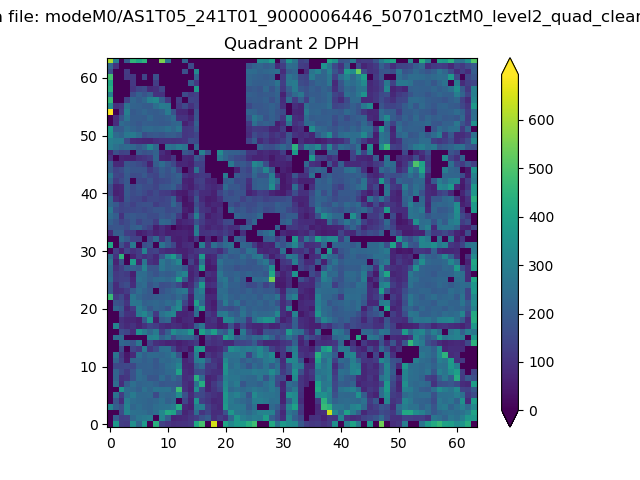 |
Quadrant C |
| Plot type | Count rate plots | Images |
|---|---|---|
| Comparison with Poisson distribution Blue bars denote a histogram of data divided into 1 sec bins. Red curve is a Poisson curve with rate = median count rate of data. |
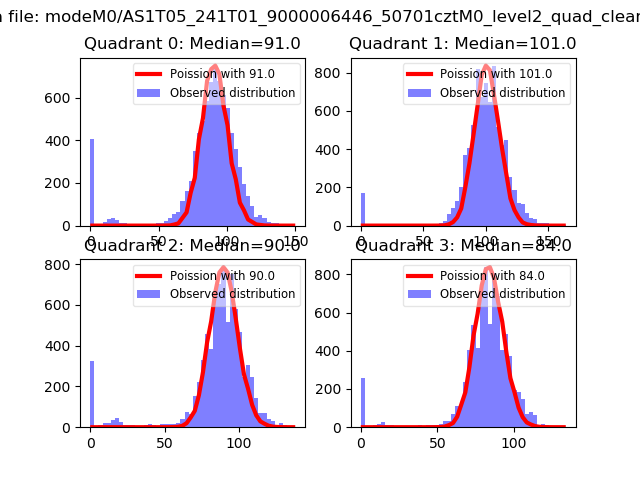 |
 |
| Quadrant-wise count rates Data is divided into 100 sec bins |
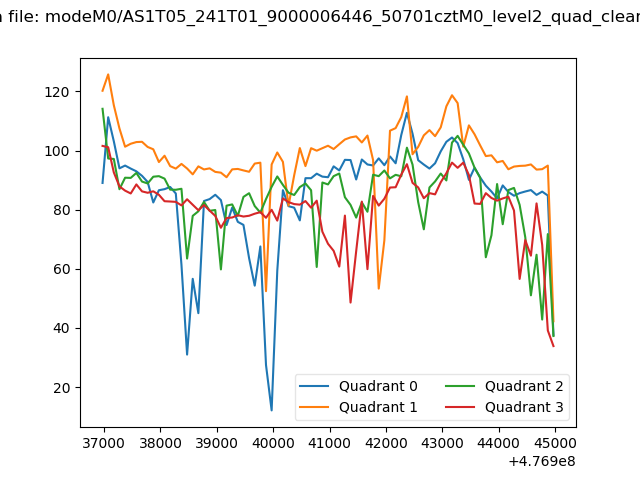 |
|
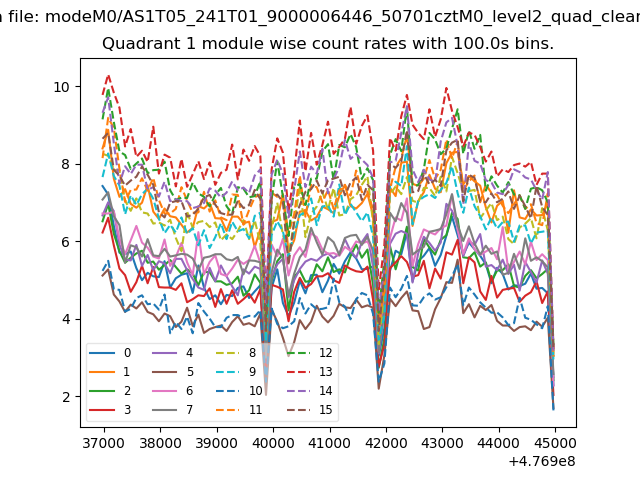
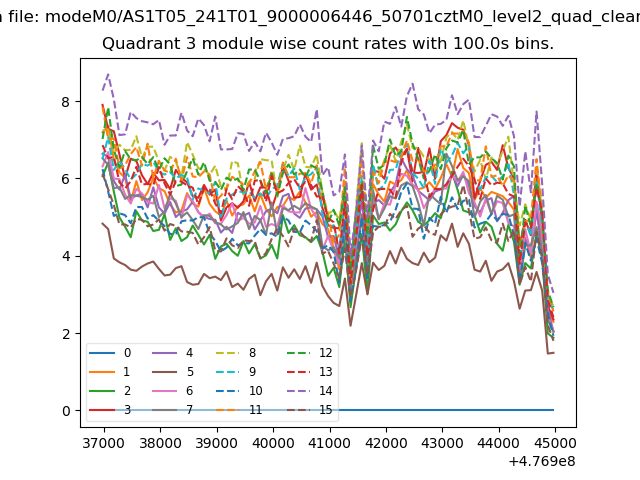
| Module-wise count rates for Quadrant A Data is divided into 100 sec bins |
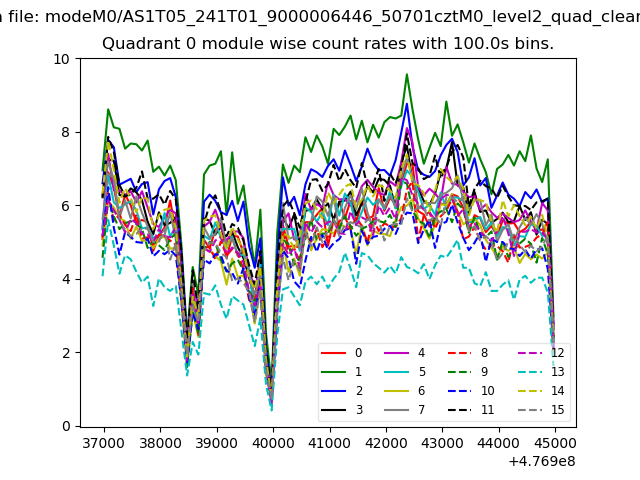 |
 |
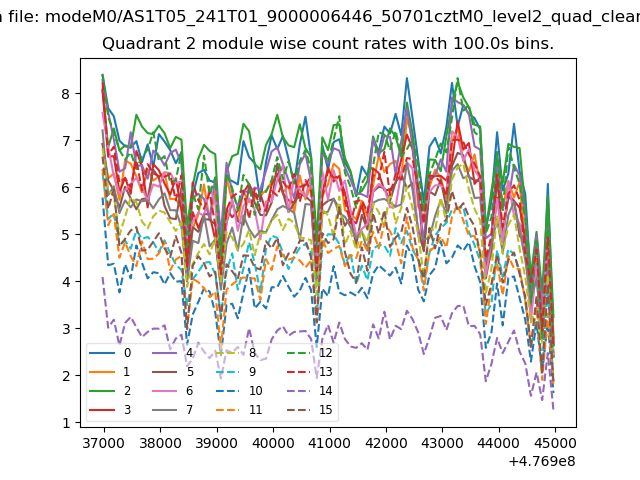
| Module-wise count rates for Quadrant B Data is divided into 100 sec bins |
 |
 |
| Module-wise count rates for Quadrant C Data is divided into 100 sec bins |
 |
 |
| Module-wise count rates for Quadrant D Data is divided into 100 sec bins |
 |
 |
| Parameter | Plot |
|---|---|
| CZT HV Monitor | 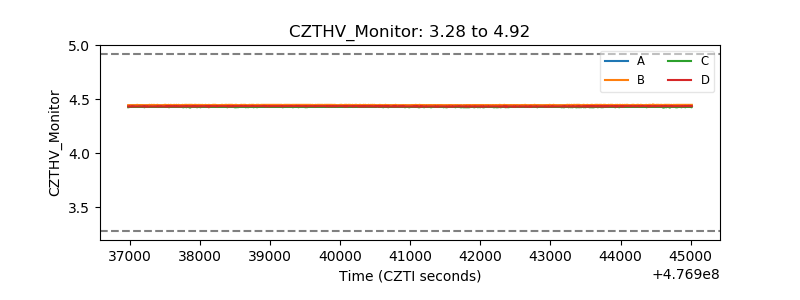 |
| D_VDD | 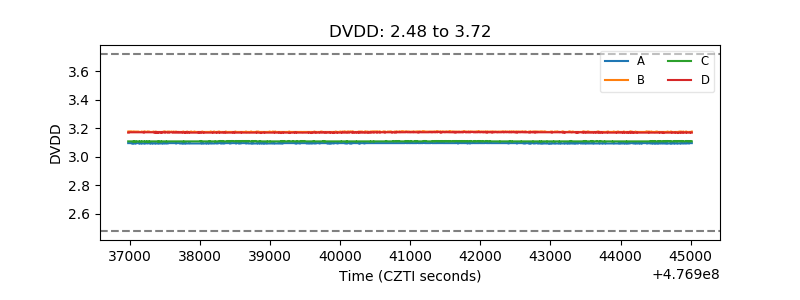 |
| Temperature 1 | 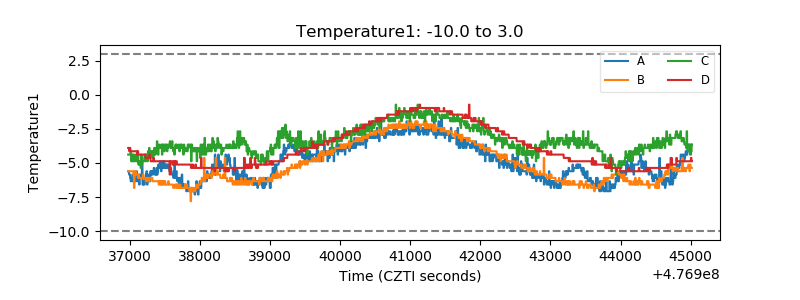 |
| Veto HV Monitor | 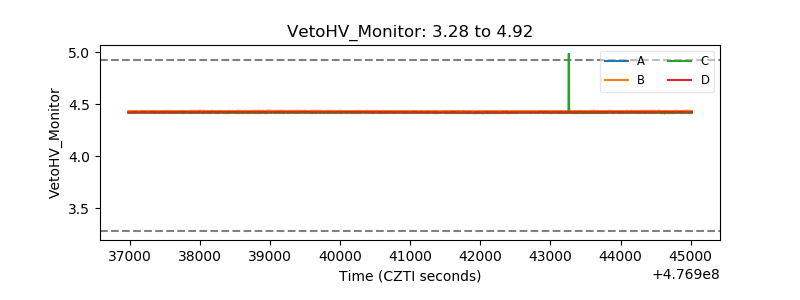 |
| Veto LLD | 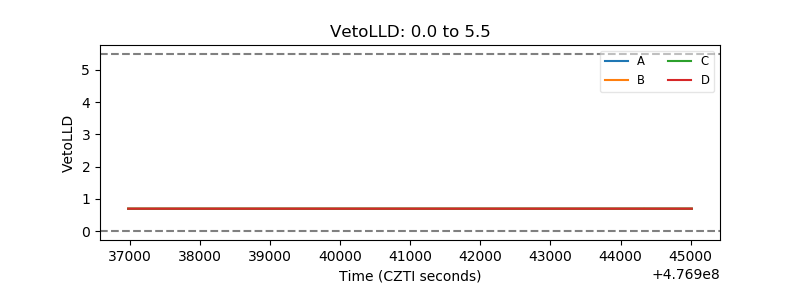 |
| Alpha Counter | 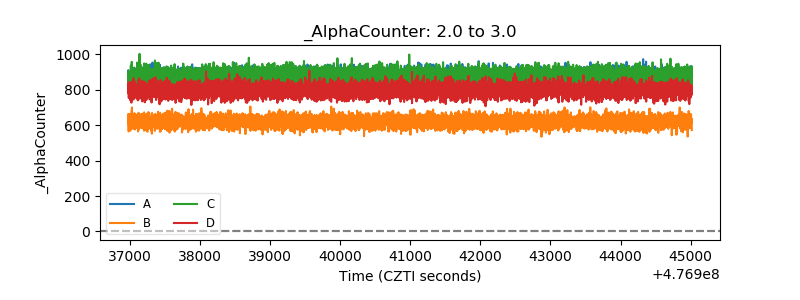 |
| _CPM_Rate | 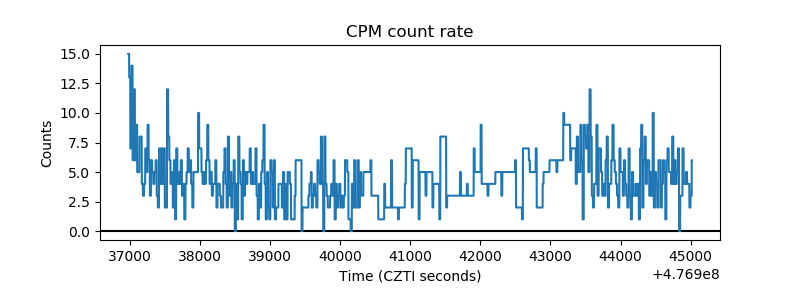 |
| CZT Counter | 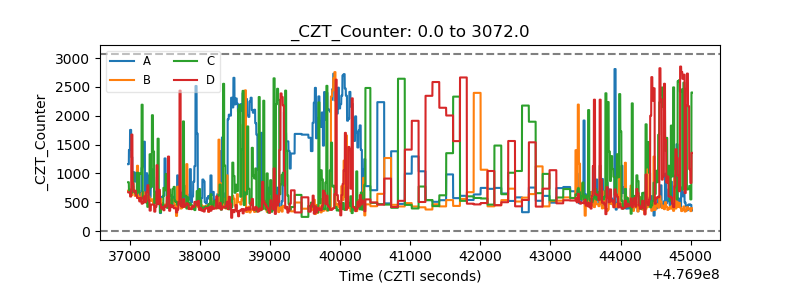 |
| +2.5 Volts monitor | 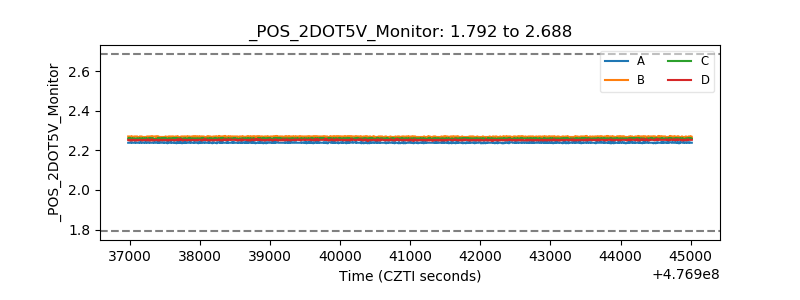 |
| +5 Volts monitor | 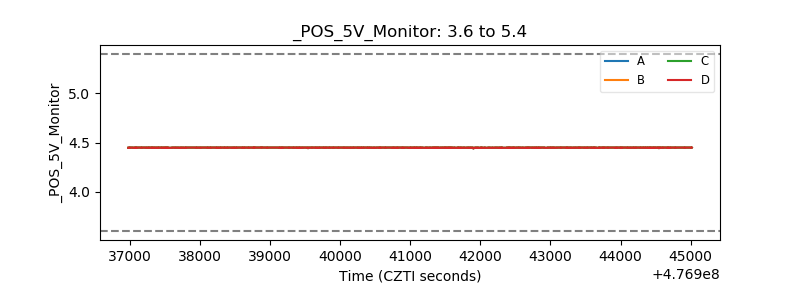 |
| _ROLL_ROT | 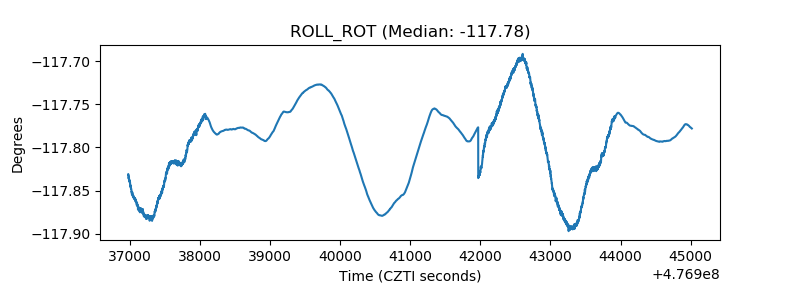 |
| _Roll_DEC | 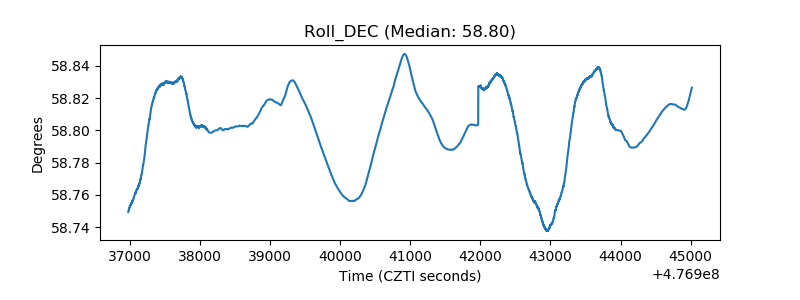 |
| _Roll_RA | 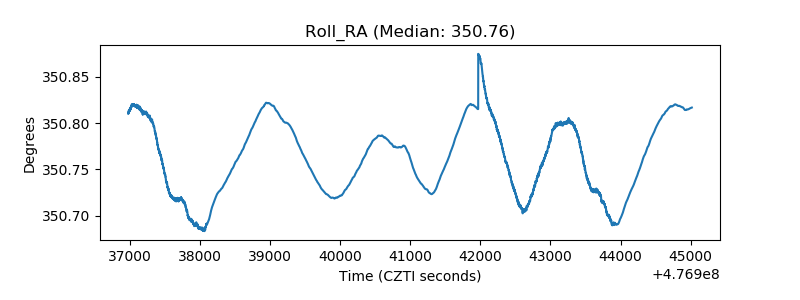 |
| Veto Counter | 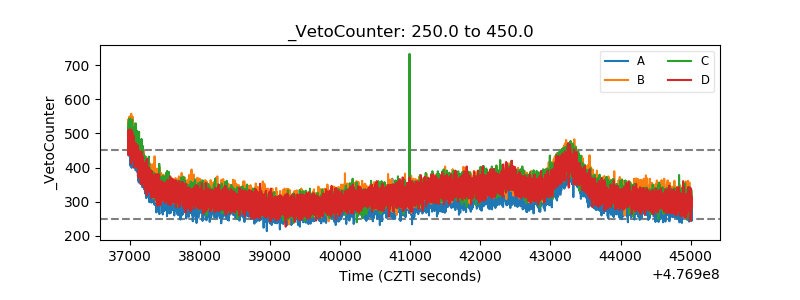 |