| Param | Original file | Final file |
|---|---|---|
| Filename | modeM0/AS1T05_241T01_9000006446_50702cztM0_level2.fits | modeM0/AS1T05_241T01_9000006446_50702cztM0_level2_quad_clean.evt |
| Size (bytes) | 759,769,920 | 106,375,680 |
| Size | 724.6 MB | 101.4 MB |
| Events in quadrant A | 5,851,149 | 705,639 |
| Events in quadrant B | 4,188,389 | 795,337 |
| Events in quadrant C | 10,215,531 | 556,905 |
| Events in quadrant D | 7,254,499 | 610,833 |
| Mode M0 | |||
|---|---|---|---|
| Quadrant | BADHDUFLAG | Total packets | Discarded packets |
| A | 0 | 22571 | 0 |
| B | 0 | 18192 | 0 |
| C | 0 | 35886 | 2 |
| D | 0 | 27079 | 0 |
| Mode SS | |||
|---|---|---|---|
| Quadrant | BADHDUFLAG | Total packets | Discarded packets |
| A | 0 | 158 | 0 |
| B | 0 | 158 | 0 |
| C | 0 | 158 | 0 |
| D | 0 | 158 | 0 |
| Quadrant | Total seconds | Saturated seconds | Saturation percentage |
|---|---|---|---|
| A | 7940 | 431 | 5.428212% |
| B | 7941 | 132 | 1.662259% |
| C | 7940 | 2056 | 25.894207% |
| D | 7940 | 926 | 11.662469% |
Noise dominated data is calculated using 1-second bins in cleaned event files. If a bin has >2000 counts, and if more than 50% of those come from <1% of pixels, then it is considered to be noise-dominated and hence unusable.
| Quadrant | # 1 sec bins | Bins with >0 counts | Bins with >2000 counts | High rate bins dominated by noise | Noise dominated (total time) | Noise dominated (detector-on time) | Marked lightcurve |
|---|---|---|---|---|---|---|---|
| A | 7940 | 7940 | 276 | 276 | 3.48% | 3.48% | 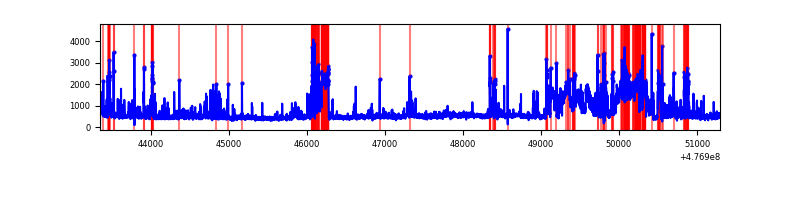 |
| B | 7941 | 7941 | 85 | 85 | 1.07% | 1.07% | 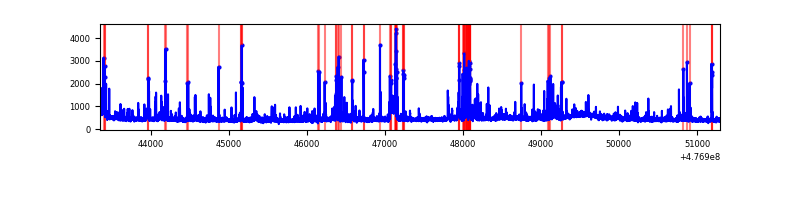 |
| C | 7940 | 7940 | 1510 | 1510 | 19.02% | 19.02% | 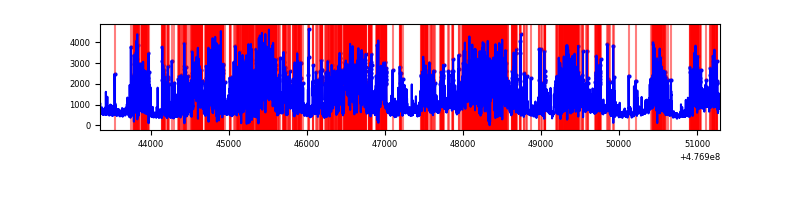 |
| D | 7940 | 7940 | 888 | 888 | 11.18% | 11.18% |  |
Top three noisy pixels from each quadrant. If the there are fewer than three noisy pixels in the level2.evt file, extra rows are filled as -1
| Pixel properties | Quadrant properties | ||||||
|---|---|---|---|---|---|---|---|
| Quadrant | DetID | PixID | Counts | Sigma | Mean | Median | Sigma |
| A | 12 | 80 | 1186479 | 5822.08 | 825 | 806 | 203.7 |
| A | 4 | 3 | 249709 | 1222.2 | 825 | 806 | 203.7 |
| A | 5 | 240 | 178091 | 870.53 | 825 | 806 | 203.7 |
| B | 0 | 229 | 153657 | 865.69 | 833 | 806 | 176.6 |
| B | 10 | 14 | 142043 | 799.92 | 833 | 806 | 176.6 |
| B | 5 | 185 | 111226 | 625.38 | 833 | 806 | 176.6 |
| C | 5 | 10 | 1393214 | 7025.94 | 720 | 717 | 198.2 |
| C | 13 | 236 | 892088 | 4497.47 | 720 | 717 | 198.2 |
| C | 15 | 212 | 598257 | 3014.93 | 720 | 717 | 198.2 |
| D | 1 | 47 | 1363333 | 6375.78 | 772 | 745 | 213.7 |
| D | 7 | 60 | 404777 | 1890.53 | 772 | 745 | 213.7 |
| D | 2 | 249 | 403202 | 1883.16 | 772 | 745 | 213.7 |
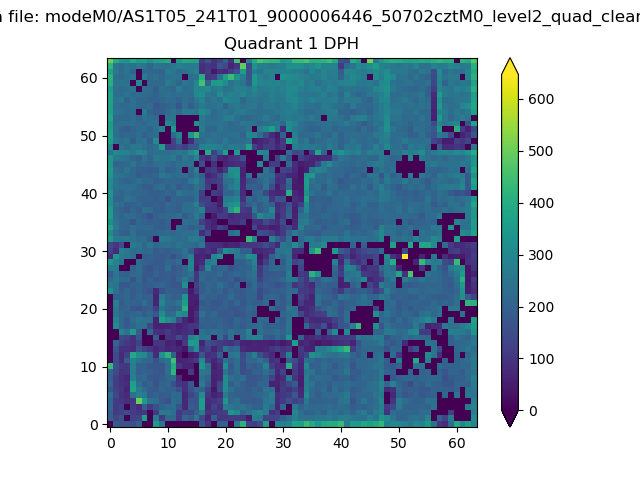
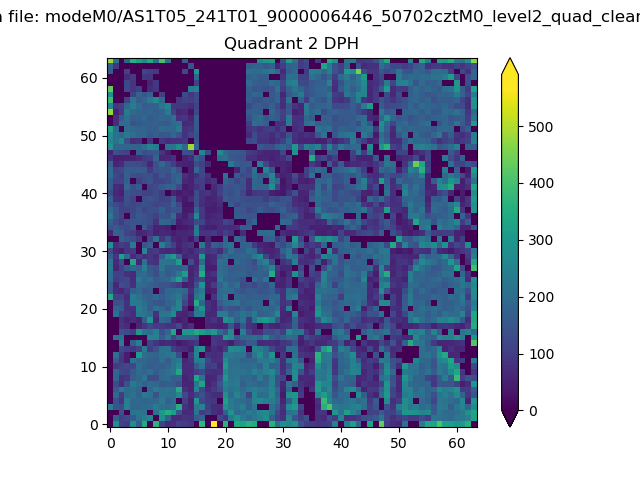
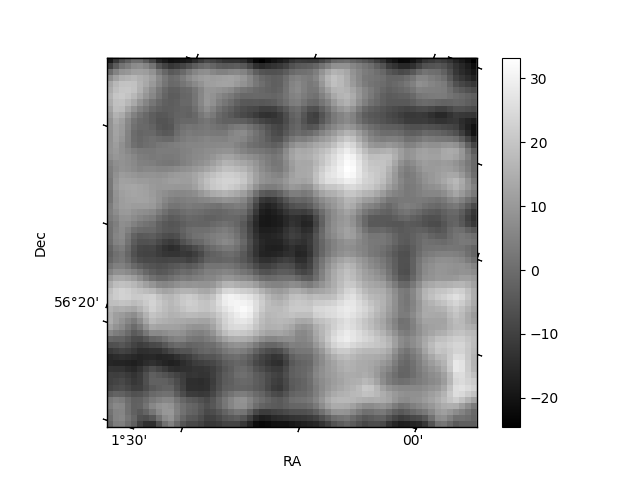
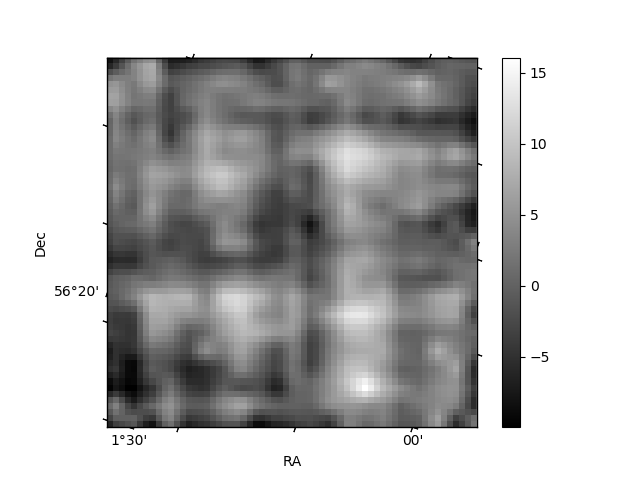
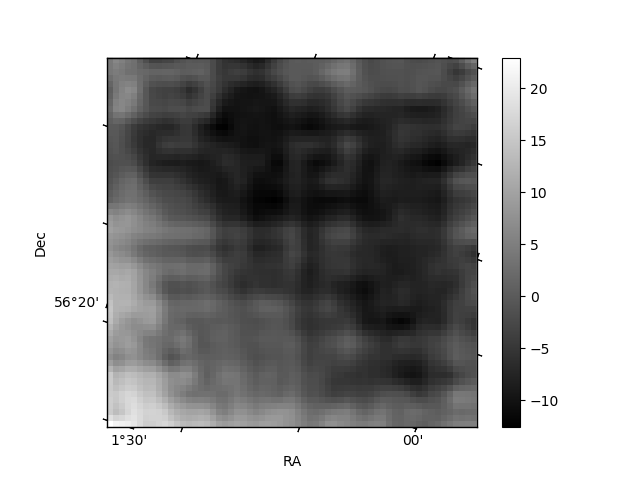
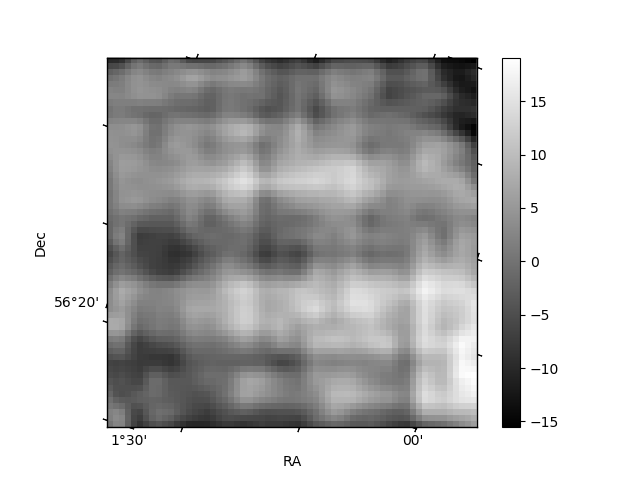
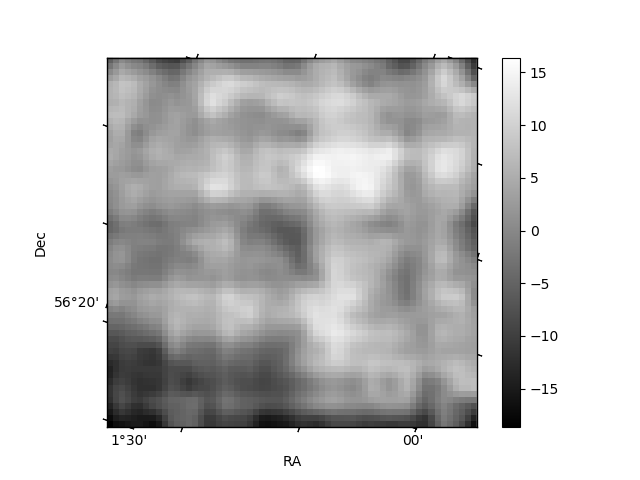
Histogram calculated using DETX and DETY for each event in the final _common_clean file
| Quadrant A | 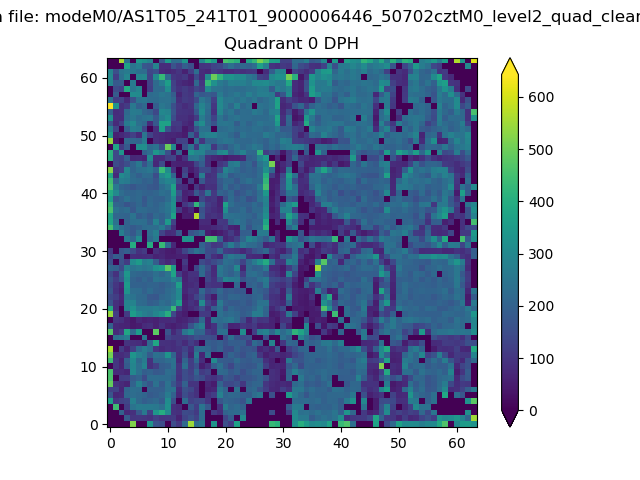 |
 |
Quadrant B |
|---|---|---|---|
| Quadrant D | 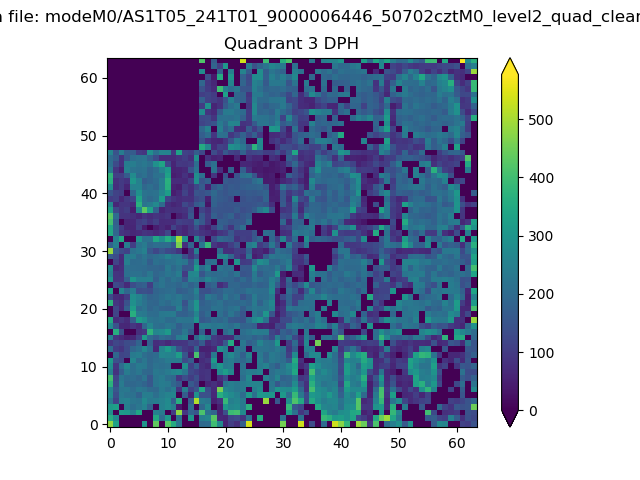 |
 |
Quadrant C |
| Plot type | Count rate plots | Images |
|---|---|---|
| Comparison with Poisson distribution Blue bars denote a histogram of data divided into 1 sec bins. Red curve is a Poisson curve with rate = median count rate of data. |
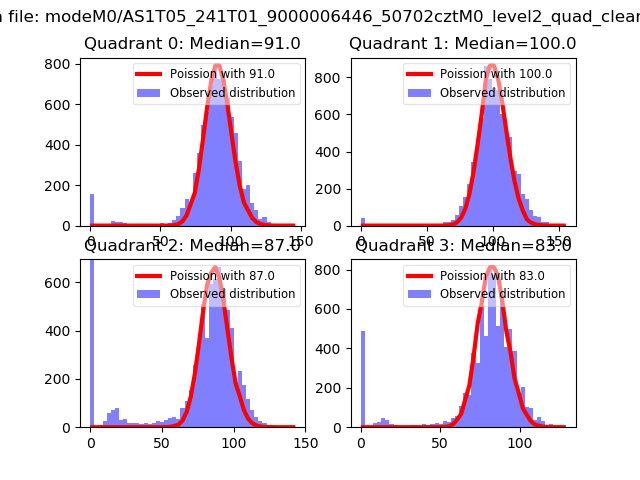 |
 |
| Quadrant-wise count rates Data is divided into 100 sec bins |
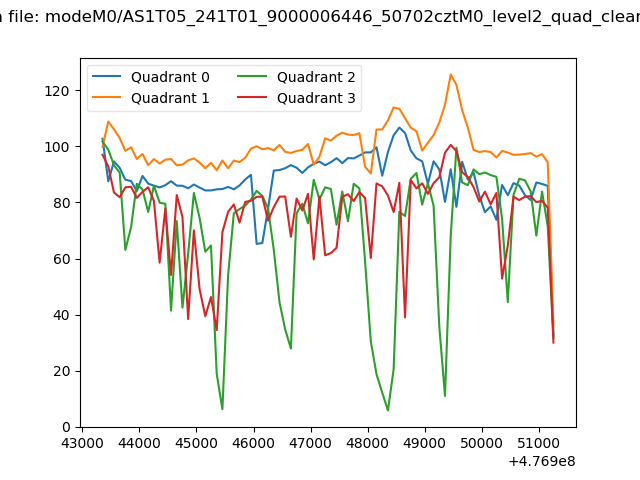 |
|
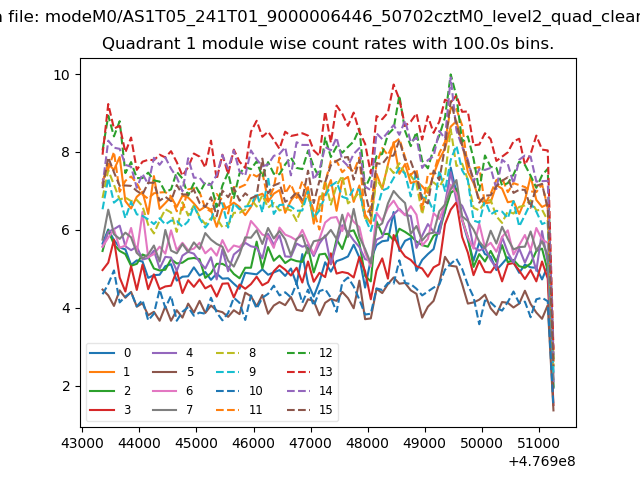
| Module-wise count rates for Quadrant A Data is divided into 100 sec bins |
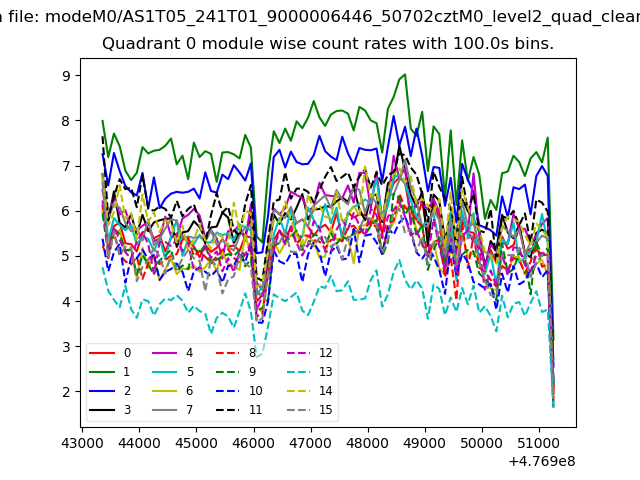 |
 |
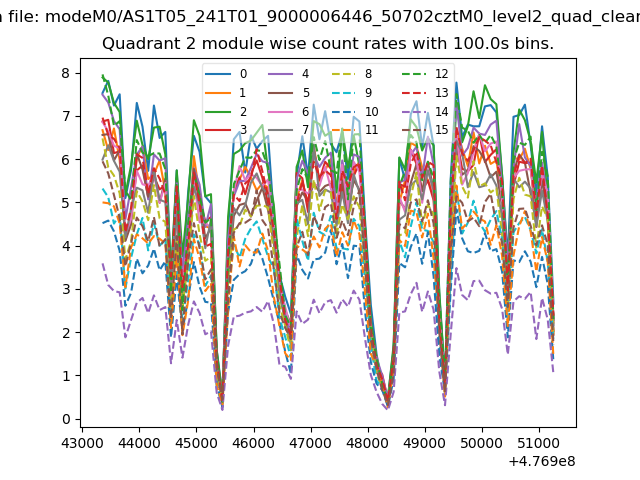
| Module-wise count rates for Quadrant B Data is divided into 100 sec bins |
 |
 |
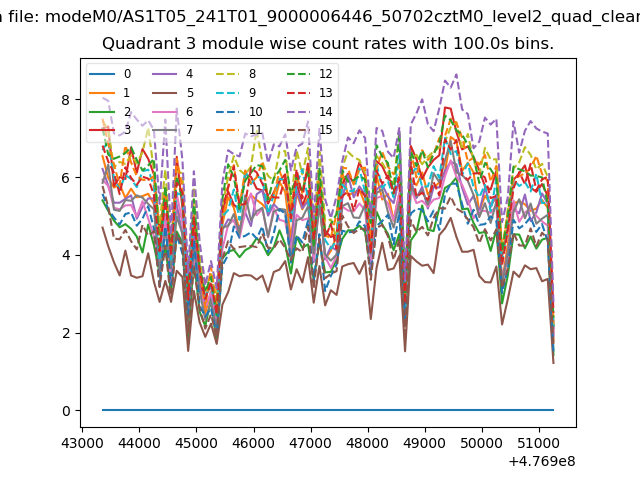
| Module-wise count rates for Quadrant C Data is divided into 100 sec bins |
 |
 |
| Module-wise count rates for Quadrant D Data is divided into 100 sec bins |
 |
 |
| Parameter | Plot |
|---|---|
| CZT HV Monitor | 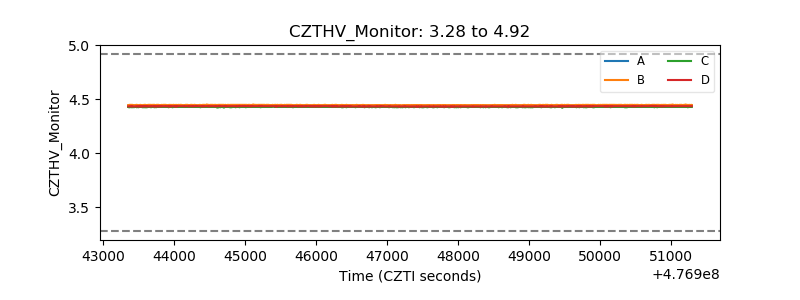 |
| D_VDD | 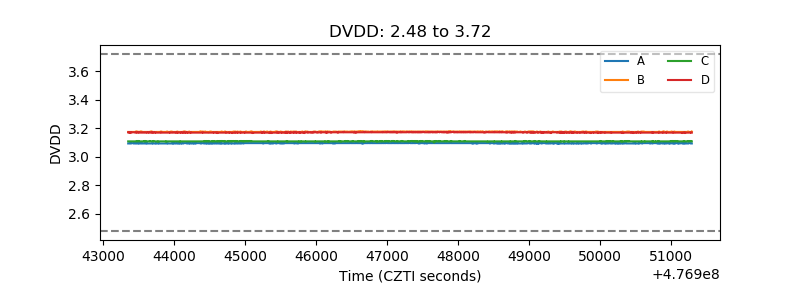 |
| Temperature 1 | 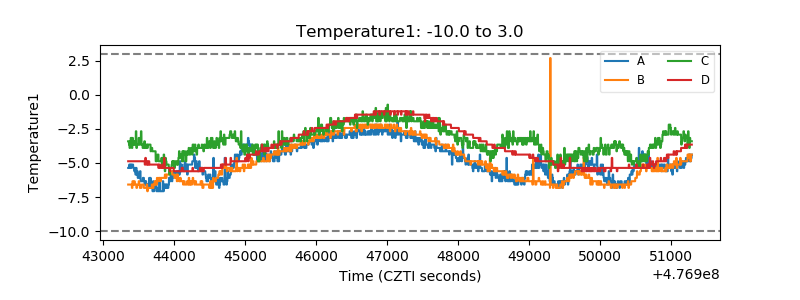 |
| Veto HV Monitor | 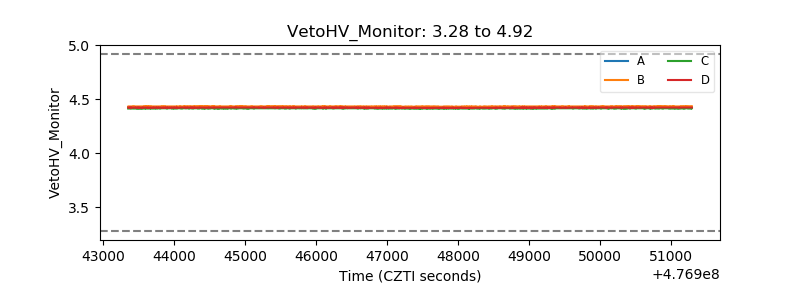 |
| Veto LLD | 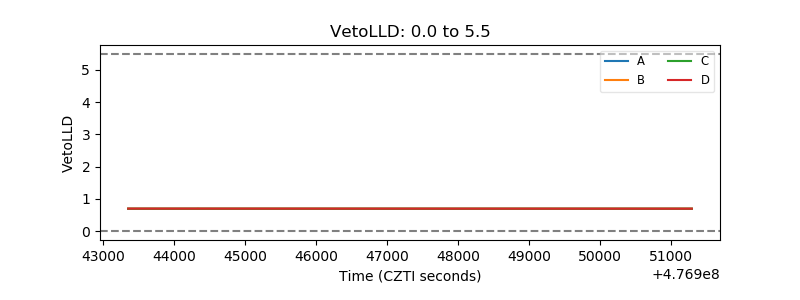 |
| Alpha Counter | 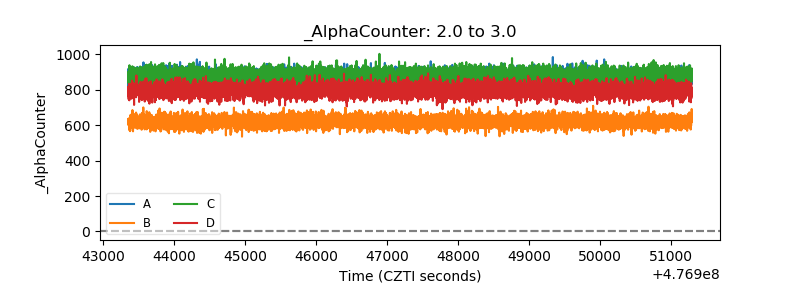 |
| _CPM_Rate | 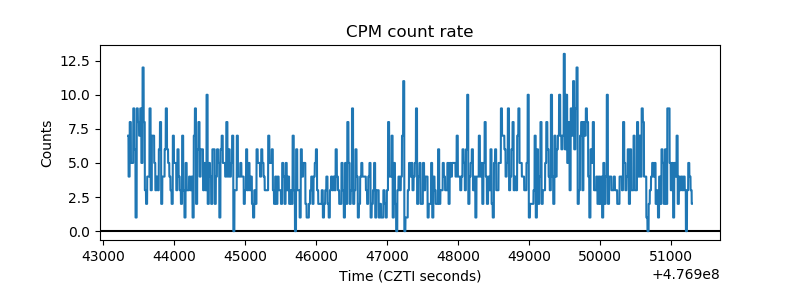 |
| CZT Counter | 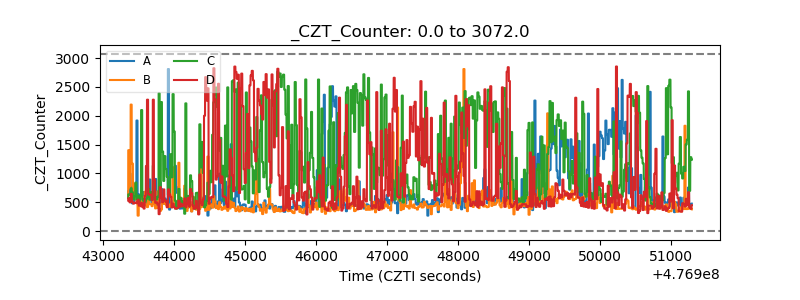 |
| +2.5 Volts monitor | 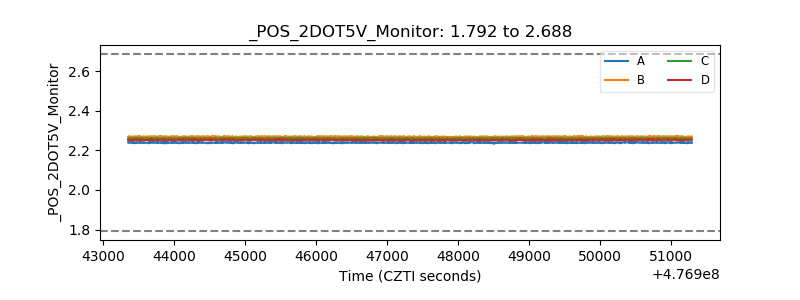 |
| +5 Volts monitor | 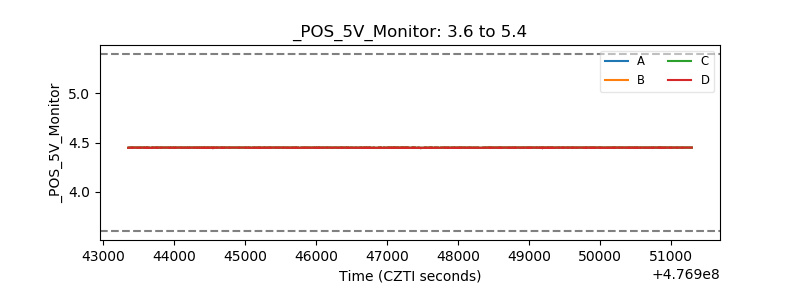 |
| _ROLL_ROT | 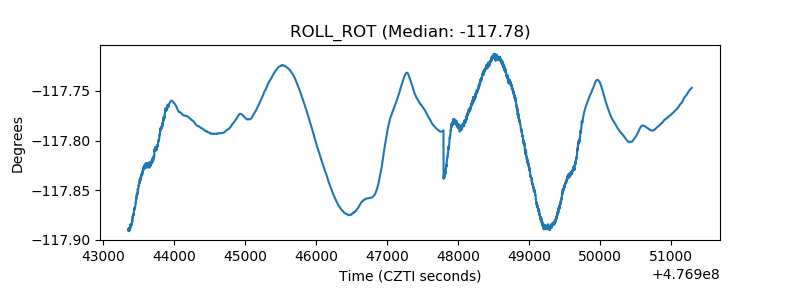 |
| _Roll_DEC | 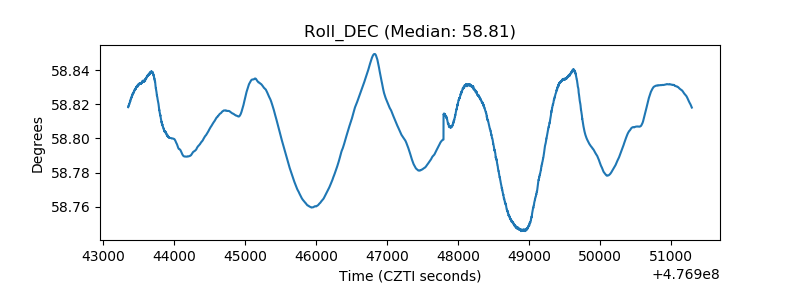 |
| _Roll_RA | 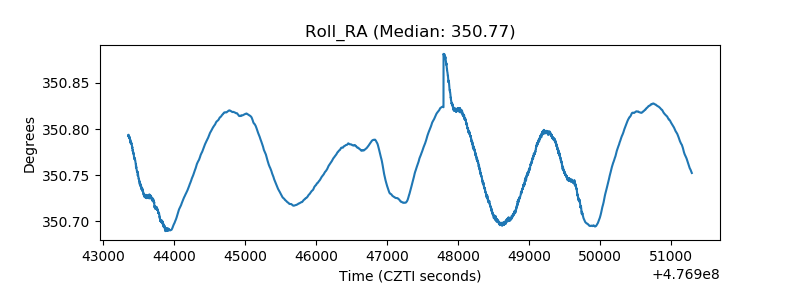 |
| Veto Counter | 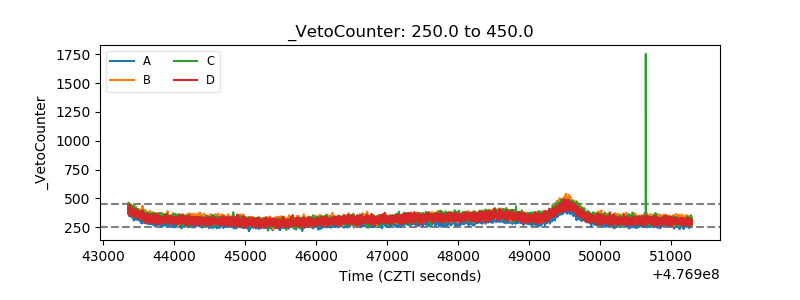 |