| Param | Original file | Final file |
|---|---|---|
| Filename | modeM0/AS1T05_241T01_9000006446_50705cztM0_level2.fits | modeM0/AS1T05_241T01_9000006446_50705cztM0_level2_quad_clean.evt |
| Size (bytes) | 2,011,541,760 | 233,340,480 |
| Size | 1.9 GB | 222.5 MB |
| Events in quadrant A | 15,278,193 | 1,614,599 |
| Events in quadrant B | 10,017,813 | 1,843,171 |
| Events in quadrant C | 29,375,273 | 949,304 |
| Events in quadrant D | 18,344,938 | 1,366,746 |
| Mode M9 | |||
|---|---|---|---|
| Quadrant | BADHDUFLAG | Total packets | Discarded packets |
| A | 0 | 10 | 0 |
| B | 0 | 10 | 0 |
| C | 0 | 10 | 0 |
| D | 0 | 10 | 0 |
| Mode M0 | |||
|---|---|---|---|
| Quadrant | BADHDUFLAG | Total packets | Discarded packets |
| A | 0 | 57708 | 2 |
| B | 0 | 43332 | 2 |
| C | 0 | 100238 | 2 |
| D | 0 | 67637 | 2 |
| Mode SS | |||
|---|---|---|---|
| Quadrant | BADHDUFLAG | Total packets | Discarded packets |
| A | 0 | 378 | 0 |
| B | 0 | 378 | 0 |
| C | 0 | 378 | 0 |
| D | 0 | 378 | 0 |
| Quadrant | Total seconds | Saturated seconds | Saturation percentage |
|---|---|---|---|
| A | 18719 | 1657 | 8.851969% |
| B | 18719 | 739 | 3.947860% |
| C | 18719 | 8280 | 44.233132% |
| D | 18719 | 2498 | 13.344730% |
Noise dominated data is calculated using 1-second bins in cleaned event files. If a bin has >2000 counts, and if more than 50% of those come from <1% of pixels, then it is considered to be noise-dominated and hence unusable.
| Quadrant | # 1 sec bins | Bins with >0 counts | Bins with >2000 counts | High rate bins dominated by noise | Noise dominated (total time) | Noise dominated (detector-on time) | Marked lightcurve |
|---|---|---|---|---|---|---|---|
| A | 19659 | 18721 | 1507 | 1507 | 7.67% | 8.05% | 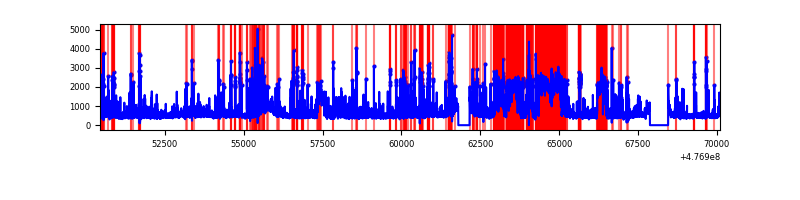 |
| B | 19659 | 18721 | 272 | 272 | 1.38% | 1.45% | 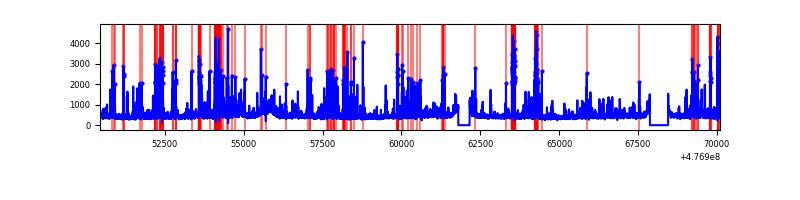 |
| C | 19659 | 18717 | 5869 | 5869 | 29.85% | 31.36% | 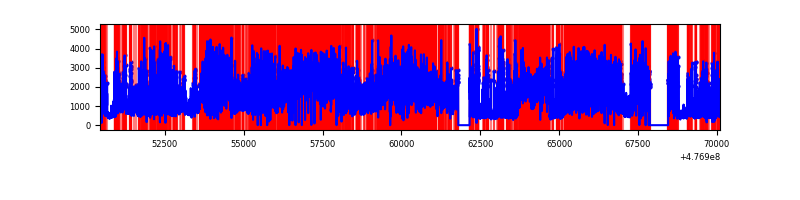 |
| D | 19659 | 18721 | 2114 | 2114 | 10.75% | 11.29% | 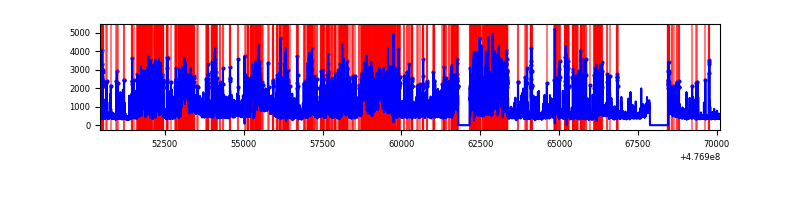 |
Top three noisy pixels from each quadrant. If the there are fewer than three noisy pixels in the level2.evt file, extra rows are filled as -1
| Pixel properties | Quadrant properties | ||||||
|---|---|---|---|---|---|---|---|
| Quadrant | DetID | PixID | Counts | Sigma | Mean | Median | Sigma |
| A | 12 | 80 | 3773745 | 7632.13 | 1985 | 1931 | 494.2 |
| A | 4 | 3 | 537196 | 1083.09 | 1985 | 1931 | 494.2 |
| A | 8 | 47 | 520147 | 1048.59 | 1985 | 1931 | 494.2 |
| B | 2 | 249 | 309897 | 726.87 | 1991 | 1917 | 423.7 |
| B | 4 | 216 | 233602 | 546.8 | 1991 | 1917 | 423.7 |
| B | 0 | 213 | 231916 | 542.82 | 1991 | 1917 | 423.7 |
| C | 0 | 193 | 8274289 | 20136.86 | 1489 | 1479 | 410.8 |
| C | 5 | 10 | 4838832 | 11774.61 | 1489 | 1479 | 410.8 |
| C | 15 | 148 | 2537935 | 6173.99 | 1489 | 1479 | 410.8 |
| D | 7 | 60 | 2266603 | 4331.46 | 1868 | 1804 | 522.9 |
| D | 15 | 108 | 1553461 | 2967.57 | 1868 | 1804 | 522.9 |
| D | 2 | 249 | 1299493 | 2481.85 | 1868 | 1804 | 522.9 |
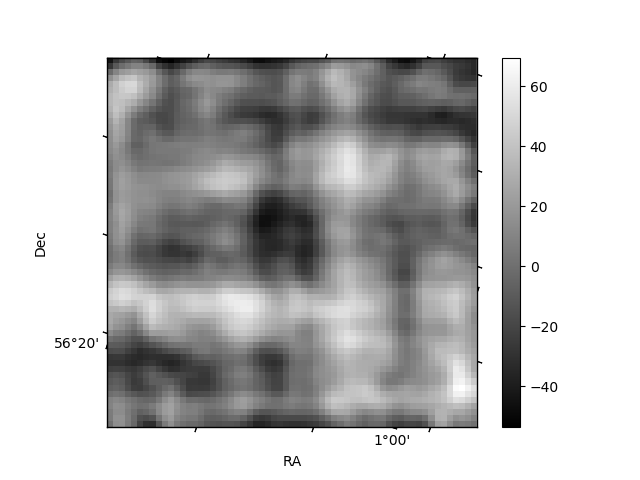
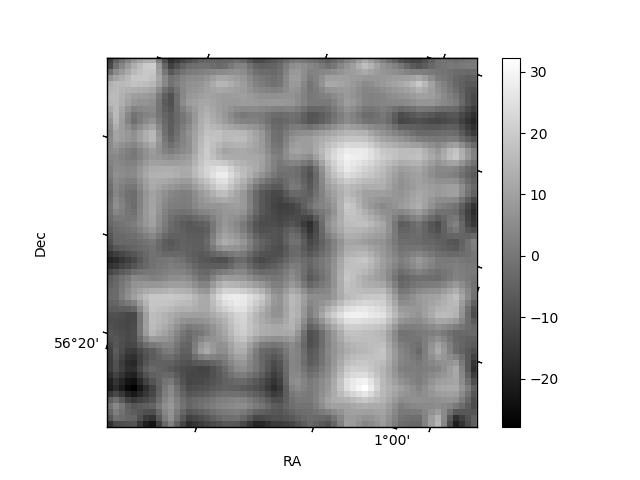
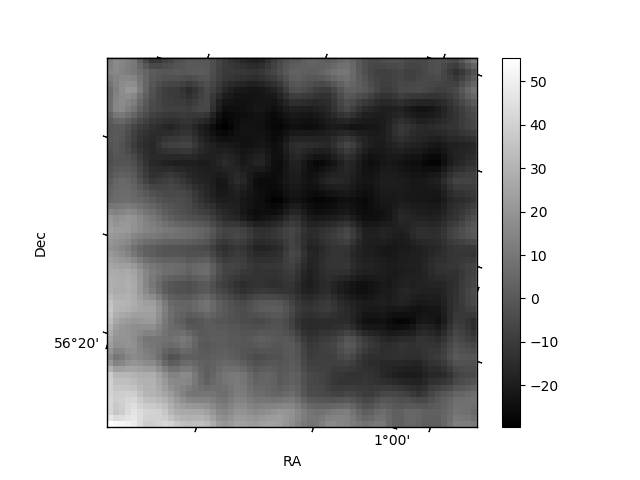
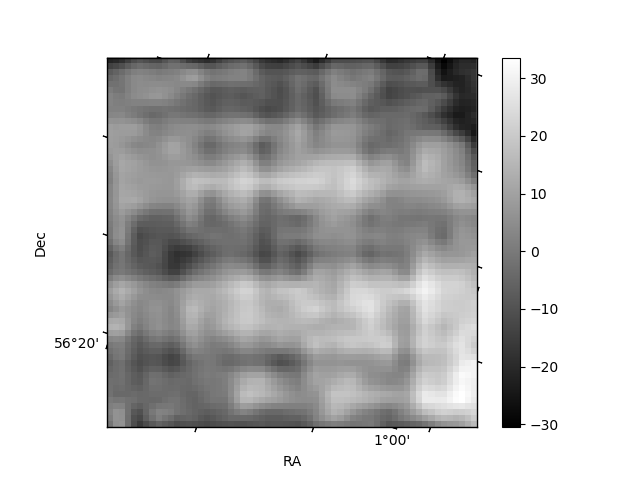
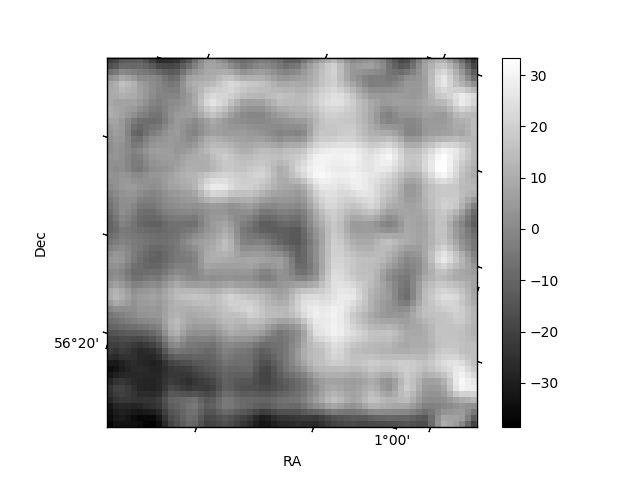
Histogram calculated using DETX and DETY for each event in the final _common_clean file
| Quadrant A | 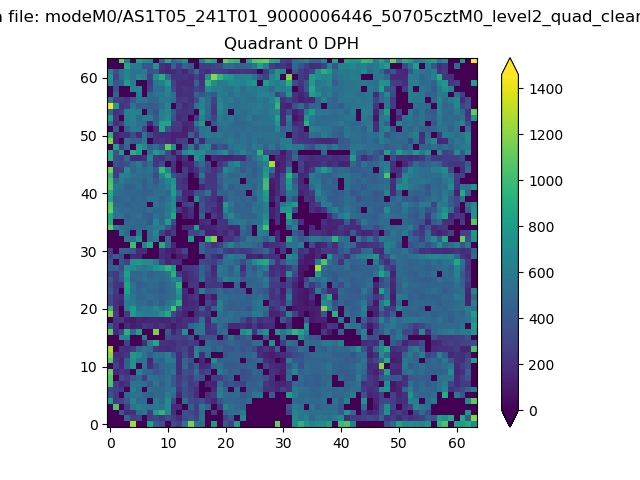 |
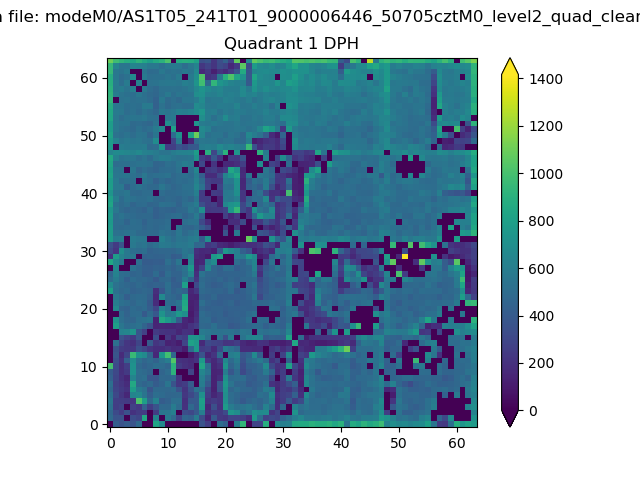 |
Quadrant B |
|---|---|---|---|
| Quadrant D | 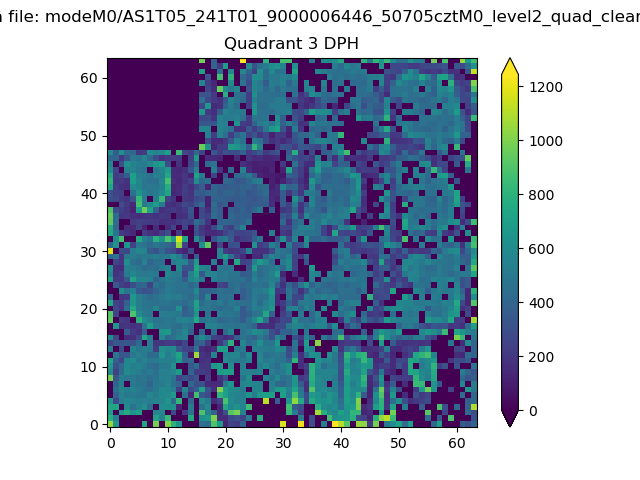 |
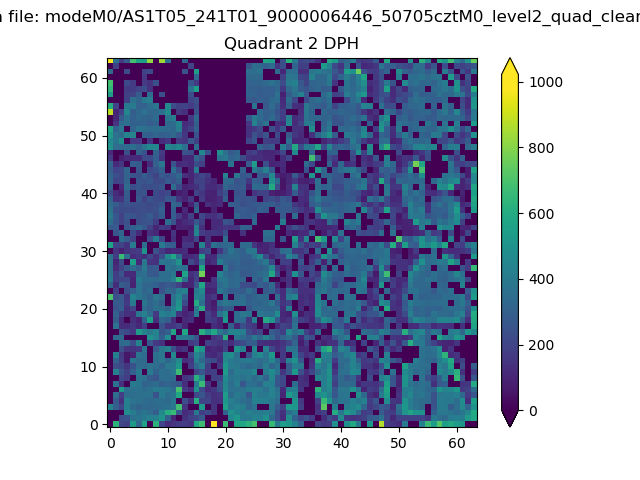 |
Quadrant C |
| Plot type | Count rate plots | Images |
|---|---|---|
| Comparison with Poisson distribution Blue bars denote a histogram of data divided into 1 sec bins. Red curve is a Poisson curve with rate = median count rate of data. |
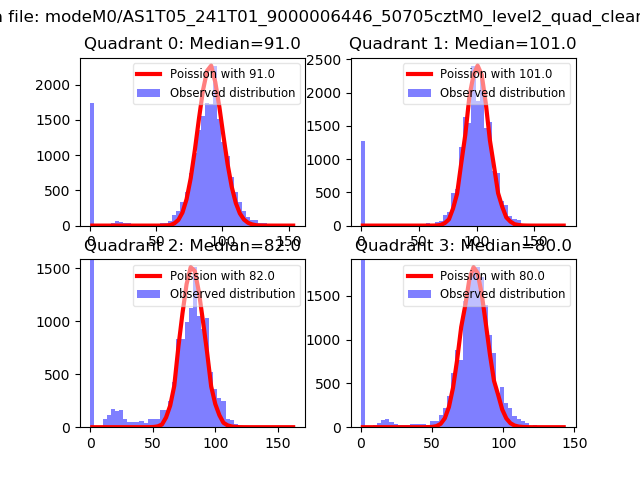 |
 |
| Quadrant-wise count rates Data is divided into 100 sec bins |
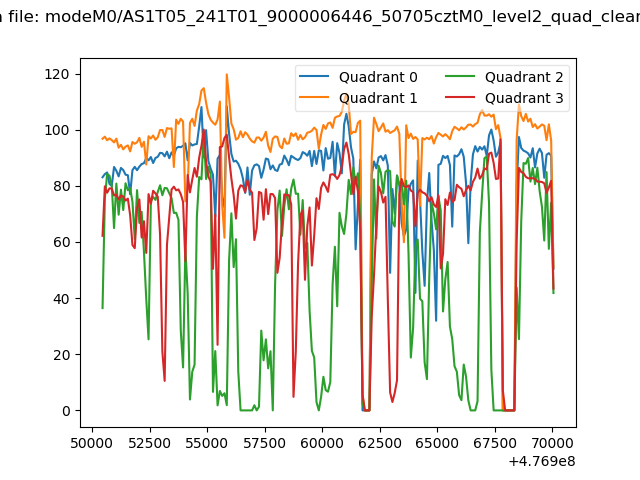 |
|
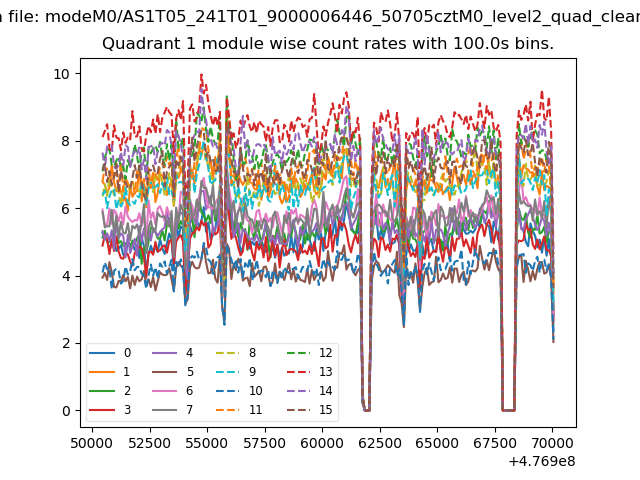
| Module-wise count rates for Quadrant A Data is divided into 100 sec bins |
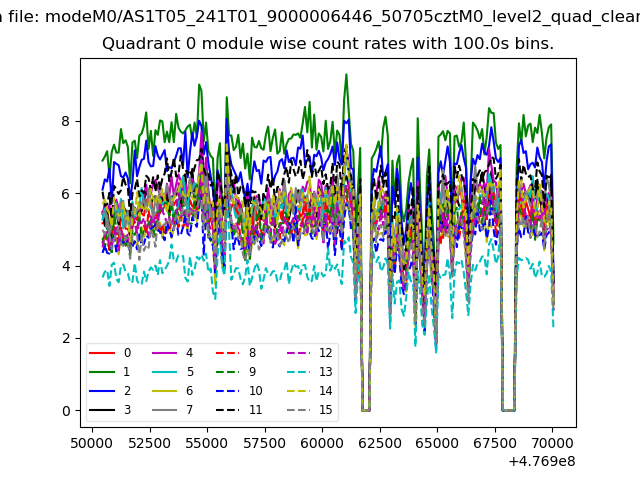 |
 |
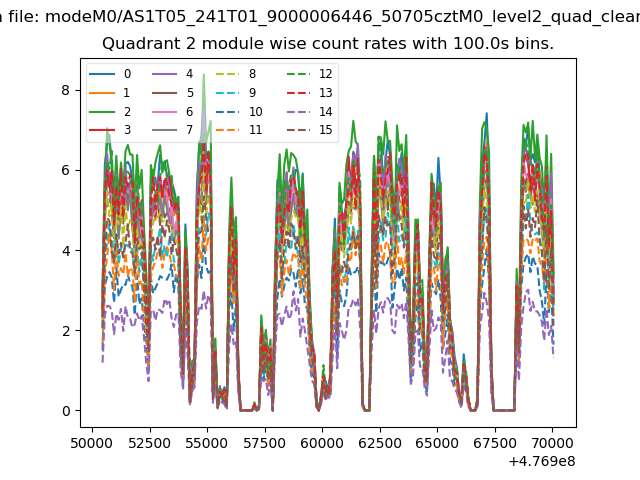
| Module-wise count rates for Quadrant B Data is divided into 100 sec bins |
 |
 |
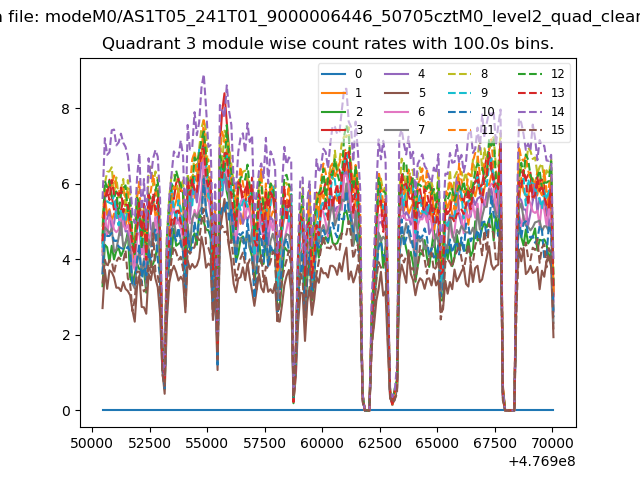
| Module-wise count rates for Quadrant C Data is divided into 100 sec bins |
 |
 |
| Module-wise count rates for Quadrant D Data is divided into 100 sec bins |
 |
 |
| Parameter | Plot |
|---|---|
| CZT HV Monitor | 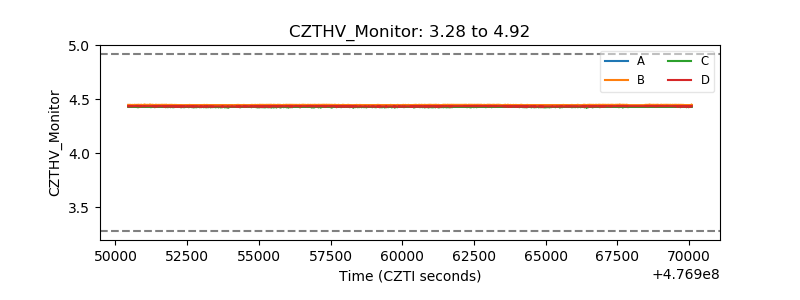 |
| D_VDD | 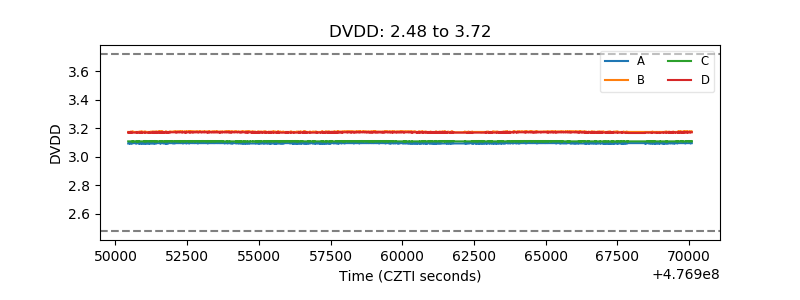 |
| Temperature 1 | 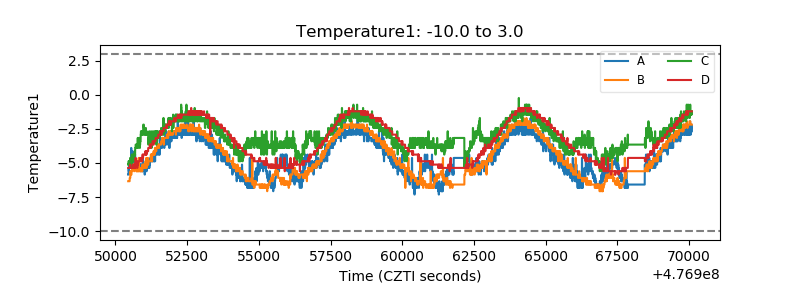 |
| Veto HV Monitor | 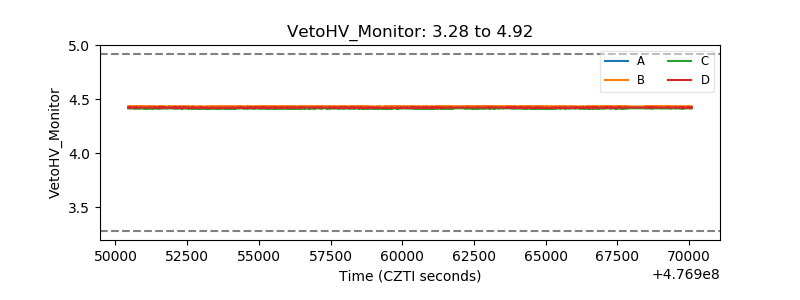 |
| Veto LLD | 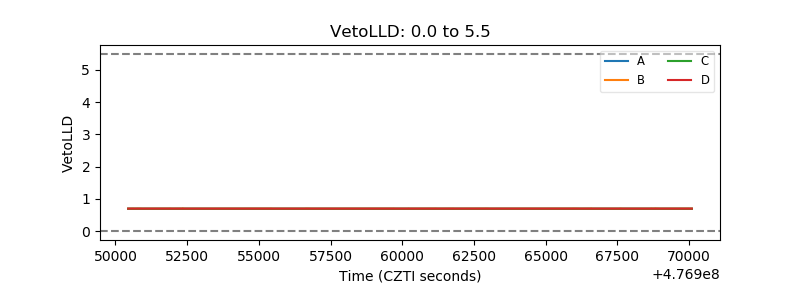 |
| Alpha Counter | 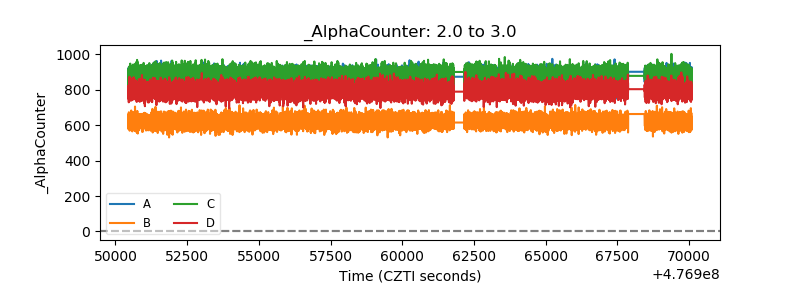 |
| _CPM_Rate | 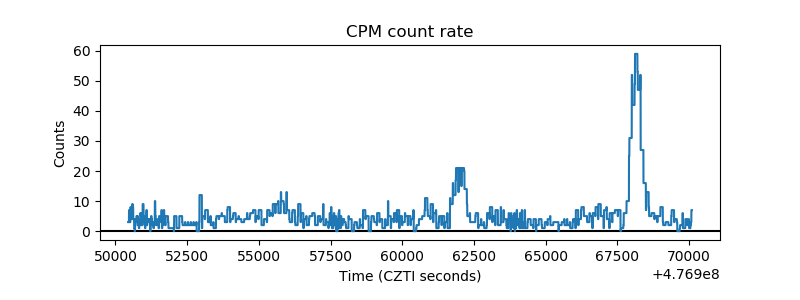 |
| CZT Counter | 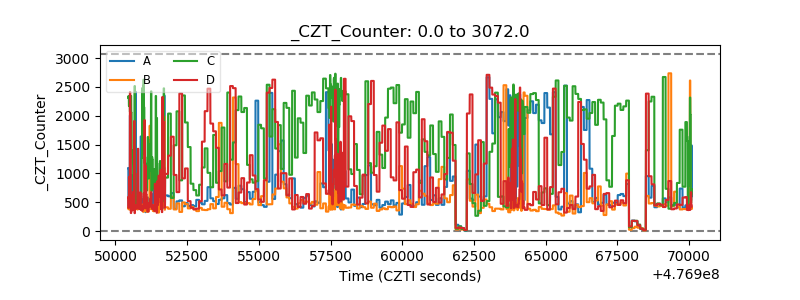 |
| +2.5 Volts monitor | 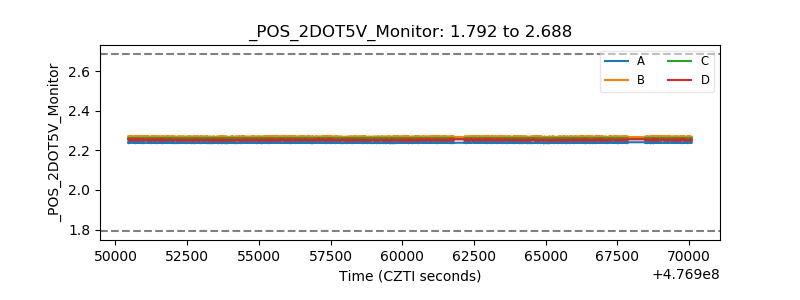 |
| +5 Volts monitor | 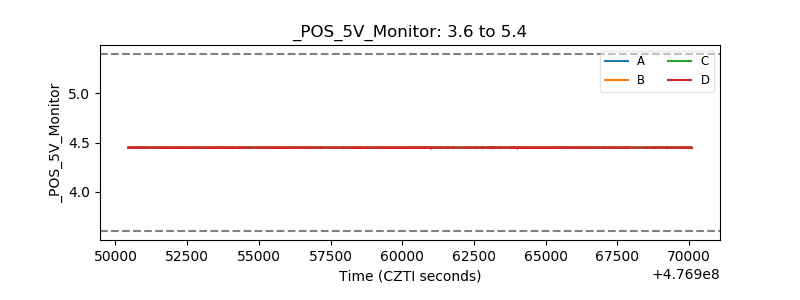 |
| _ROLL_ROT | 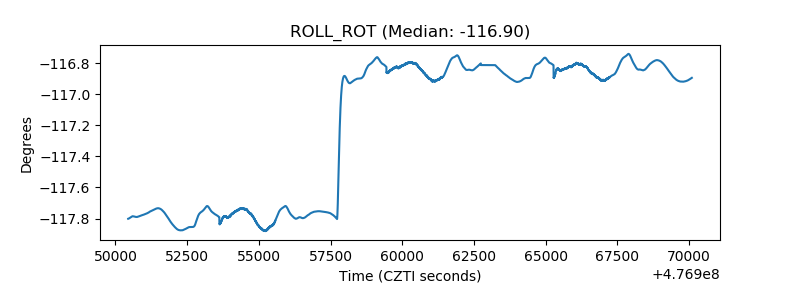 |
| _Roll_DEC | 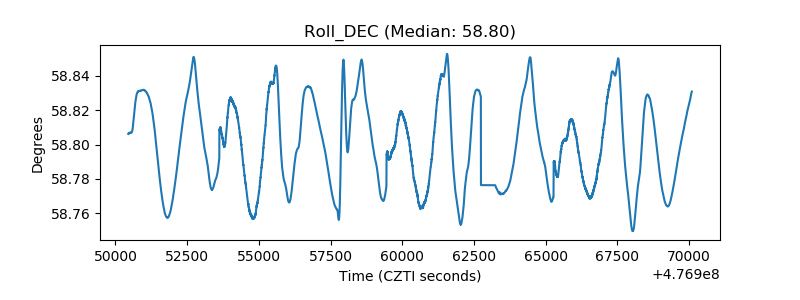 |
| _Roll_RA | 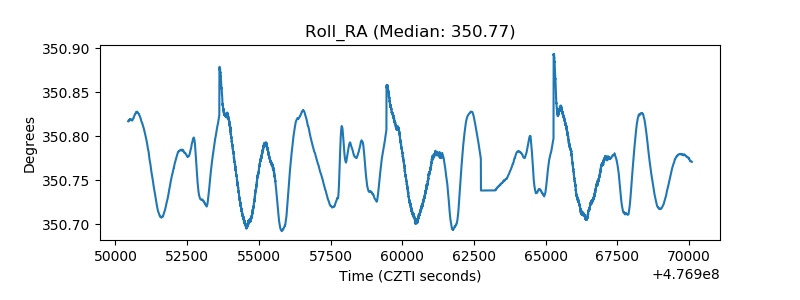 |
| Veto Counter | 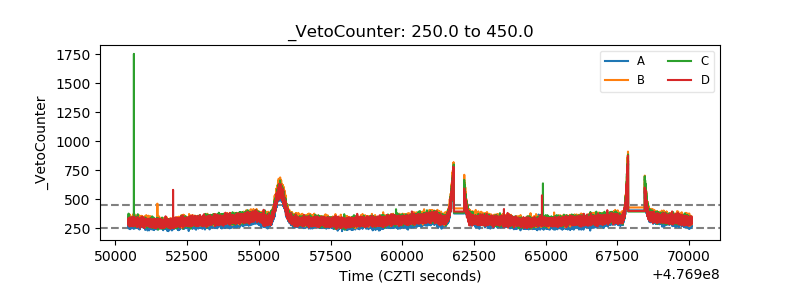 |