| Param | Original file | Final file |
|---|---|---|
| Filename | modeM0/AS1T05_241T01_9000006446_50706cztM0_level2.fits | modeM0/AS1T05_241T01_9000006446_50706cztM0_level2_quad_clean.evt |
| Size (bytes) | 122,935,680 | 23,552,640 |
| Size | 117.2 MB | 22.5 MB |
| Events in quadrant A | 907,612 | 153,563 |
| Events in quadrant B | 878,134 | 168,130 |
| Events in quadrant C | 1,801,419 | 128,750 |
| Events in quadrant D | 831,556 | 140,523 |
| Mode M0 | |||
|---|---|---|---|
| Quadrant | BADHDUFLAG | Total packets | Discarded packets |
| A | 0 | 3773 | 0 |
| B | 0 | 3802 | 0 |
| C | 0 | 6482 | 0 |
| D | 0 | 3691 | 0 |
| Mode SS | |||
|---|---|---|---|
| Quadrant | BADHDUFLAG | Total packets | Discarded packets |
| A | 0 | 34 | 0 |
| B | 0 | 34 | 0 |
| C | 0 | 34 | 0 |
| D | 0 | 34 | 0 |
| Quadrant | Total seconds | Saturated seconds | Saturation percentage |
|---|---|---|---|
| A | 1661 | 29 | 1.745936% |
| B | 1661 | 30 | 1.806141% |
| C | 1661 | 331 | 19.927754% |
| D | 1661 | 12 | 0.722456% |
Noise dominated data is calculated using 1-second bins in cleaned event files. If a bin has >2000 counts, and if more than 50% of those come from <1% of pixels, then it is considered to be noise-dominated and hence unusable.
| Quadrant | # 1 sec bins | Bins with >0 counts | Bins with >2000 counts | High rate bins dominated by noise | Noise dominated (total time) | Noise dominated (detector-on time) | Marked lightcurve |
|---|---|---|---|---|---|---|---|
| A | 1661 | 1661 | 15 | 15 | 0.90% | 0.90% |  |
| B | 1661 | 1661 | 23 | 23 | 1.38% | 1.38% |  |
| C | 1661 | 1660 | 225 | 225 | 13.55% | 13.55% |  |
| D | 1661 | 1661 | 9 | 9 | 0.54% | 0.54% |  |
Top three noisy pixels from each quadrant. If the there are fewer than three noisy pixels in the level2.evt file, extra rows are filled as -1
| Pixel properties | Quadrant properties | ||||||
|---|---|---|---|---|---|---|---|
| Quadrant | DetID | PixID | Counts | Sigma | Mean | Median | Sigma |
| A | 4 | 3 | 40469 | 919.28 | 173 | 168 | 43.8 |
| A | 9 | 191 | 27164 | 615.79 | 173 | 168 | 43.8 |
| A | 3 | 130 | 25603 | 580.18 | 173 | 168 | 43.8 |
| B | 2 | 249 | 61248 | 1602.38 | 170 | 165 | 38.1 |
| B | 0 | 213 | 55627 | 1454.93 | 170 | 165 | 38.1 |
| B | 8 | 128 | 34017 | 888.04 | 170 | 165 | 38.1 |
| C | 15 | 212 | 342989 | 8012.33 | 151 | 150 | 42.8 |
| C | 5 | 10 | 324441 | 7578.85 | 151 | 150 | 42.8 |
| C | 0 | 193 | 162923 | 3804.09 | 151 | 150 | 42.8 |
| D | 2 | 249 | 32703 | 691.45 | 166 | 160 | 47.1 |
| D | 8 | 176 | 30378 | 642.05 | 166 | 160 | 47.1 |
| D | 2 | 120 | 30242 | 639.16 | 166 | 160 | 47.1 |
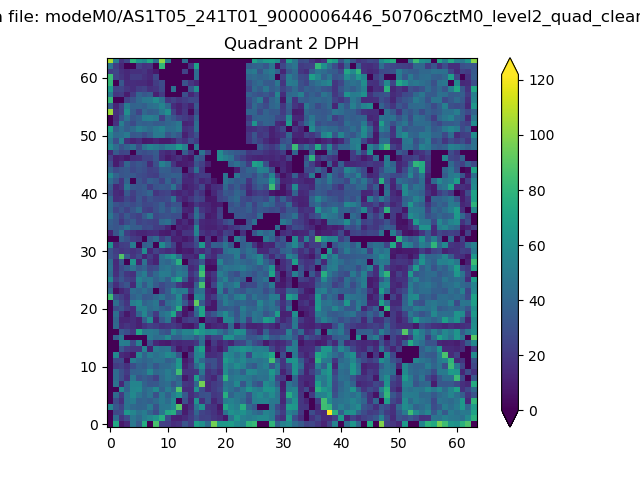
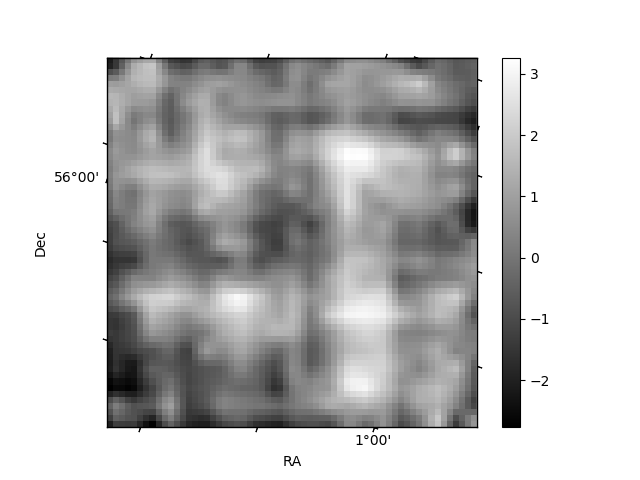
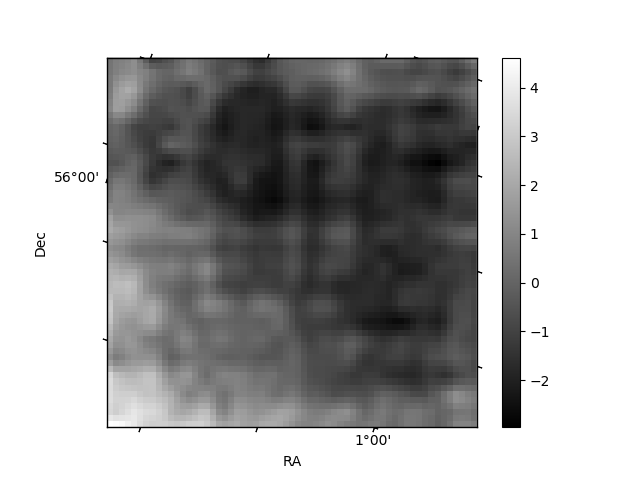
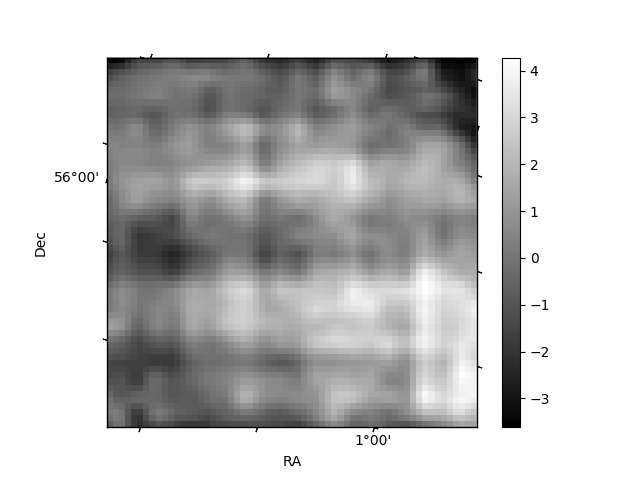
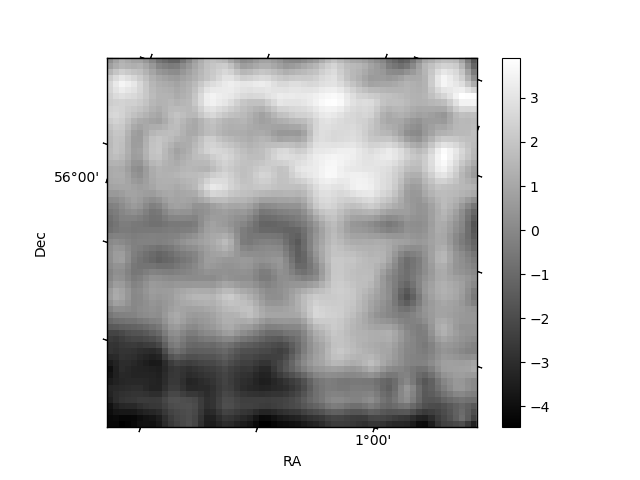
Histogram calculated using DETX and DETY for each event in the final _common_clean file
| Quadrant A | 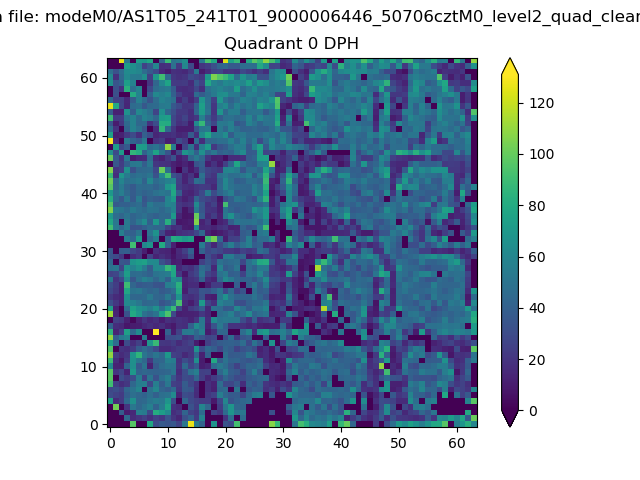 |
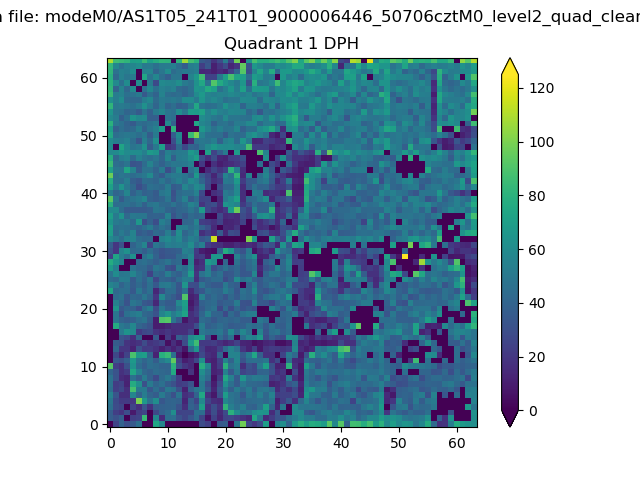 |
Quadrant B |
|---|---|---|---|
| Quadrant D | 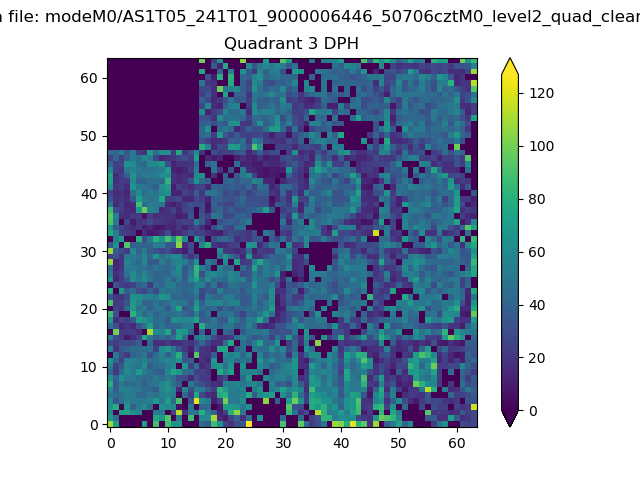 |
 |
Quadrant C |
| Plot type | Count rate plots | Images |
|---|---|---|
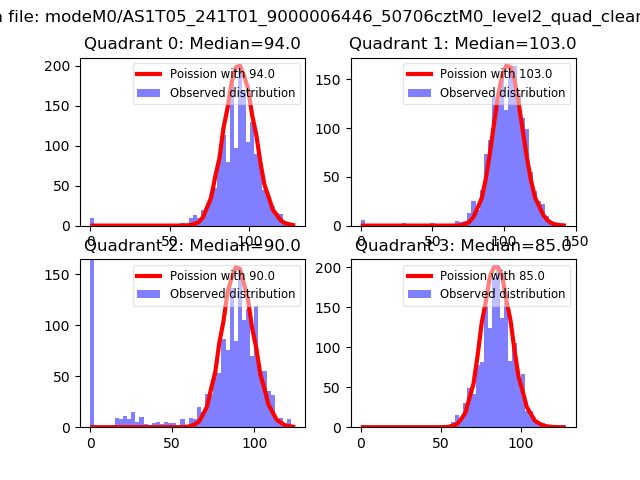
| Comparison with Poisson distribution Blue bars denote a histogram of data divided into 1 sec bins. Red curve is a Poisson curve with rate = median count rate of data. |
 |
 |
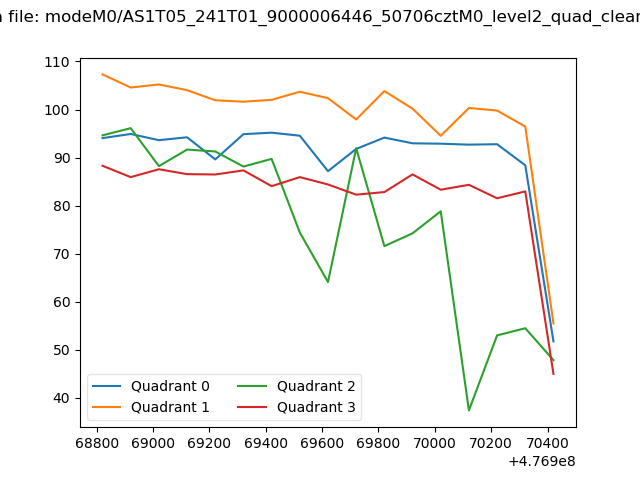
| Quadrant-wise count rates Data is divided into 100 sec bins |
 |
|
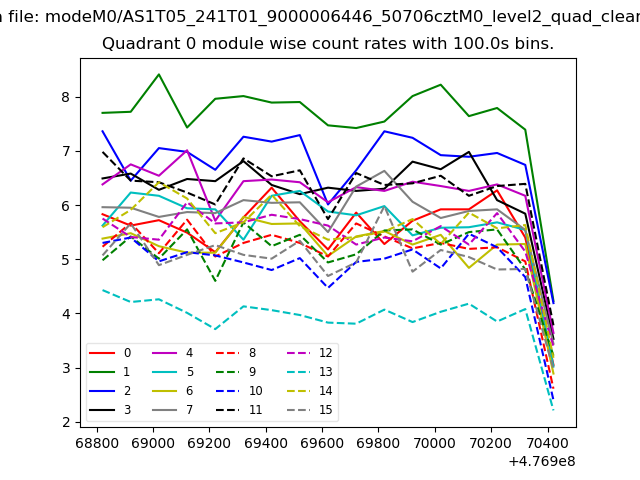
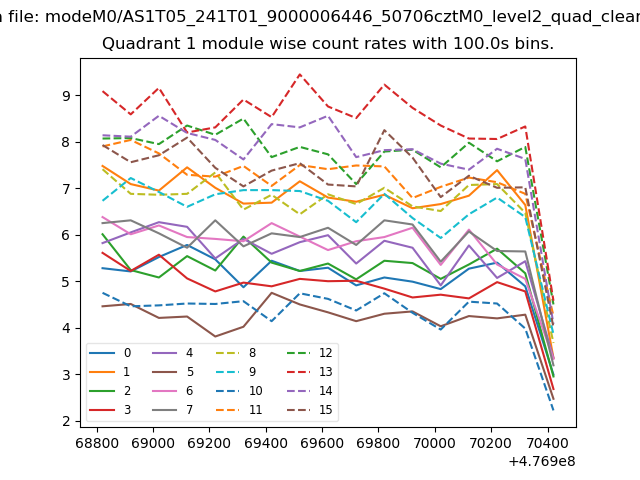
| Module-wise count rates for Quadrant A Data is divided into 100 sec bins |
 |
 |
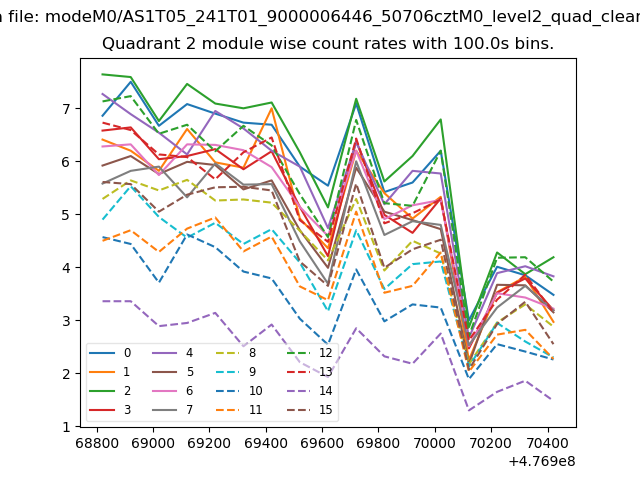
| Module-wise count rates for Quadrant B Data is divided into 100 sec bins |
 |
 |
| Module-wise count rates for Quadrant C Data is divided into 100 sec bins |
 |
 |
| Module-wise count rates for Quadrant D Data is divided into 100 sec bins |
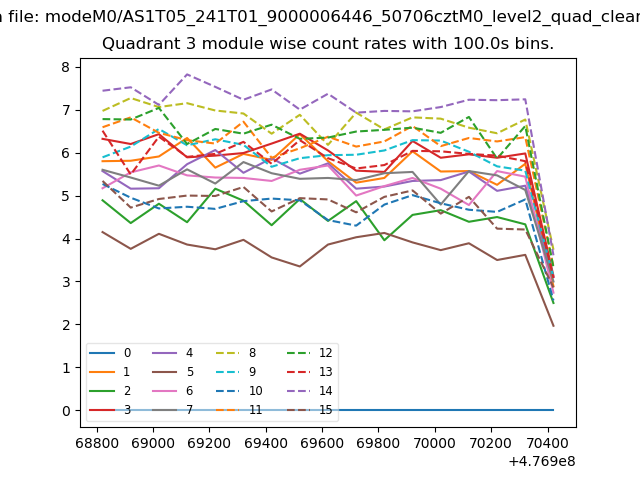 |
 |
| Parameter | Plot |
|---|---|
| CZT HV Monitor | 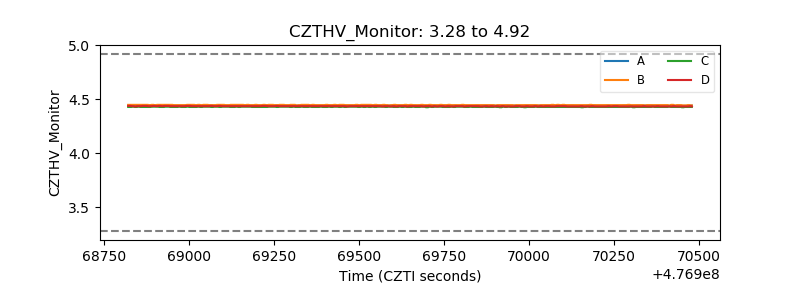 |
| D_VDD | 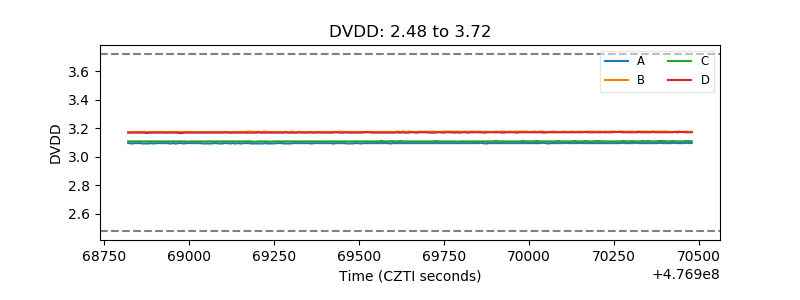 |
| Temperature 1 |  |
| Veto HV Monitor | 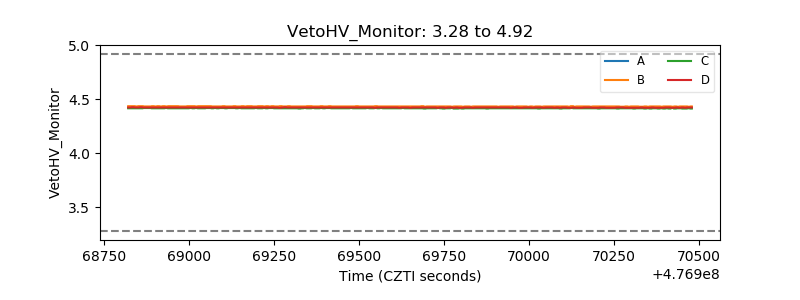 |
| Veto LLD | 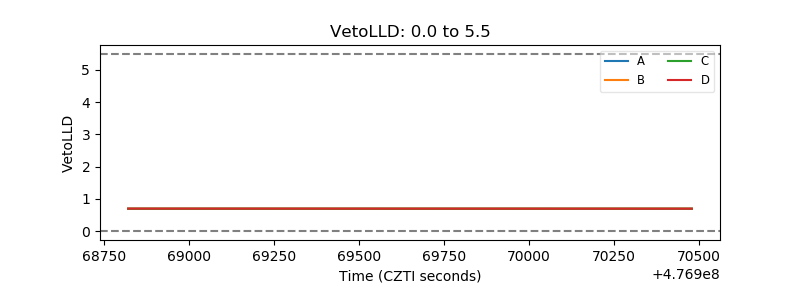 |
| Alpha Counter | 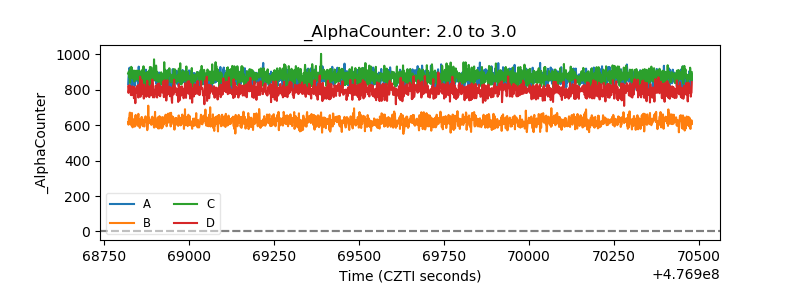 |
| _CPM_Rate | 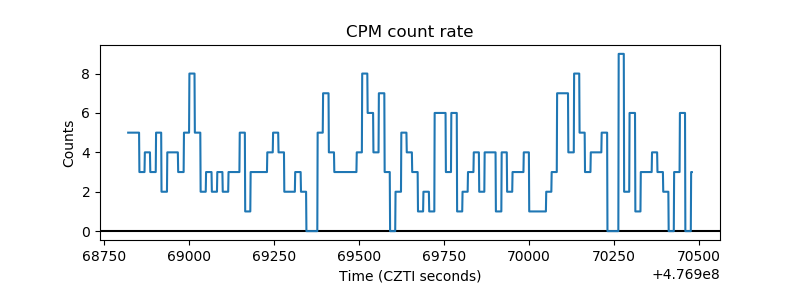 |
| CZT Counter | 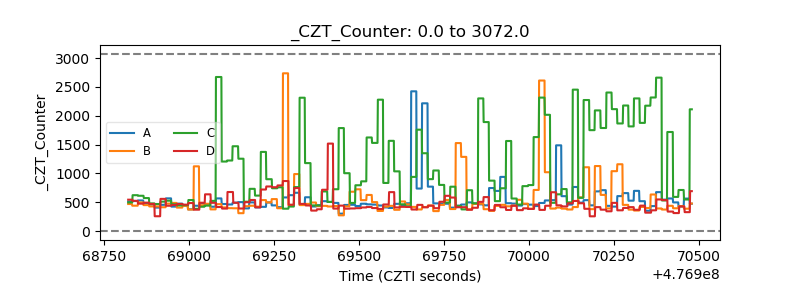 |
| +2.5 Volts monitor | 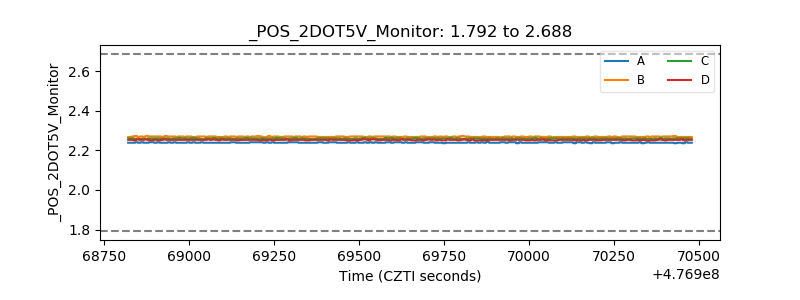 |
| +5 Volts monitor | 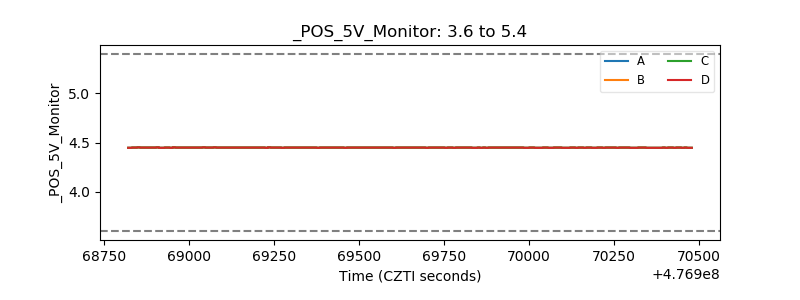 |
| _ROLL_ROT | 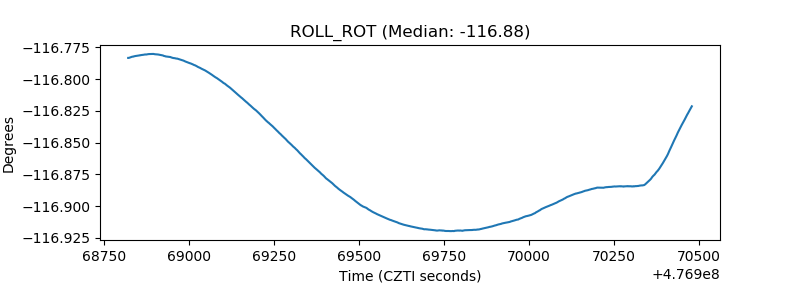 |
| _Roll_DEC | 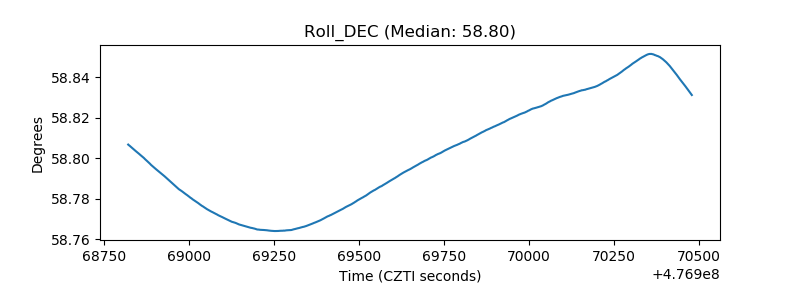 |
| _Roll_RA | 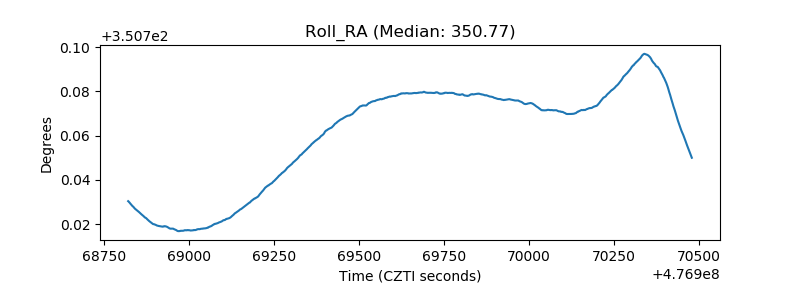 |
| Veto Counter | 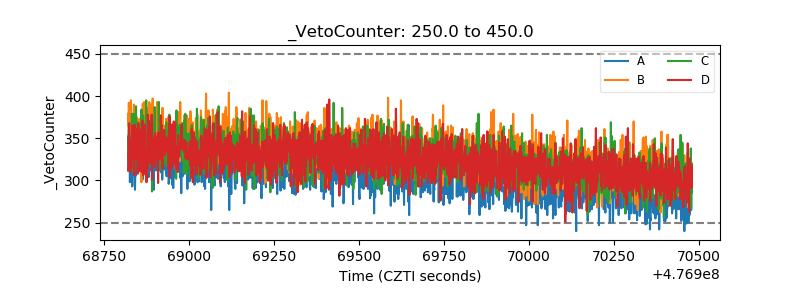 |