| Param | Original file | Final file |
|---|---|---|
| Filename | modeM0/AS1C09_003T01_9000006448cztM0_level2.fits | modeM0/AS1C09_003T01_9000006448cztM0_level2_quad_clean.evt |
| Size (bytes) | 401,866,560 | 574,315,200 |
| Size | 383.2 MB | 547.7 MB |
| Events in quadrant A | 2,423,550 | 3,815,907 |
| Events in quadrant B | 2,360,486 | 4,172,372 |
| Events in quadrant C | 2,129,670 | 3,129,507 |
| Events in quadrant D | 1,830,932 | 2,860,260 |
| Mode SS | |||
|---|---|---|---|
| Quadrant | BADHDUFLAG | Total packets | Discarded packets |
| A | 0 | 1012 | 0 |
| B | 0 | 1012 | 0 |
| C | 0 | 1014 | 0 |
| D | 0 | 1014 | 0 |
| Mode M9 | |||
|---|---|---|---|
| Quadrant | BADHDUFLAG | Total packets | Discarded packets |
| A | 0 | 68 | 0 |
| B | 0 | 68 | 0 |
| C | 0 | 68 | 0 |
| D | 0 | 68 | 0 |
| Mode M0 | |||
|---|---|---|---|
| Quadrant | BADHDUFLAG | Total packets | Discarded packets |
| A | 0 | 121917 | 0 |
| B | 0 | 119571 | 0 |
| C | 0 | 197094 | 0 |
| D | 0 | 203702 | 0 |
| Quadrant | Total seconds | Saturated seconds | Saturation percentage |
|---|---|---|---|
| A | 49744 | 1440 | 2.894821% |
| B | 49739 | 1310 | 2.633748% |
| C | 49737 | 10263 | 20.634538% |
| D | 49753 | 10605 | 21.315298% |
Noise dominated data is calculated using 1-second bins in cleaned event files. If a bin has >2000 counts, and if more than 50% of those come from <1% of pixels, then it is considered to be noise-dominated and hence unusable.
| Quadrant | # 1 sec bins | Bins with >0 counts | Bins with >2000 counts | High rate bins dominated by noise | Noise dominated (total time) | Noise dominated (detector-on time) | Marked lightcurve |
|---|---|---|---|---|---|---|---|
| A | 56867 | 49793 | 0 | 0 | 0.00% | 0.00% | 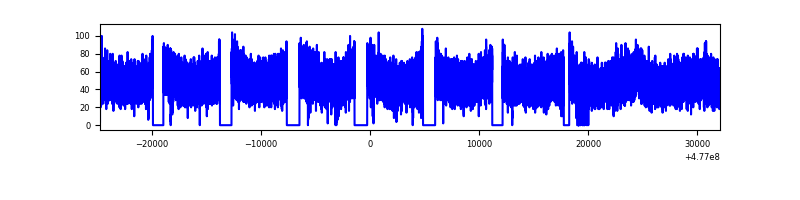 |
| B | 56868 | 49777 | 0 | 0 | 0.00% | 0.00% | 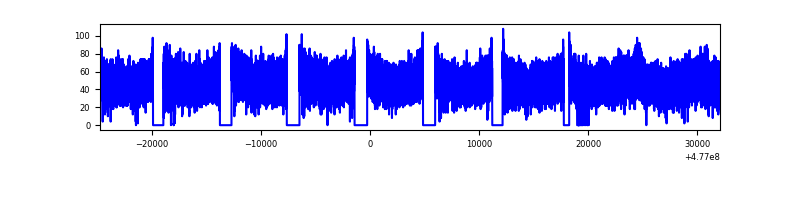 |
| C | 56866 | 49444 | 0 | 0 | 0.00% | 0.00% | 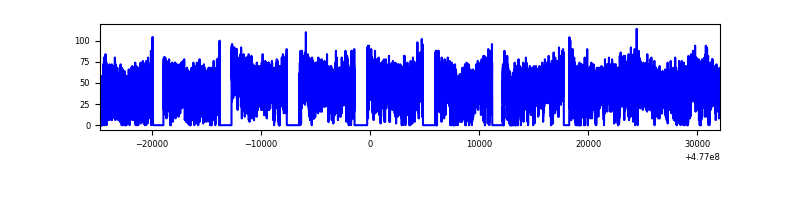 |
| D | 56868 | 49376 | 0 | 0 | 0.00% | 0.00% | 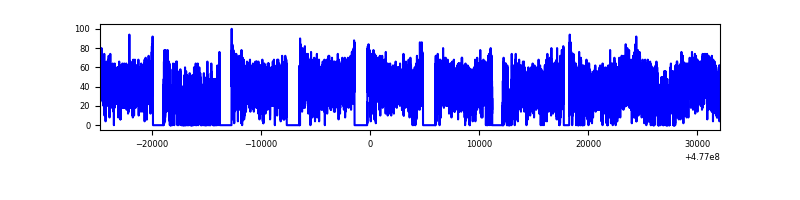 |
Top three noisy pixels from each quadrant. If the there are fewer than three noisy pixels in the level2.evt file, extra rows are filled as -1
| Pixel properties | Quadrant properties | ||||||
|---|---|---|---|---|---|---|---|
| Quadrant | DetID | PixID | Counts | Sigma | Mean | Median | Sigma |
| A | 9 | 255 | 2565 | 9.42 | 641 | 594 | 209.2 |
| A | 14 | 188 | 2559 | 9.39 | 641 | 594 | 209.2 |
| A | 14 | 204 | 2160 | 7.49 | 641 | 594 | 209.2 |
| B | 2 | 9 | 2637 | 13.84 | 625 | 594 | 147.6 |
| B | 2 | 8 | 2405 | 12.27 | 625 | 594 | 147.6 |
| B | 9 | 173 | 1880 | 8.71 | 625 | 594 | 147.6 |
| C | 15 | 127 | 1727 | 6.02 | 574 | 522 | 200.2 |
| C | 7 | 221 | 1706 | 5.92 | 574 | 522 | 200.2 |
| C | 15 | 177 | 1642 | 5.6 | 574 | 522 | 200.2 |
| D | 6 | 218 | 2445 | 11.2 | 525 | 469 | 176.5 |
| D | 3 | 30 | 1778 | 7.42 | 525 | 469 | 176.5 |
| D | 14 | 31 | 1616 | 6.5 | 525 | 469 | 176.5 |
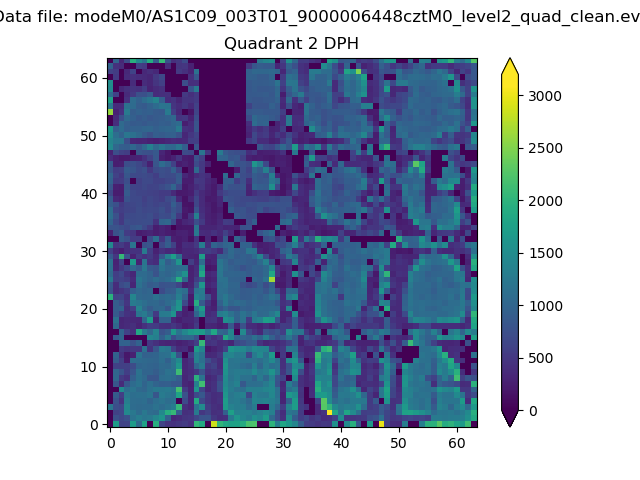
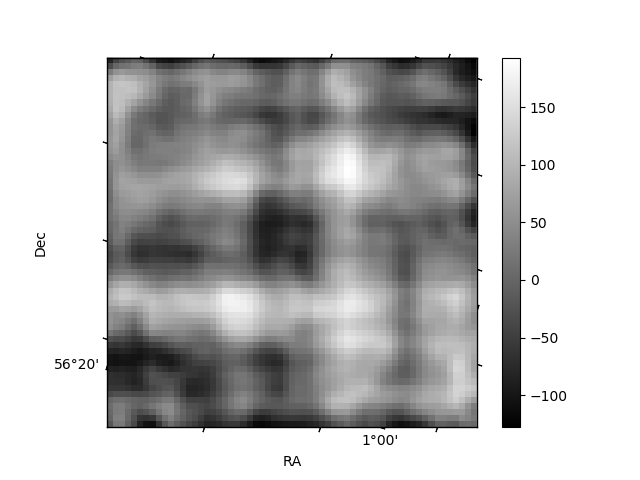
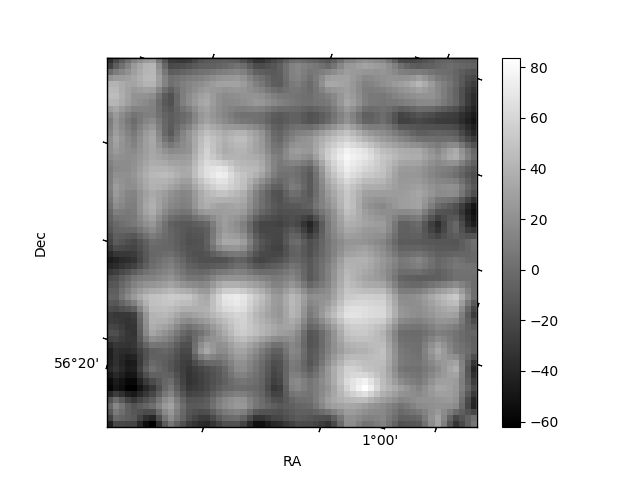
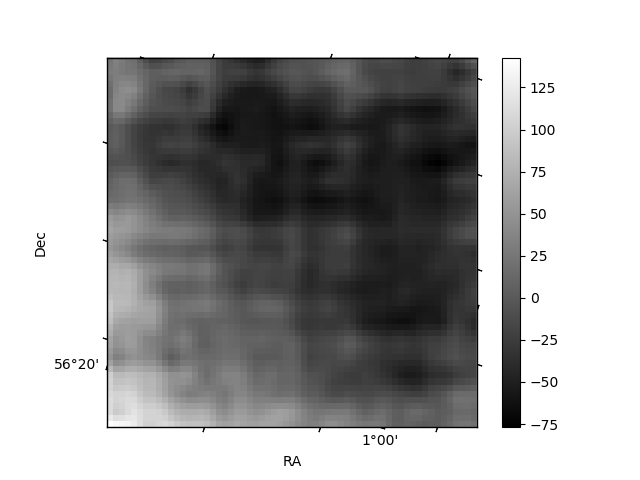
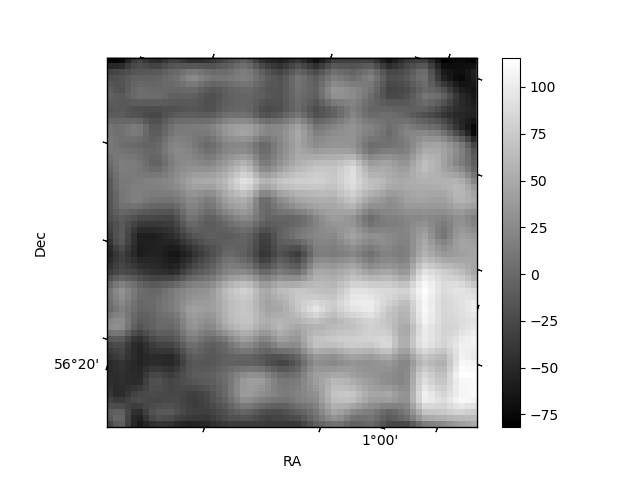
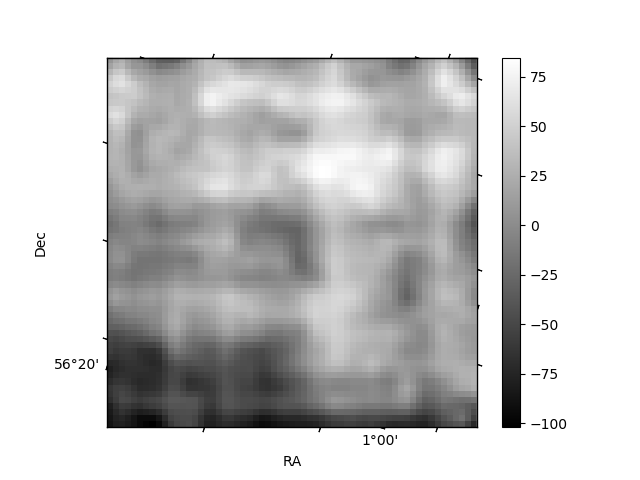
Histogram calculated using DETX and DETY for each event in the final _common_clean file
| Quadrant A | 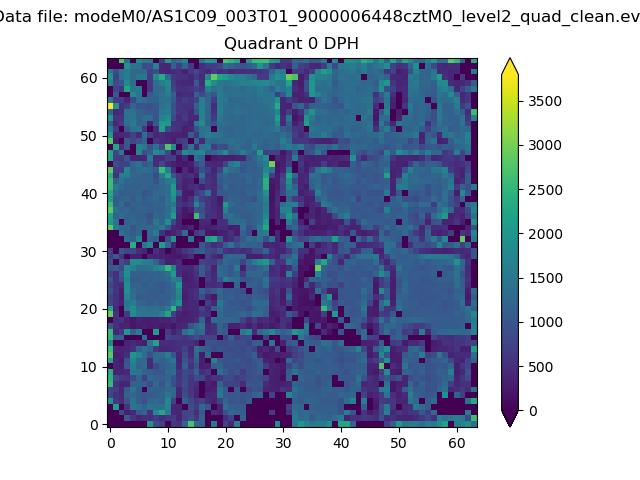 |
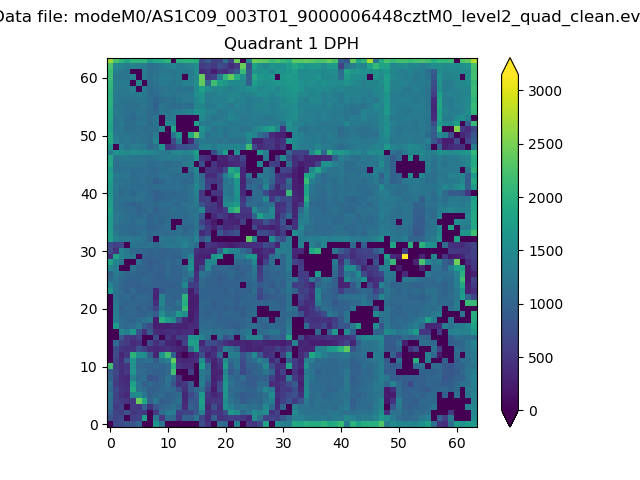 |
Quadrant B |
|---|---|---|---|
| Quadrant D | 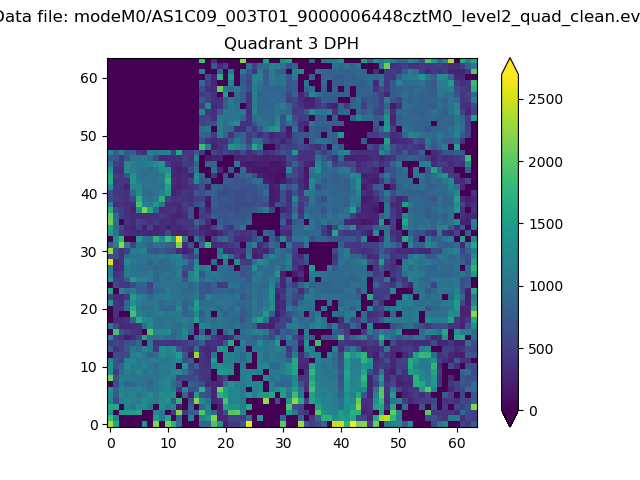 |
 |
Quadrant C |
| Plot type | Count rate plots | Images |
|---|---|---|
| Comparison with Poisson distribution Blue bars denote a histogram of data divided into 1 sec bins. Red curve is a Poisson curve with rate = median count rate of data. |
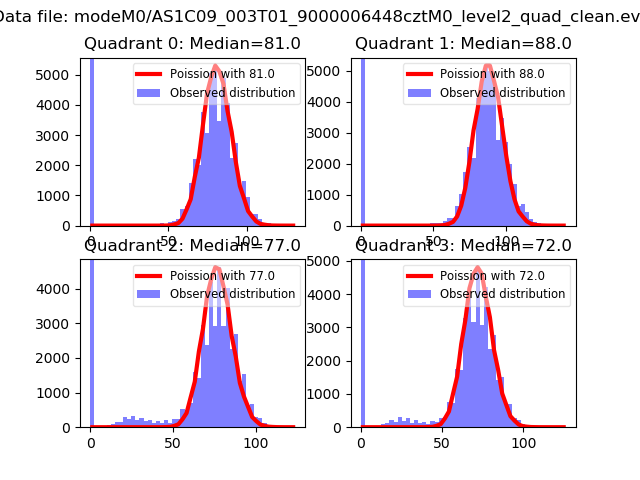 |
 |
| Quadrant-wise count rates Data is divided into 100 sec bins |
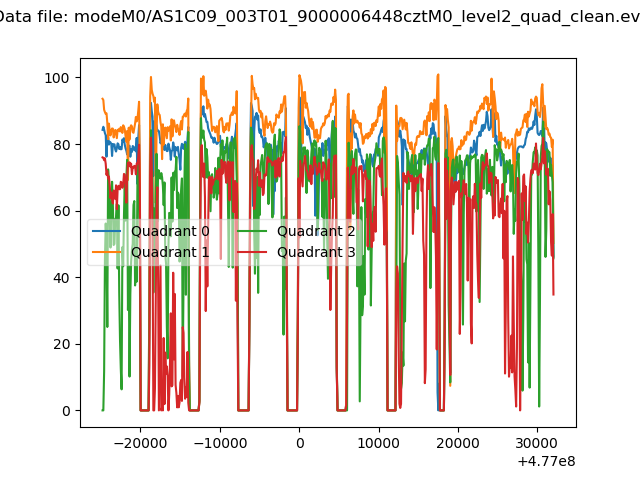 |
|
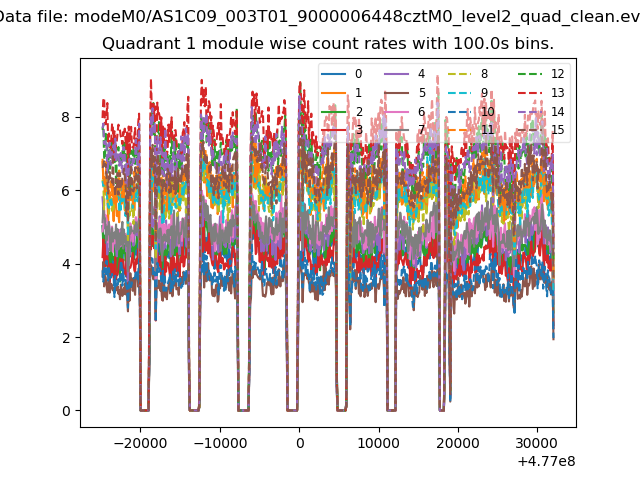
| Module-wise count rates for Quadrant A Data is divided into 100 sec bins |
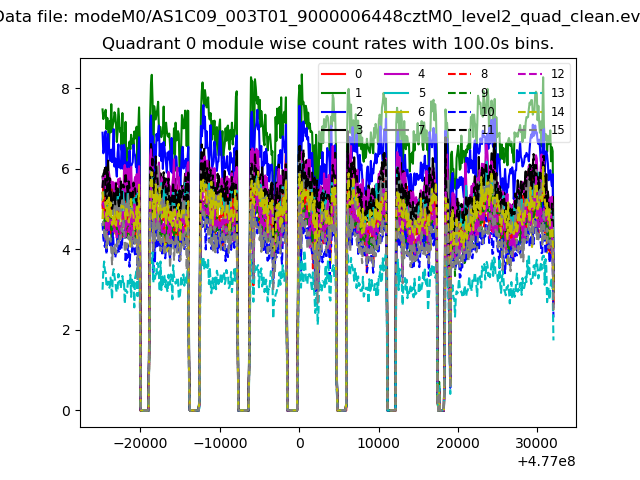 |
 |
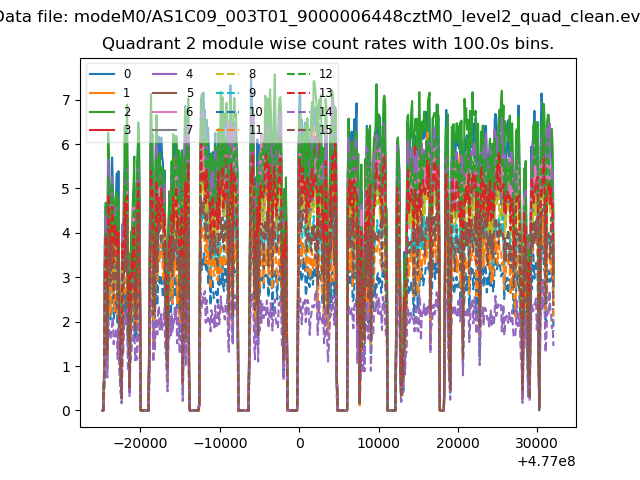
| Module-wise count rates for Quadrant B Data is divided into 100 sec bins |
 |
 |
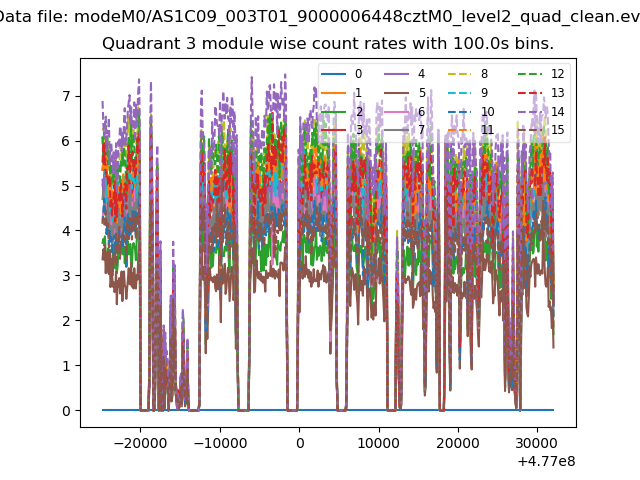
| Module-wise count rates for Quadrant C Data is divided into 100 sec bins |
 |
 |
| Module-wise count rates for Quadrant D Data is divided into 100 sec bins |
 |
 |
| Parameter | Plot |
|---|---|
| CZT HV Monitor | 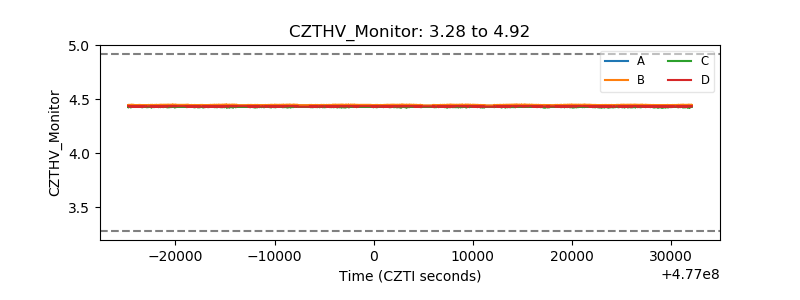 |
| D_VDD | 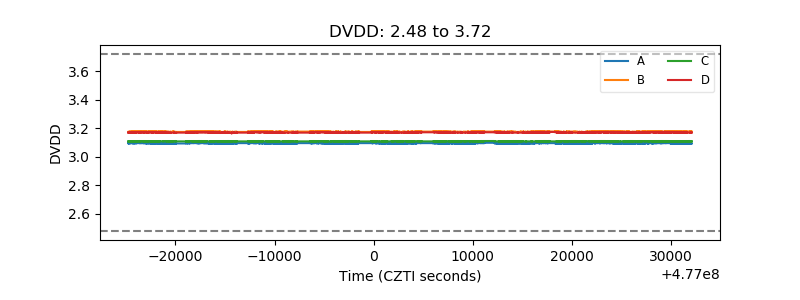 |
| Temperature 1 | 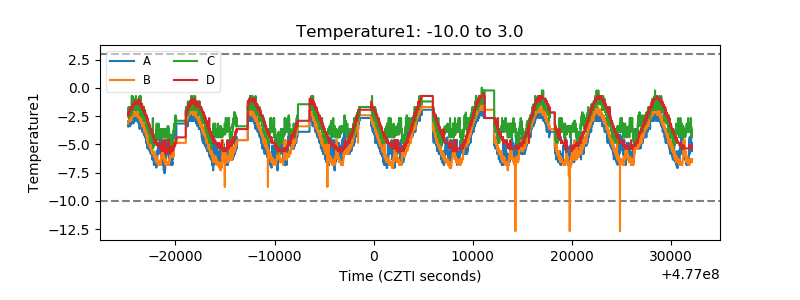 |
| Veto HV Monitor | 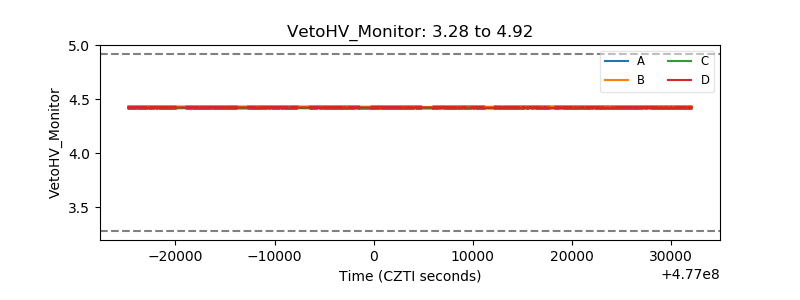 |
| Veto LLD | 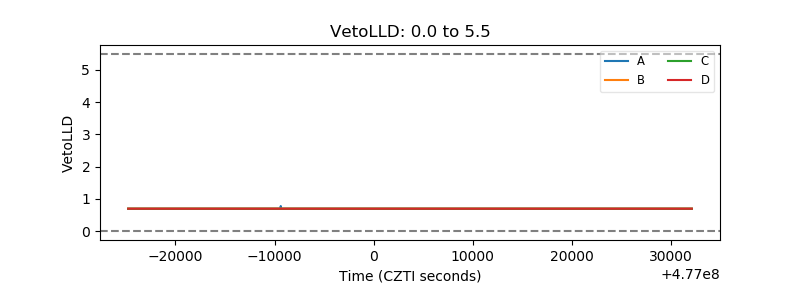 |
| Alpha Counter | 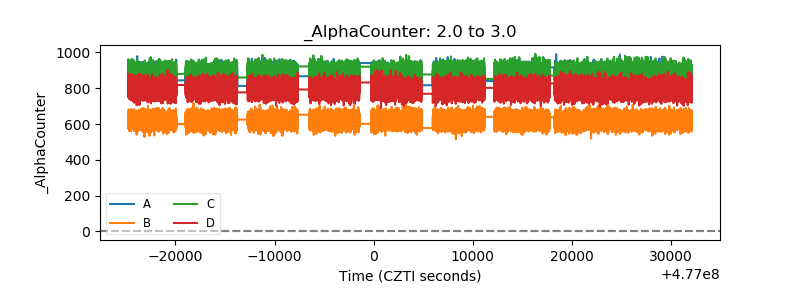 |
| _CPM_Rate | 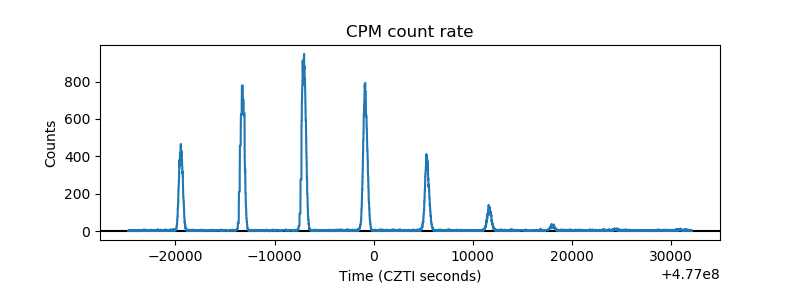 |
| CZT Counter | 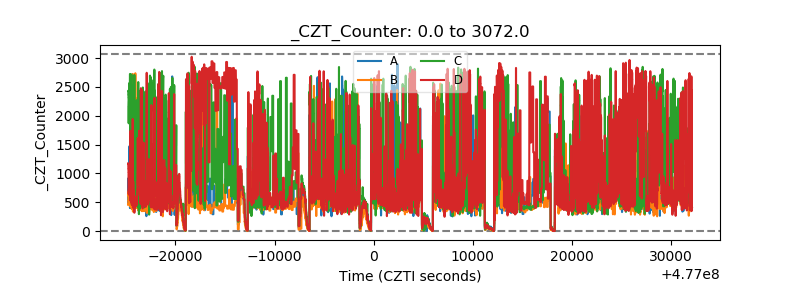 |
| +2.5 Volts monitor | 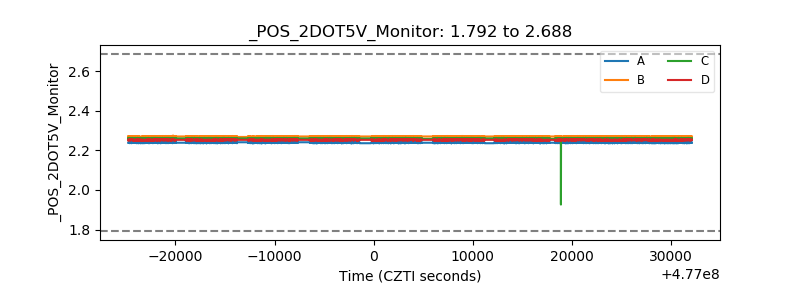 |
| +5 Volts monitor | 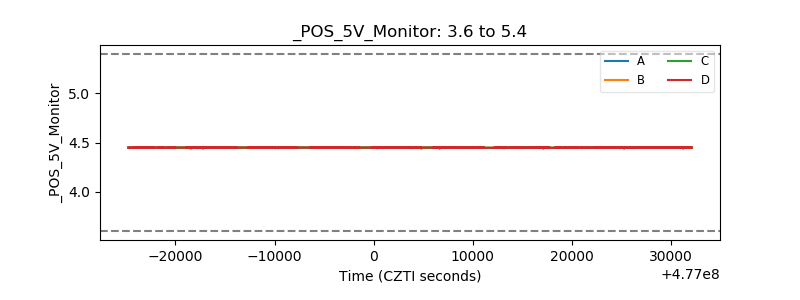 |
| _ROLL_ROT | 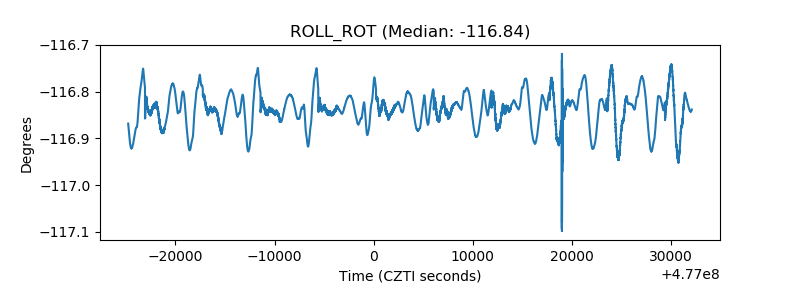 |
| _Roll_DEC | 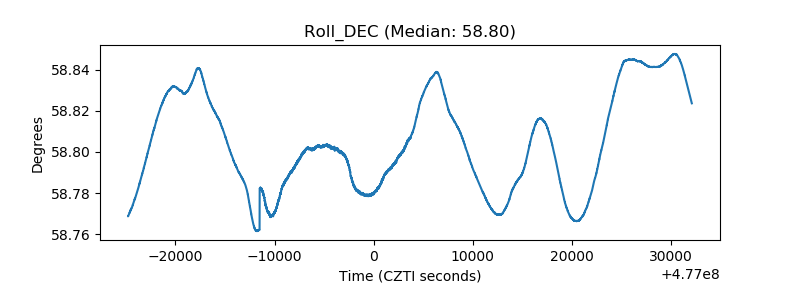 |
| _Roll_RA | 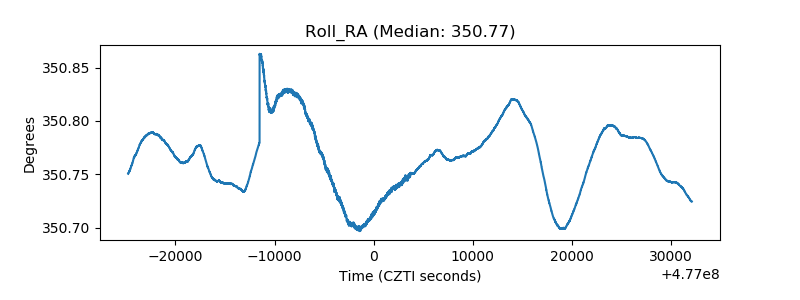 |
| Veto Counter | 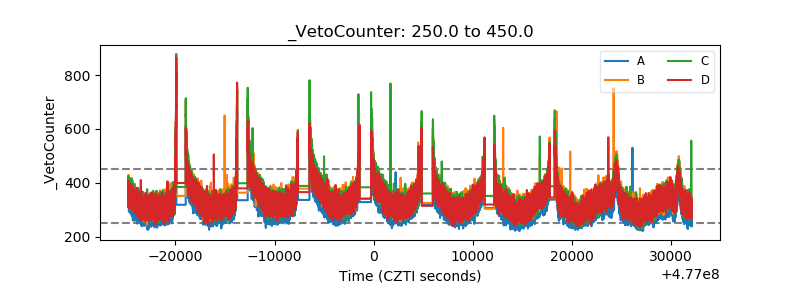 |