| Param | Original file | Final file |
|---|---|---|
| Filename | modeM0/AS1C09_003T01_9000006448_50708cztM0_level2.fits | modeM0/AS1C09_003T01_9000006448_50708cztM0_level2_quad_clean.evt |
| Size (bytes) | 630,106,560 | 83,966,400 |
| Size | 600.9 MB | 80.1 MB |
| Events in quadrant A | 3,440,717 | 594,407 |
| Events in quadrant B | 3,651,882 | 639,828 |
| Events in quadrant C | 9,619,834 | 396,243 |
| Events in quadrant D | 6,124,222 | 472,254 |
| Mode SS | |||
|---|---|---|---|
| Quadrant | BADHDUFLAG | Total packets | Discarded packets |
| A | 0 | 130 | 0 |
| B | 0 | 130 | 0 |
| C | 0 | 130 | 0 |
| D | 0 | 130 | 0 |
| Mode M9 | |||
|---|---|---|---|
| Quadrant | BADHDUFLAG | Total packets | Discarded packets |
| A | 0 | 9 | 0 |
| B | 0 | 9 | 0 |
| C | 0 | 9 | 0 |
| D | 0 | 9 | 0 |
| Mode M0 | |||
|---|---|---|---|
| Quadrant | BADHDUFLAG | Total packets | Discarded packets |
| A | 0 | 14300 | 1 |
| B | 0 | 15288 | 1 |
| C | 0 | 32934 | 1 |
| D | 0 | 22523 | 1 |
| Quadrant | Total seconds | Saturated seconds | Saturation percentage |
|---|---|---|---|
| A | 6287 | 128 | 2.035947% |
| B | 6288 | 202 | 3.212468% |
| C | 6288 | 2388 | 37.977099% |
| D | 6288 | 947 | 15.060433% |
Noise dominated data is calculated using 1-second bins in cleaned event files. If a bin has >2000 counts, and if more than 50% of those come from <1% of pixels, then it is considered to be noise-dominated and hence unusable.
| Quadrant | # 1 sec bins | Bins with >0 counts | Bins with >2000 counts | High rate bins dominated by noise | Noise dominated (total time) | Noise dominated (detector-on time) | Marked lightcurve |
|---|---|---|---|---|---|---|---|
| A | 7242 | 6288 | 69 | 69 | 0.95% | 1.10% | 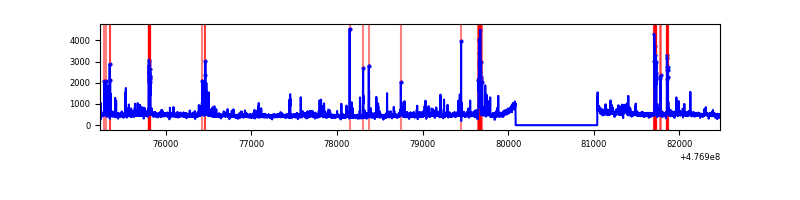 |
| B | 7243 | 6289 | 105 | 105 | 1.45% | 1.67% | 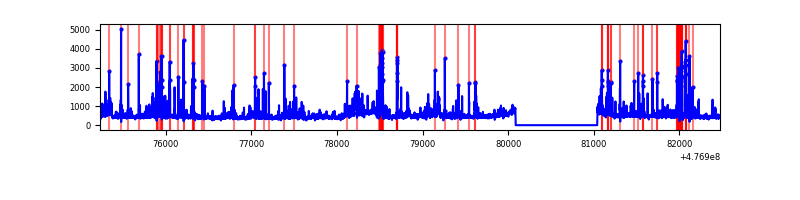 |
| C | 7243 | 6287 | 1864 | 1864 | 25.74% | 29.65% | 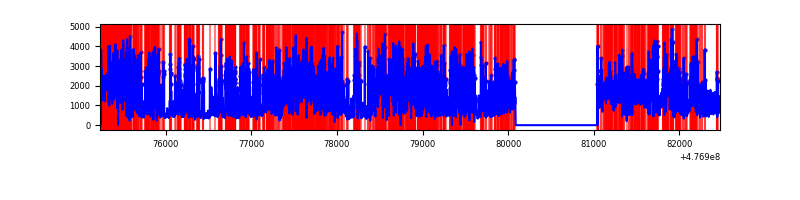 |
| D | 7243 | 6289 | 826 | 826 | 11.40% | 13.13% | 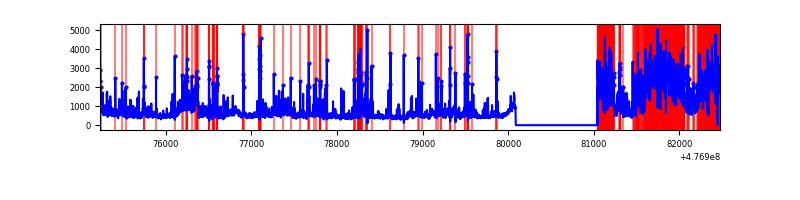 |
Top three noisy pixels from each quadrant. If the there are fewer than three noisy pixels in the level2.evt file, extra rows are filled as -1
| Pixel properties | Quadrant properties | ||||||
|---|---|---|---|---|---|---|---|
| Quadrant | DetID | PixID | Counts | Sigma | Mean | Median | Sigma |
| A | 4 | 3 | 204337 | 1228.59 | 667 | 651 | 165.8 |
| A | 8 | 38 | 126016 | 756.17 | 667 | 651 | 165.8 |
| A | 8 | 249 | 76076 | 454.95 | 667 | 651 | 165.8 |
| B | 5 | 185 | 175697 | 1247.05 | 658 | 635 | 140.4 |
| B | 8 | 128 | 164192 | 1165.1 | 658 | 635 | 140.4 |
| B | 0 | 229 | 123352 | 874.17 | 658 | 635 | 140.4 |
| C | 0 | 193 | 2924361 | 19507.11 | 536 | 531 | 149.9 |
| C | 5 | 10 | 2180039 | 14541.17 | 536 | 531 | 149.9 |
| C | 13 | 3 | 780085 | 5201.0 | 536 | 531 | 149.9 |
| D | 8 | 176 | 2052146 | 12231.11 | 602 | 580 | 167.7 |
| D | 10 | 98 | 700273 | 4171.46 | 602 | 580 | 167.7 |
| D | 2 | 249 | 292454 | 1740.11 | 602 | 580 | 167.7 |
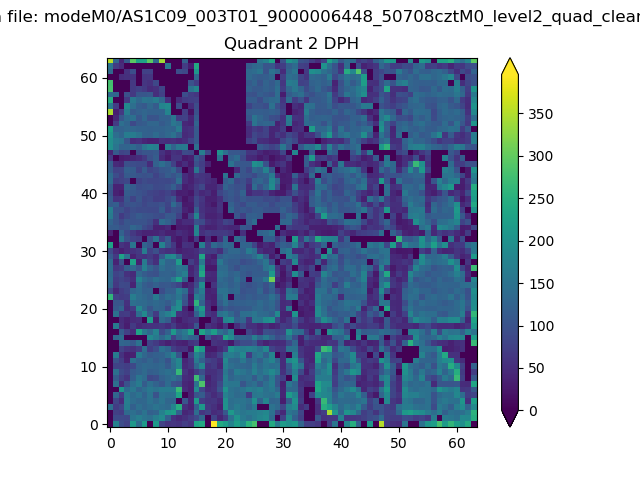
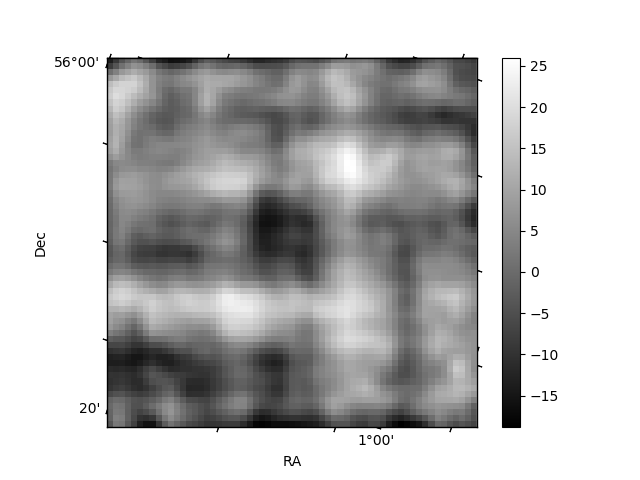
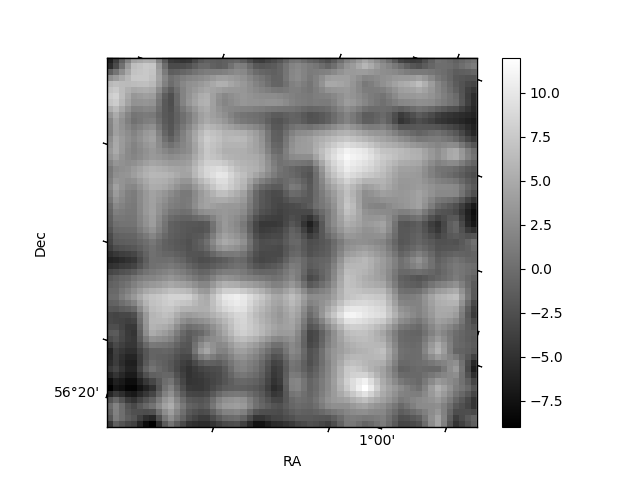
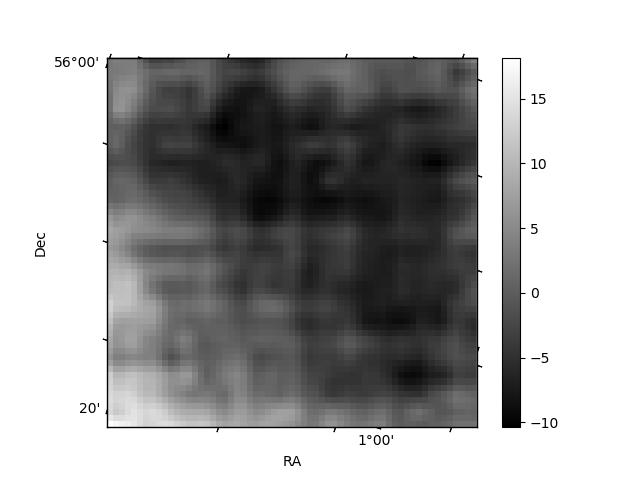
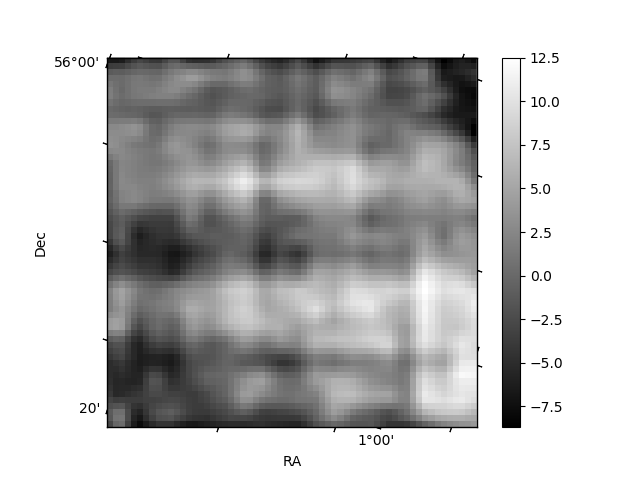
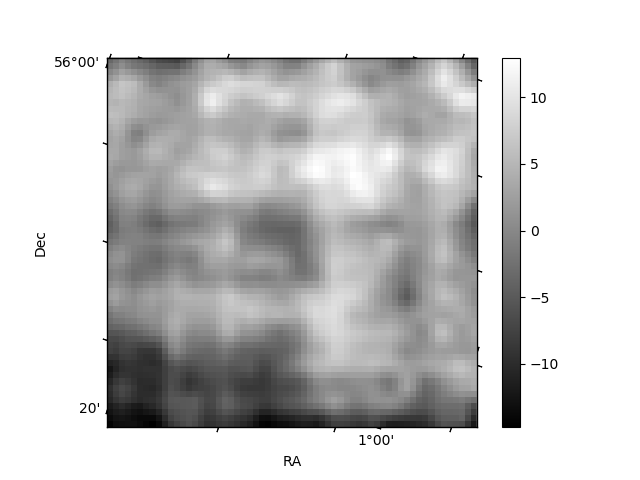
Histogram calculated using DETX and DETY for each event in the final _common_clean file
| Quadrant A | 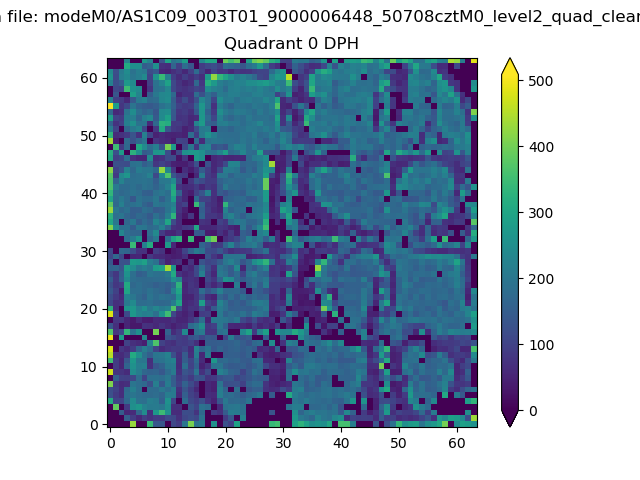 |
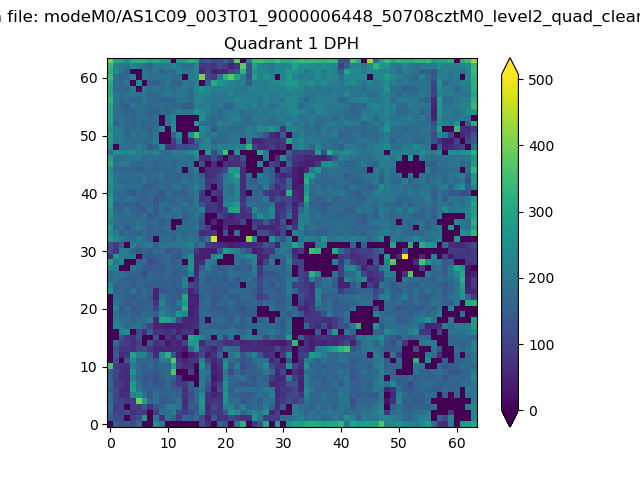 |
Quadrant B |
|---|---|---|---|
| Quadrant D | 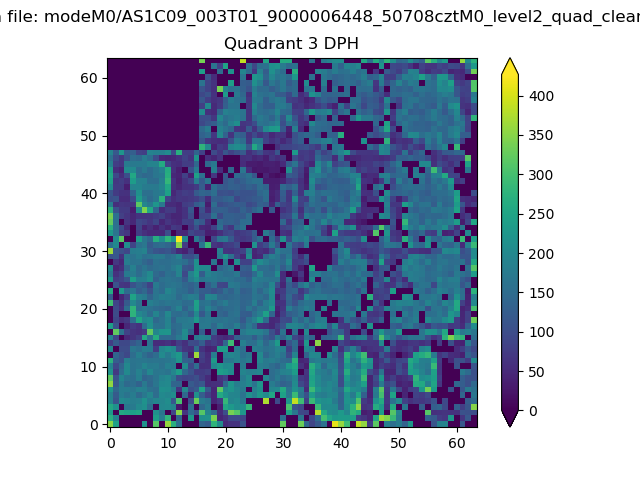 |
 |
Quadrant C |
| Plot type | Count rate plots | Images |
|---|---|---|
| Comparison with Poisson distribution Blue bars denote a histogram of data divided into 1 sec bins. Red curve is a Poisson curve with rate = median count rate of data. |
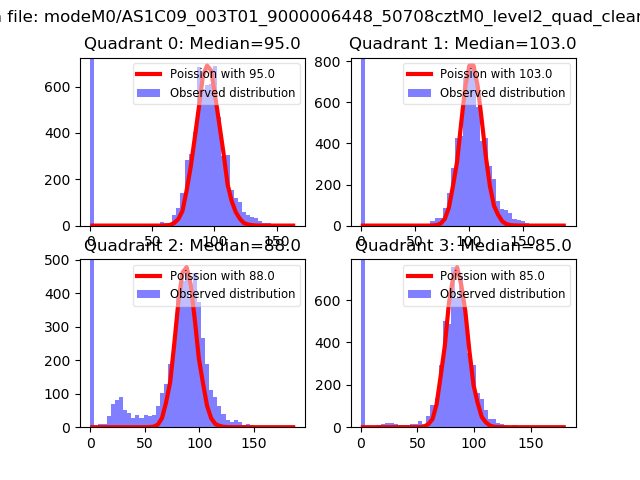 |
 |
| Quadrant-wise count rates Data is divided into 100 sec bins |
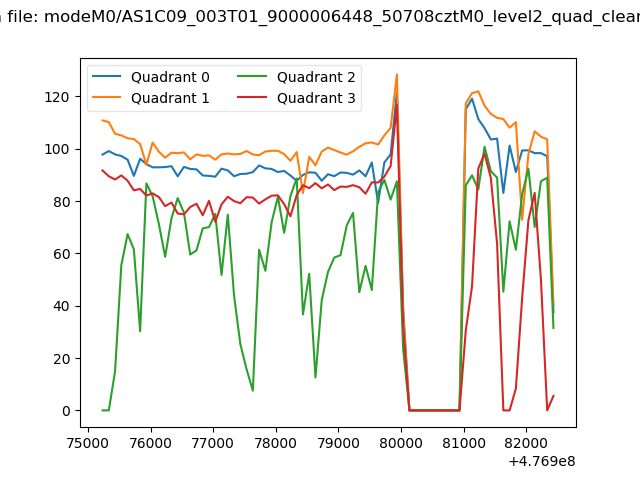 |
|
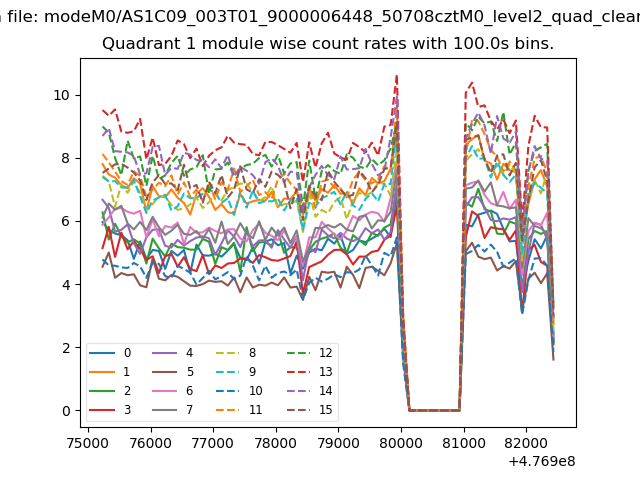
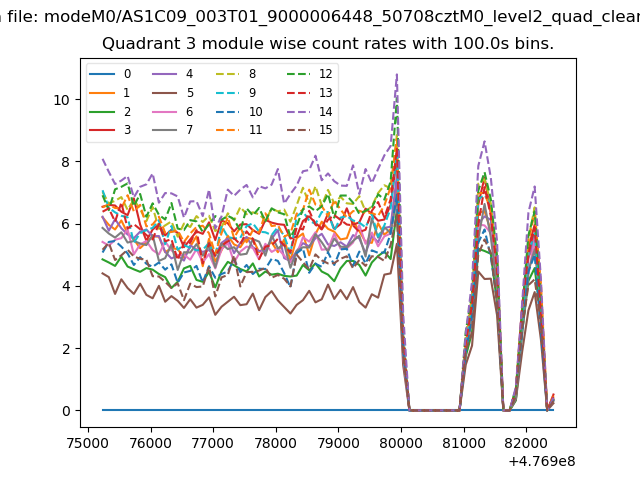
| Module-wise count rates for Quadrant A Data is divided into 100 sec bins |
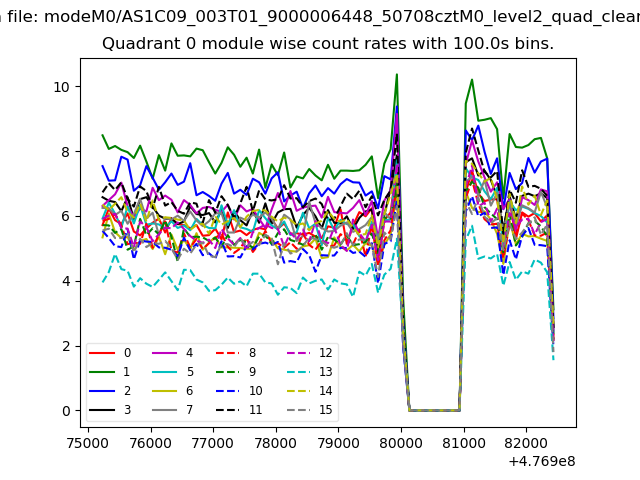 |
 |
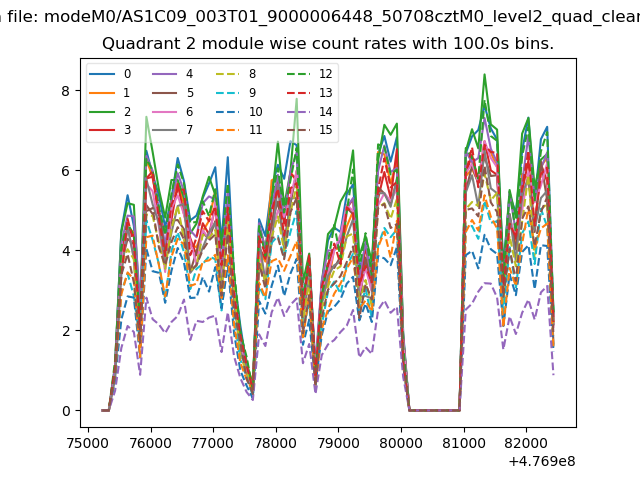
| Module-wise count rates for Quadrant B Data is divided into 100 sec bins |
 |
 |
| Module-wise count rates for Quadrant C Data is divided into 100 sec bins |
 |
 |
| Module-wise count rates for Quadrant D Data is divided into 100 sec bins |
 |
 |
| Parameter | Plot |
|---|---|
| CZT HV Monitor | 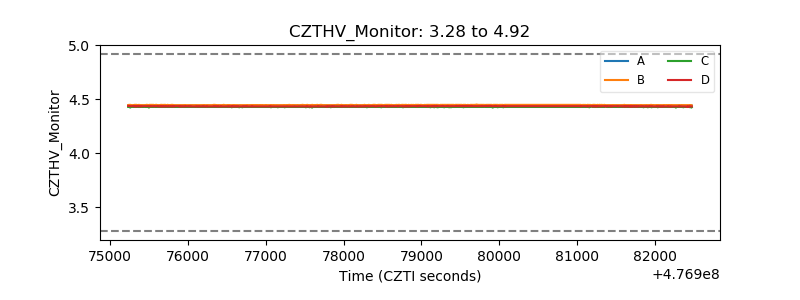 |
| D_VDD | 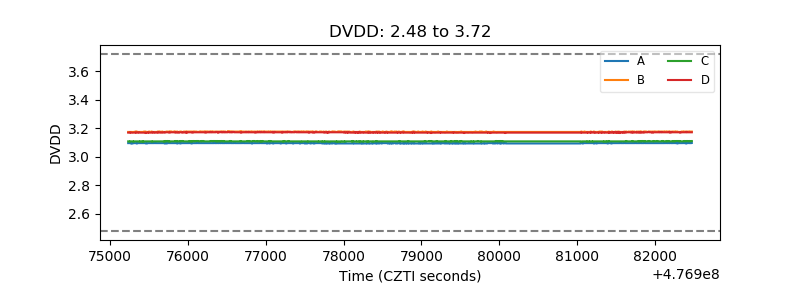 |
| Temperature 1 | 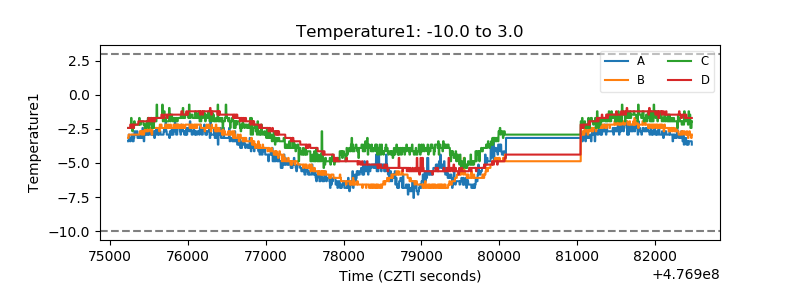 |
| Veto HV Monitor | 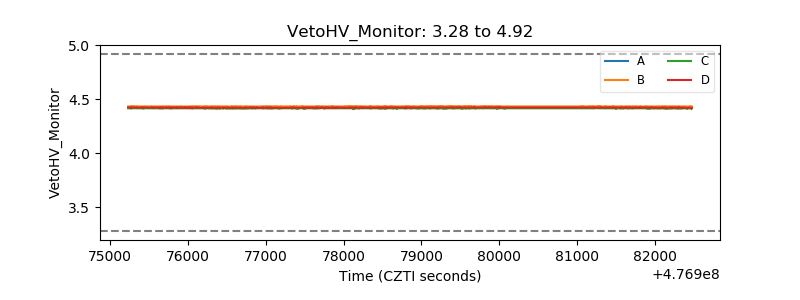 |
| Veto LLD | 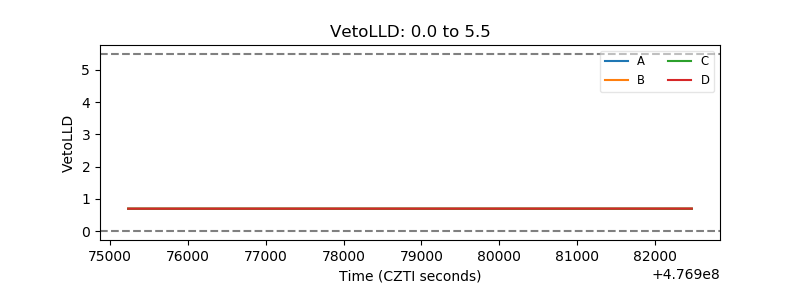 |
| Alpha Counter | 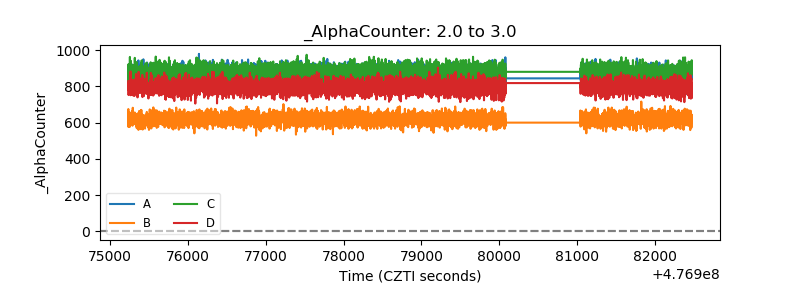 |
| _CPM_Rate | 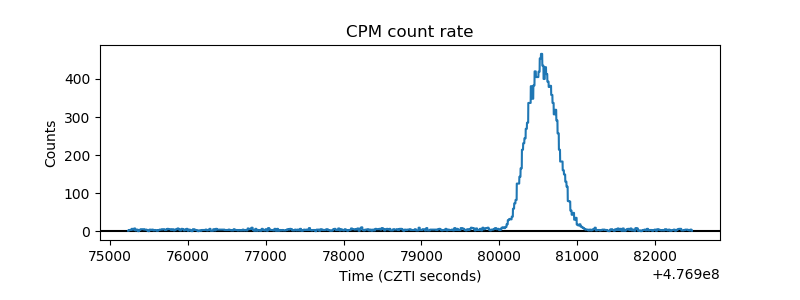 |
| CZT Counter | 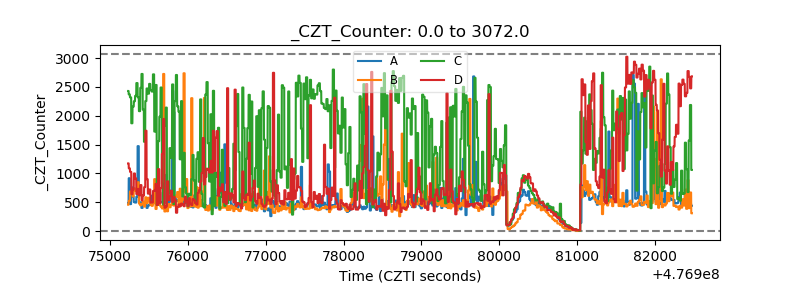 |
| +2.5 Volts monitor | 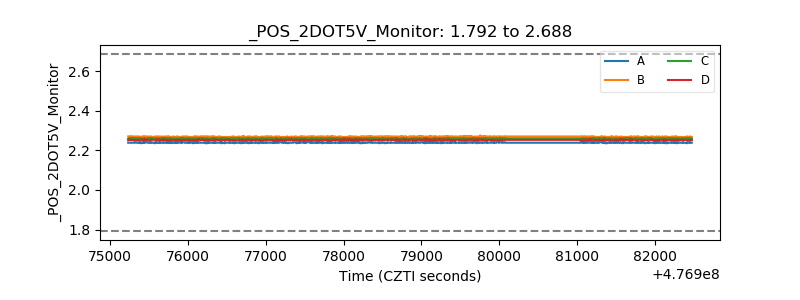 |
| +5 Volts monitor | 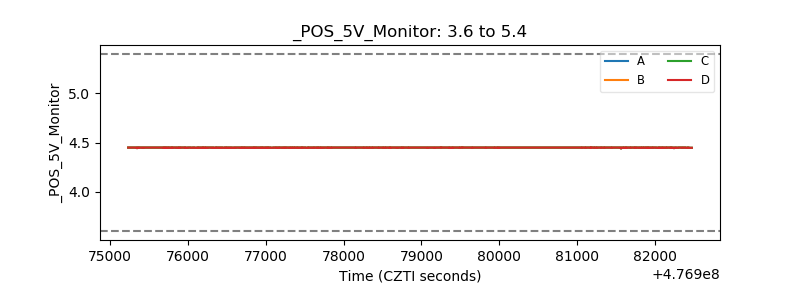 |
| _ROLL_ROT | 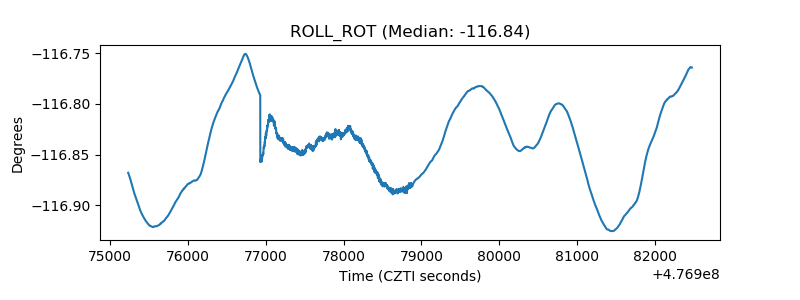 |
| _Roll_DEC | 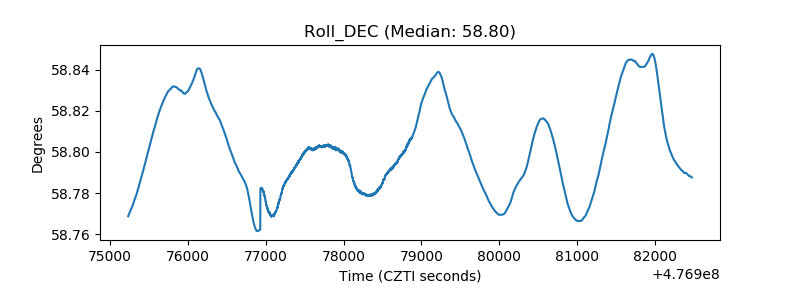 |
| _Roll_RA | 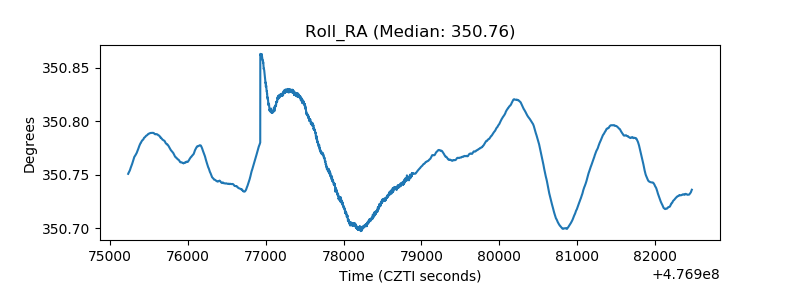 |
| Veto Counter | 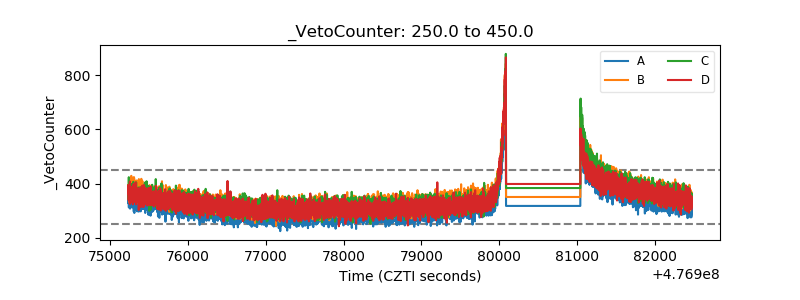 |