| Param | Original file | Final file |
|---|---|---|
| Filename | modeM0/AS1C09_003T01_9000006448_50709cztM0_level2.fits | modeM0/AS1C09_003T01_9000006448_50709cztM0_level2_quad_clean.evt |
| Size (bytes) | 751,875,840 | 77,636,160 |
| Size | 717.0 MB | 74.0 MB |
| Events in quadrant A | 3,579,639 | 589,359 |
| Events in quadrant B | 3,433,208 | 641,846 |
| Events in quadrant C | 7,269,509 | 480,020 |
| Events in quadrant D | 13,072,912 | 209,530 |
| Mode SS | |||
|---|---|---|---|
| Quadrant | BADHDUFLAG | Total packets | Discarded packets |
| A | 0 | 126 | 0 |
| B | 0 | 126 | 0 |
| C | 0 | 126 | 0 |
| D | 0 | 126 | 0 |
| Mode M9 | |||
|---|---|---|---|
| Quadrant | BADHDUFLAG | Total packets | Discarded packets |
| A | 0 | 11 | 0 |
| B | 0 | 11 | 0 |
| C | 0 | 11 | 0 |
| D | 0 | 11 | 0 |
| Mode M0 | |||
|---|---|---|---|
| Quadrant | BADHDUFLAG | Total packets | Discarded packets |
| A | 0 | 14551 | 1 |
| B | 0 | 14531 | 1 |
| C | 0 | 25758 | 1 |
| D | 0 | 43017 | 2 |
| Quadrant | Total seconds | Saturated seconds | Saturation percentage |
|---|---|---|---|
| A | 6152 | 110 | 1.788036% |
| B | 6152 | 170 | 2.763329% |
| C | 6153 | 1317 | 21.404193% |
| D | 6152 | 4105 | 66.726268% |
Noise dominated data is calculated using 1-second bins in cleaned event files. If a bin has >2000 counts, and if more than 50% of those come from <1% of pixels, then it is considered to be noise-dominated and hence unusable.
| Quadrant | # 1 sec bins | Bins with >0 counts | Bins with >2000 counts | High rate bins dominated by noise | Noise dominated (total time) | Noise dominated (detector-on time) | Marked lightcurve |
|---|---|---|---|---|---|---|---|
| A | 7217 | 6153 | 60 | 60 | 0.83% | 0.98% | 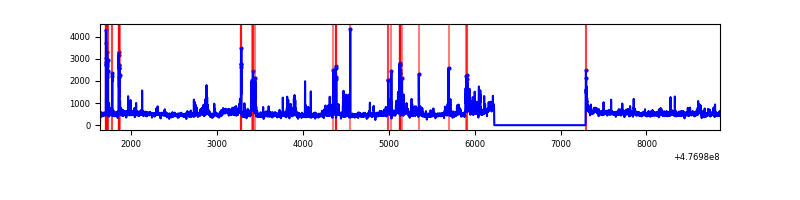 |
| B | 7217 | 6153 | 84 | 84 | 1.16% | 1.37% | 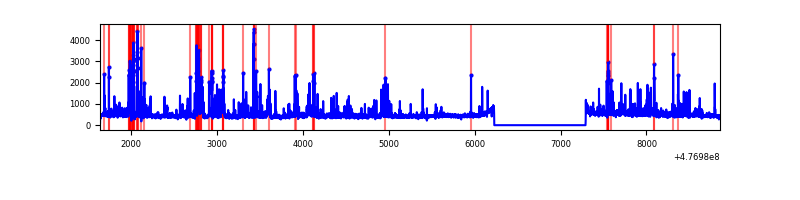 |
| C | 7218 | 6153 | 1015 | 1015 | 14.06% | 16.50% |  |
| D | 7217 | 6152 | 3597 | 3597 | 49.84% | 58.47% | 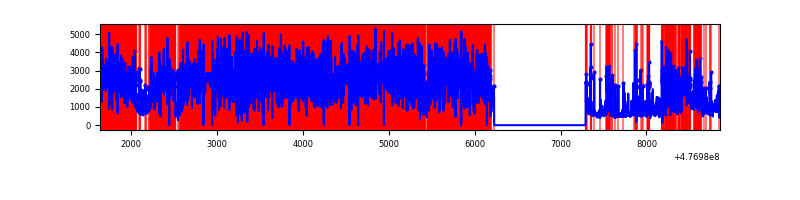 |
Top three noisy pixels from each quadrant. If the there are fewer than three noisy pixels in the level2.evt file, extra rows are filled as -1
| Pixel properties | Quadrant properties | ||||||
|---|---|---|---|---|---|---|---|
| Quadrant | DetID | PixID | Counts | Sigma | Mean | Median | Sigma |
| A | 4 | 3 | 300922 | 1849.65 | 651 | 634 | 162.3 |
| A | 0 | 31 | 127647 | 782.35 | 651 | 634 | 162.3 |
| A | 8 | 247 | 126747 | 776.8 | 651 | 634 | 162.3 |
| B | 0 | 229 | 268566 | 1959.59 | 649 | 628 | 136.7 |
| B | 7 | 0 | 176514 | 1286.36 | 649 | 628 | 136.7 |
| B | 8 | 128 | 104433 | 759.19 | 649 | 628 | 136.7 |
| C | 5 | 10 | 1910317 | 11685.62 | 590 | 584 | 163.4 |
| C | 0 | 193 | 1263263 | 7726.31 | 590 | 584 | 163.4 |
| C | 15 | 1 | 439347 | 2684.78 | 590 | 584 | 163.4 |
| D | 8 | 176 | 9561898 | 82922.76 | 412 | 397 | 115.3 |
| D | 10 | 98 | 855947 | 7419.81 | 412 | 397 | 115.3 |
| D | 6 | 63 | 303115 | 2625.34 | 412 | 397 | 115.3 |
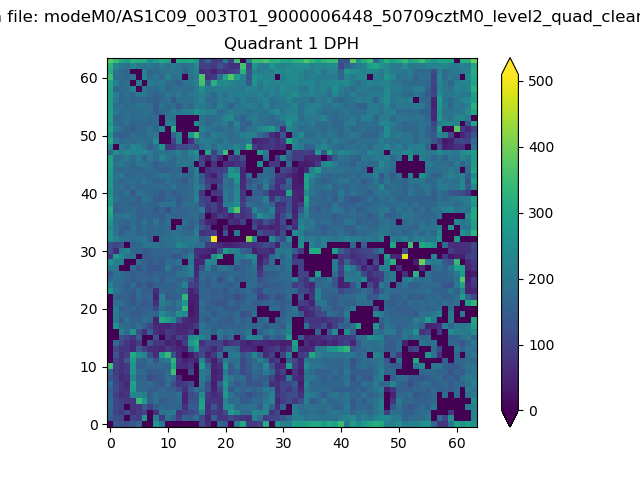
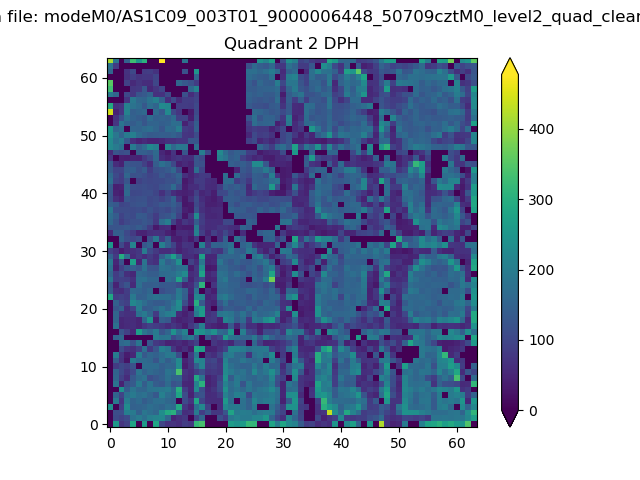
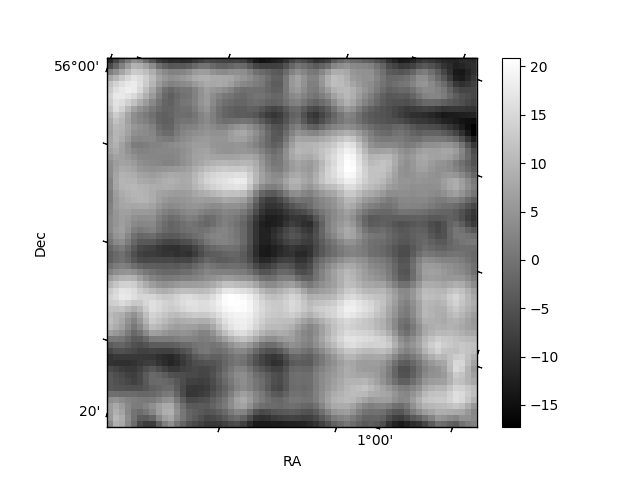
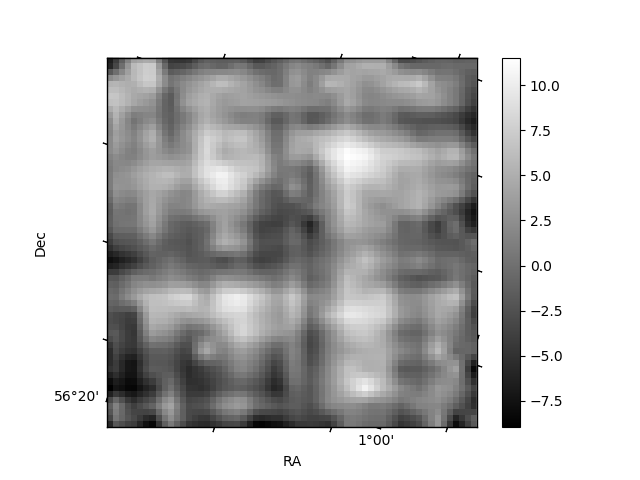
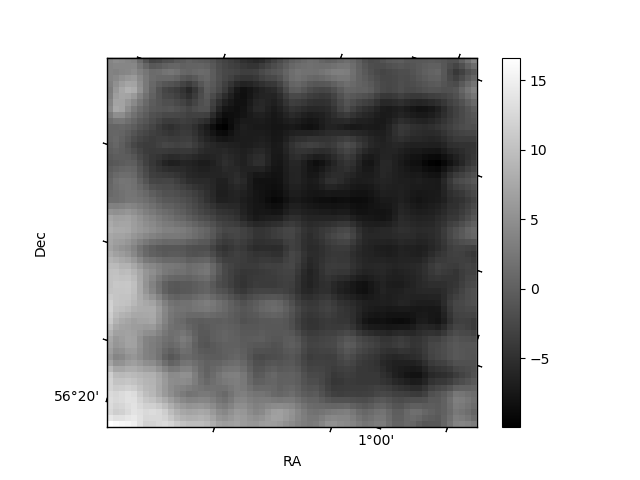
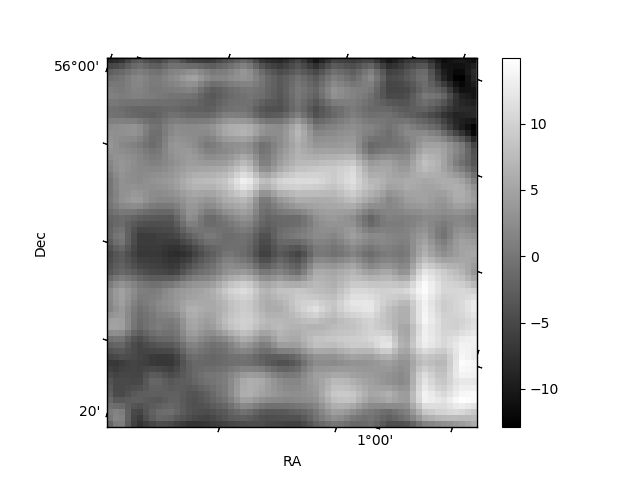
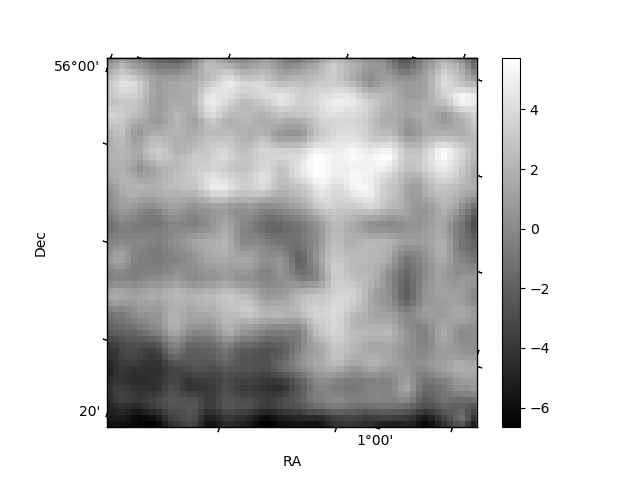
Histogram calculated using DETX and DETY for each event in the final _common_clean file
| Quadrant A | 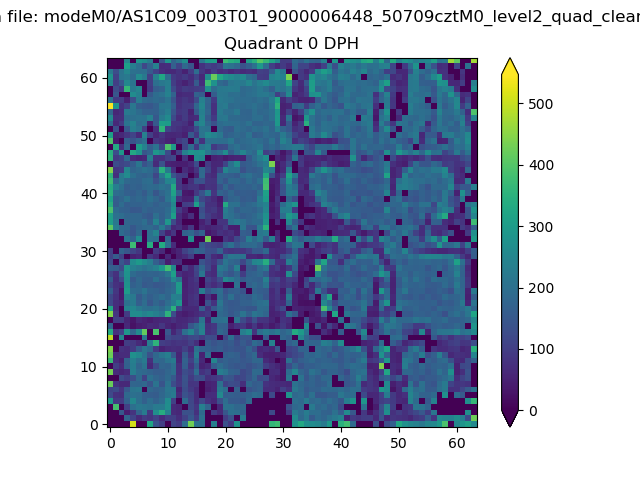 |
 |
Quadrant B |
|---|---|---|---|
| Quadrant D | 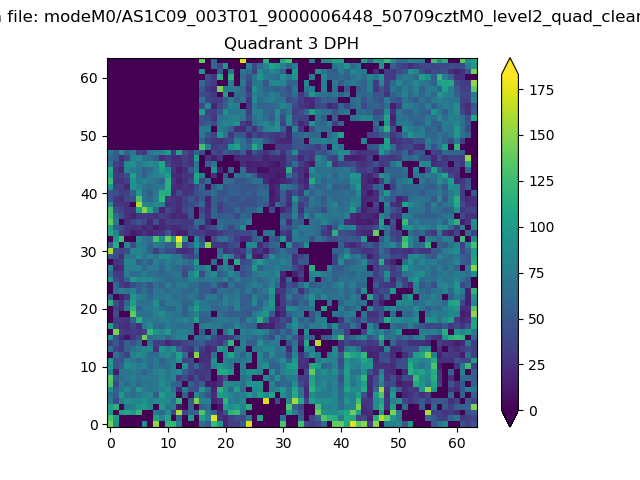 |
 |
Quadrant C |
| Plot type | Count rate plots | Images |
|---|---|---|
| Comparison with Poisson distribution Blue bars denote a histogram of data divided into 1 sec bins. Red curve is a Poisson curve with rate = median count rate of data. |
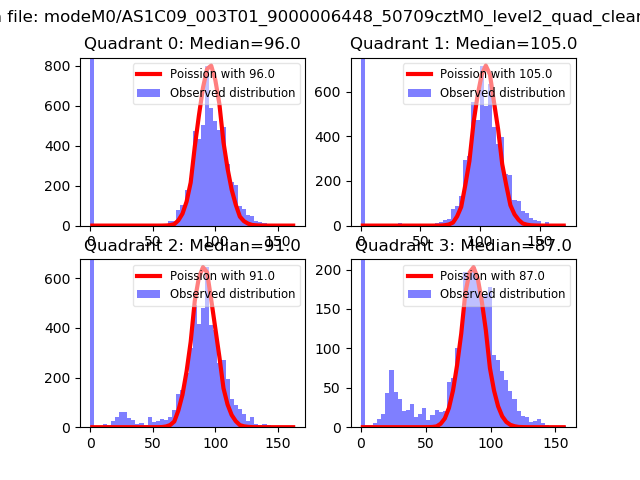 |
 |
| Quadrant-wise count rates Data is divided into 100 sec bins |
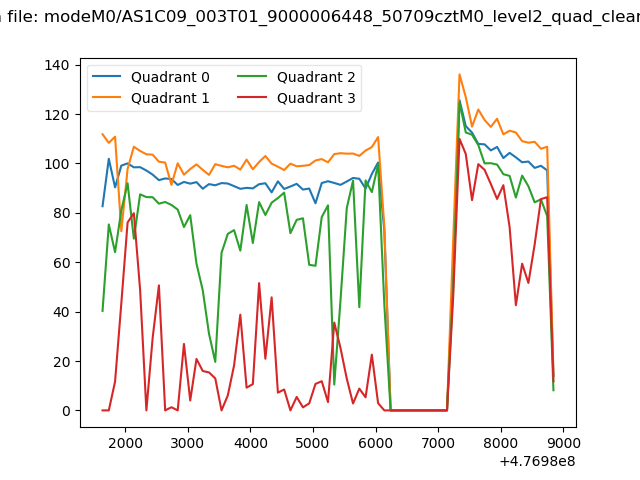 |
|
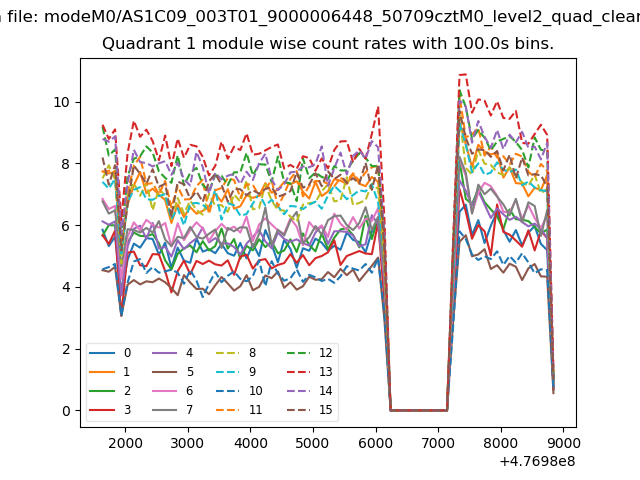
| Module-wise count rates for Quadrant A Data is divided into 100 sec bins |
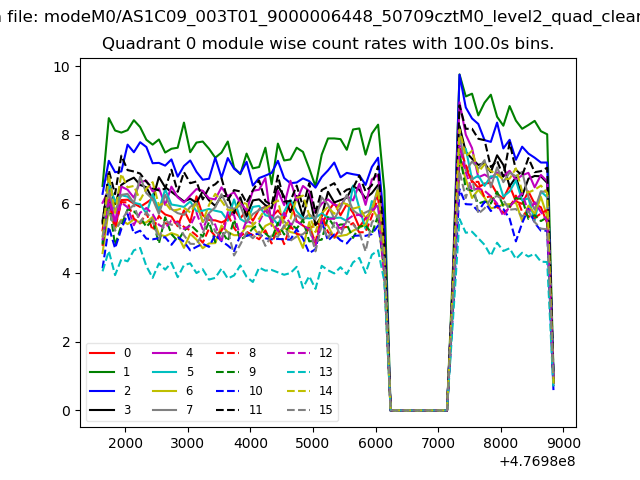 |
 |
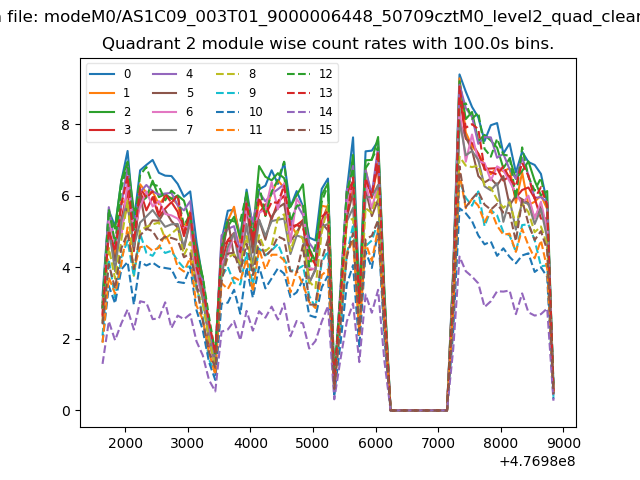
| Module-wise count rates for Quadrant B Data is divided into 100 sec bins |
 |
 |
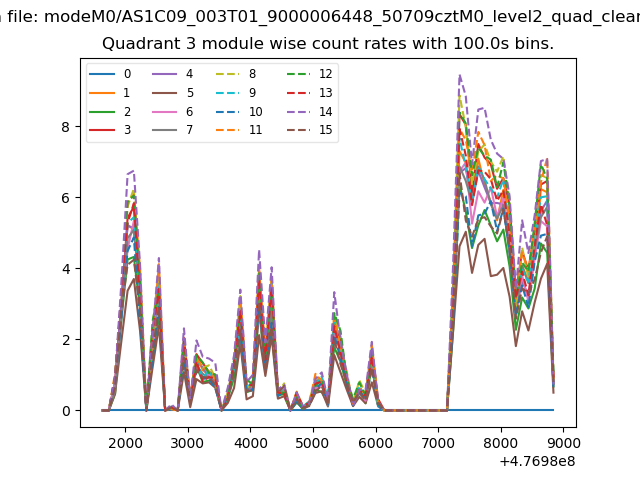
| Module-wise count rates for Quadrant C Data is divided into 100 sec bins |
 |
 |
| Module-wise count rates for Quadrant D Data is divided into 100 sec bins |
 |
 |
| Parameter | Plot |
|---|---|
| CZT HV Monitor | 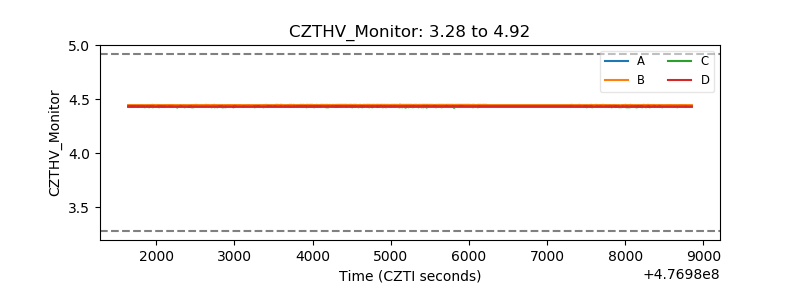 |
| D_VDD | 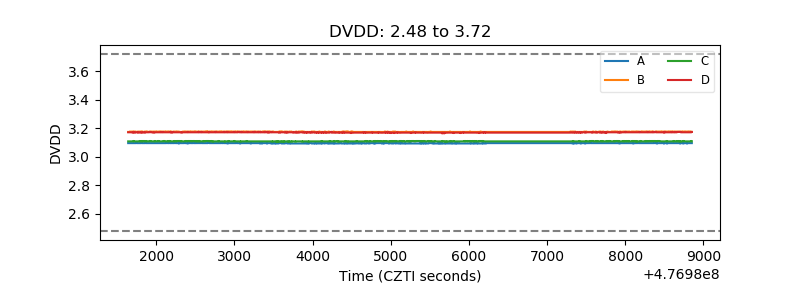 |
| Temperature 1 | 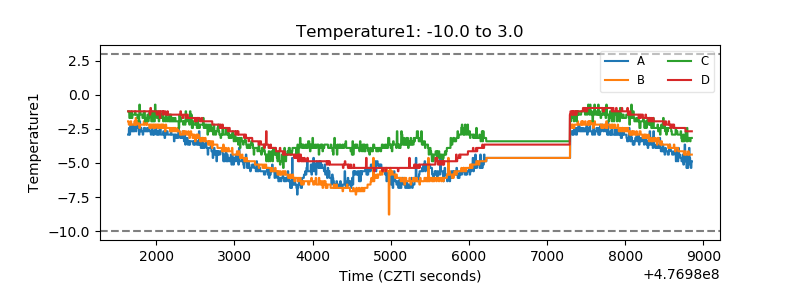 |
| Veto HV Monitor |  |
| Veto LLD | 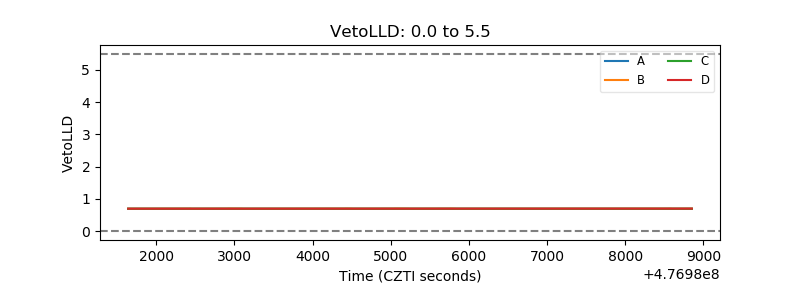 |
| Alpha Counter | 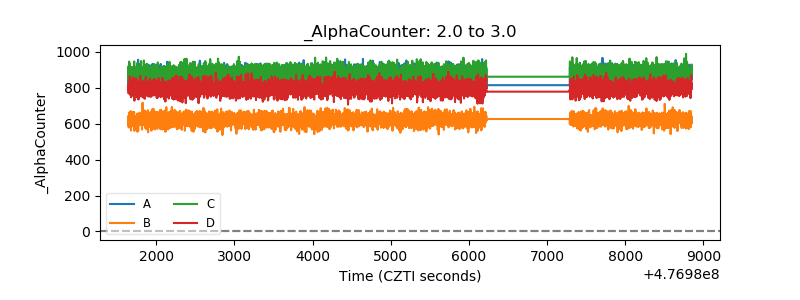 |
| _CPM_Rate | 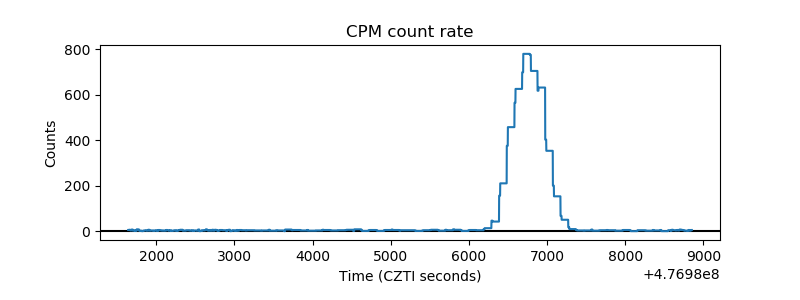 |
| CZT Counter | 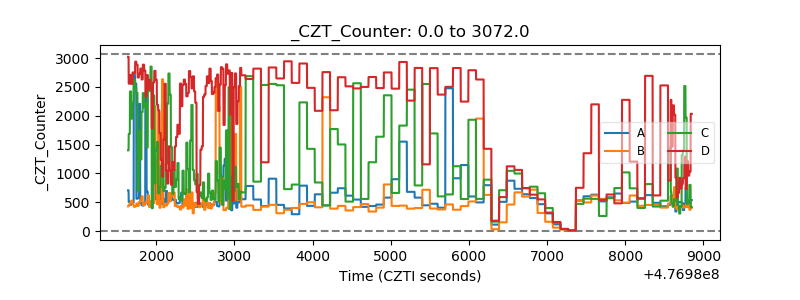 |
| +2.5 Volts monitor | 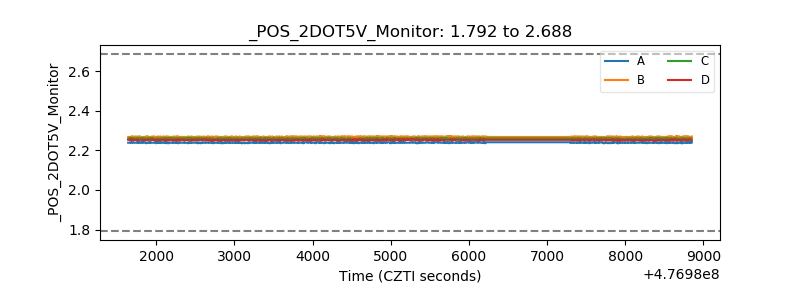 |
| +5 Volts monitor |  |
| _ROLL_ROT | 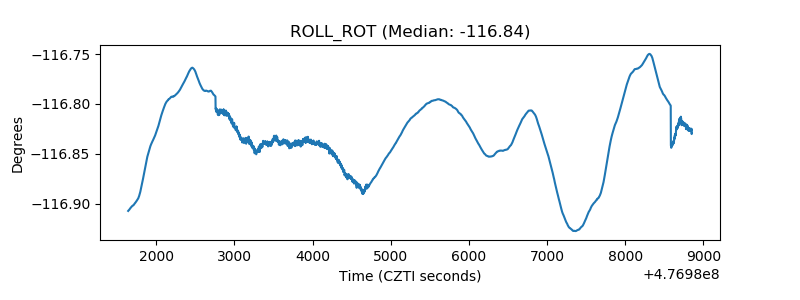 |
| _Roll_DEC | 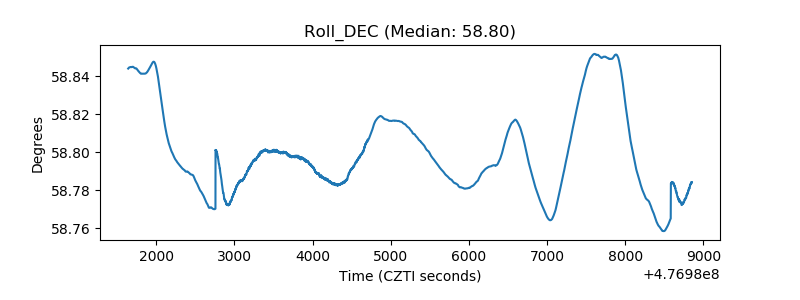 |
| _Roll_RA | 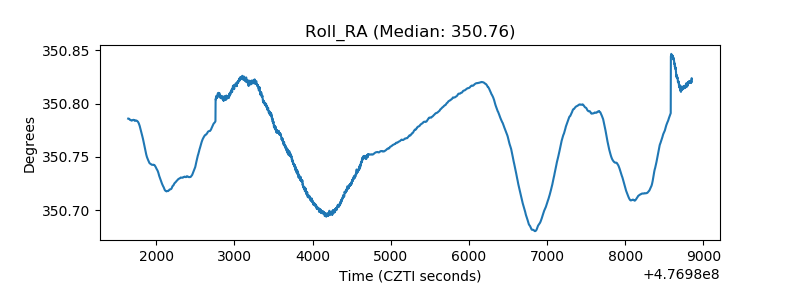 |
| Veto Counter | 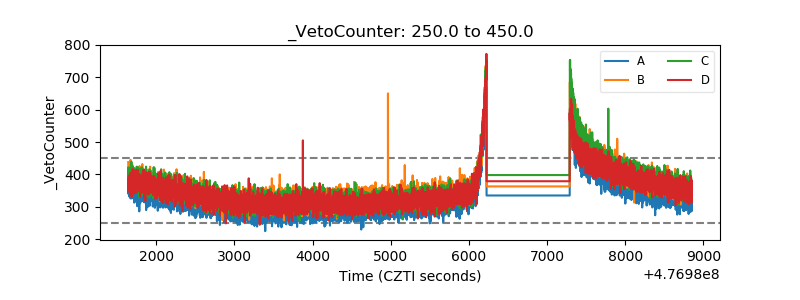 |